![]()
BUSINESS
American Woodmark Corporation manufactures and distributes kitchen, bath, office, home organization, and hardware products for the remodelling and new home construction markets in the United States. The company offers made-to-order and cash and carry products. It also provides turnkey installation services to its direct builder customers through a network of eight service centers. The company sells its products under the American Woodmark, Timberlake, Shenandoah Cabinetry, Waypoint Living Spaces, Estate, Stor-It-All, and Professional Cabinet Solutions brands, as well as Hampton Bay, Glacier Bay, Style Selections, Allen + Roth, Home Decorators Collection, and Project Source. It markets its products directly to home centers and builders, as well as through independent dealers and distributors. The company was incorporated in 1980 and is based in Winchester, Virginia.
INVESTMENT RATING
Reflecting future returns on capital that are forecasted to be above the cost of capital, AMWD is expected to continue to be an important Value Builder.
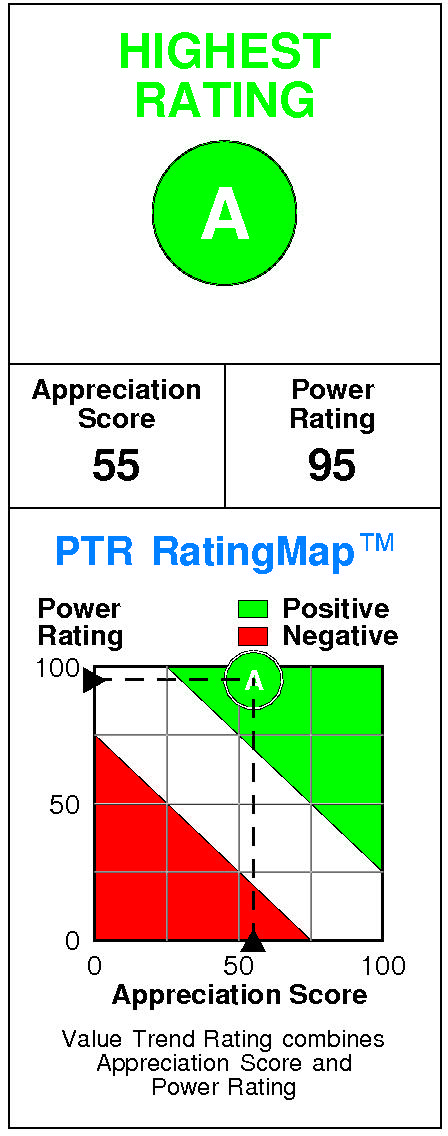
American Woodmark has a current Value Trend Rating of A (Highest Rating).
This rating combines inconsistent signals from two proprietary PTR measures of a stock’s attractiveness. American Woodmark has a neutral Appreciation Score of 55 but a very high Power Rating of 95, producing the Highest Value Trend Rating.
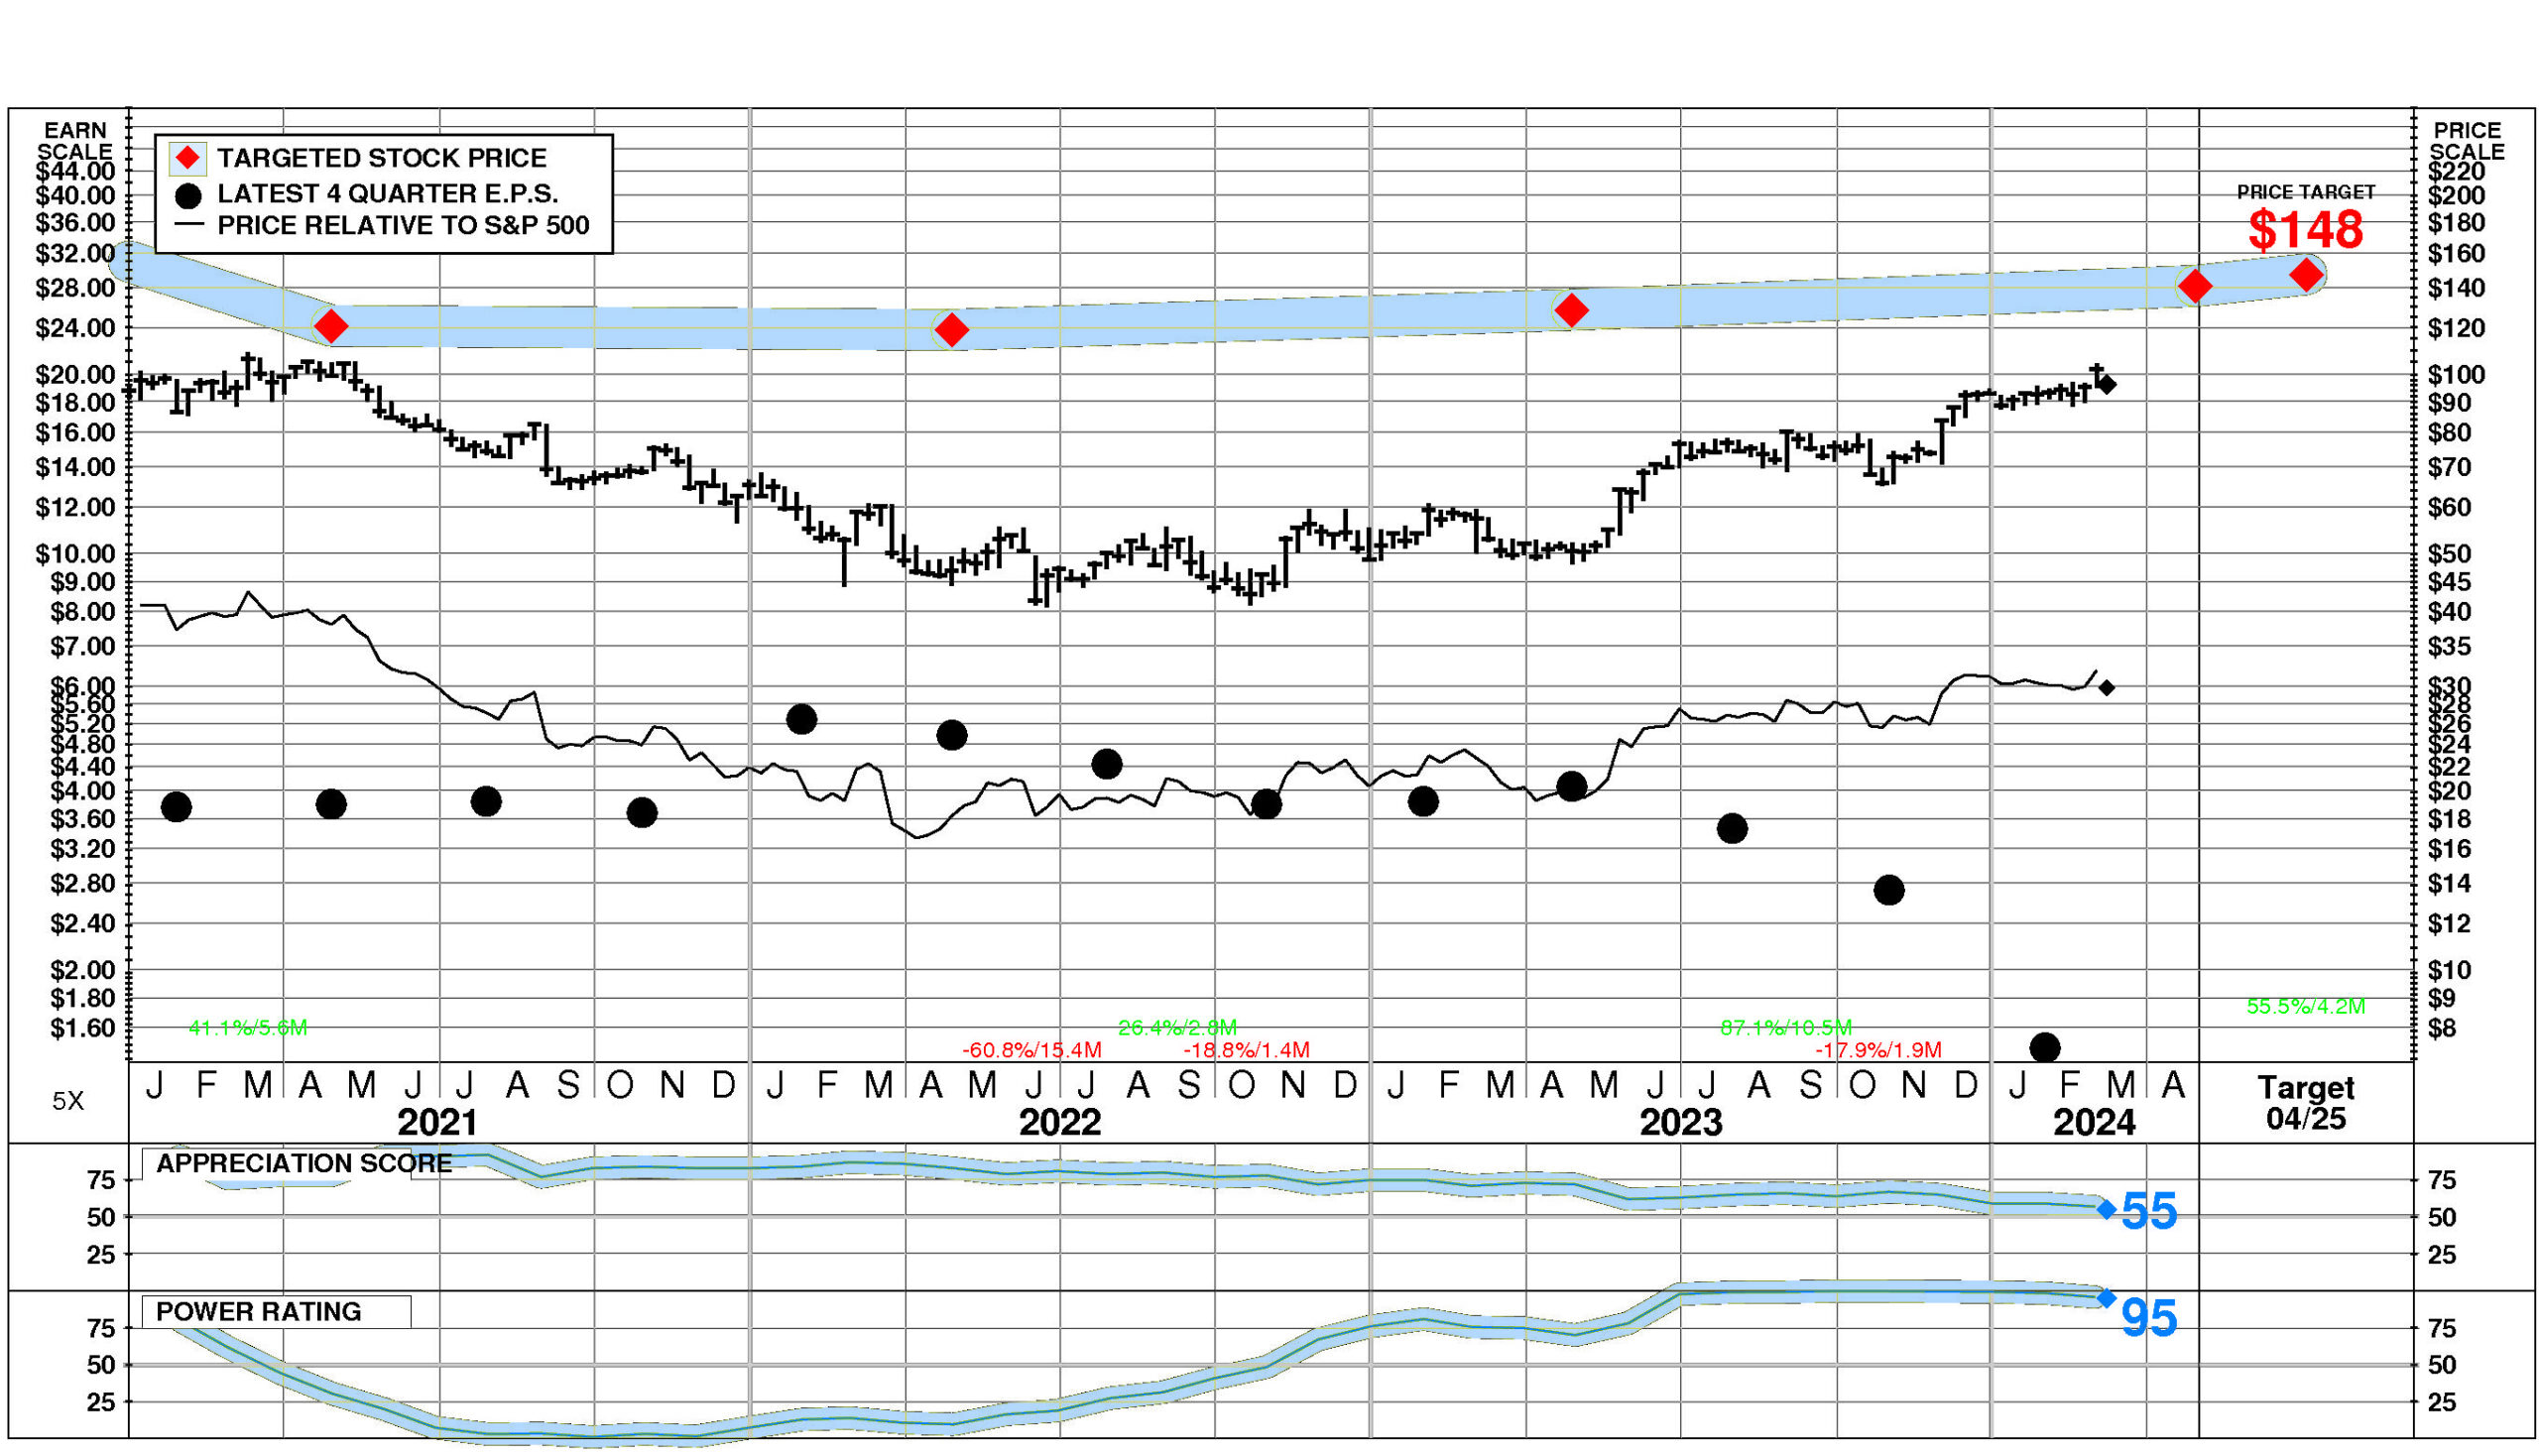
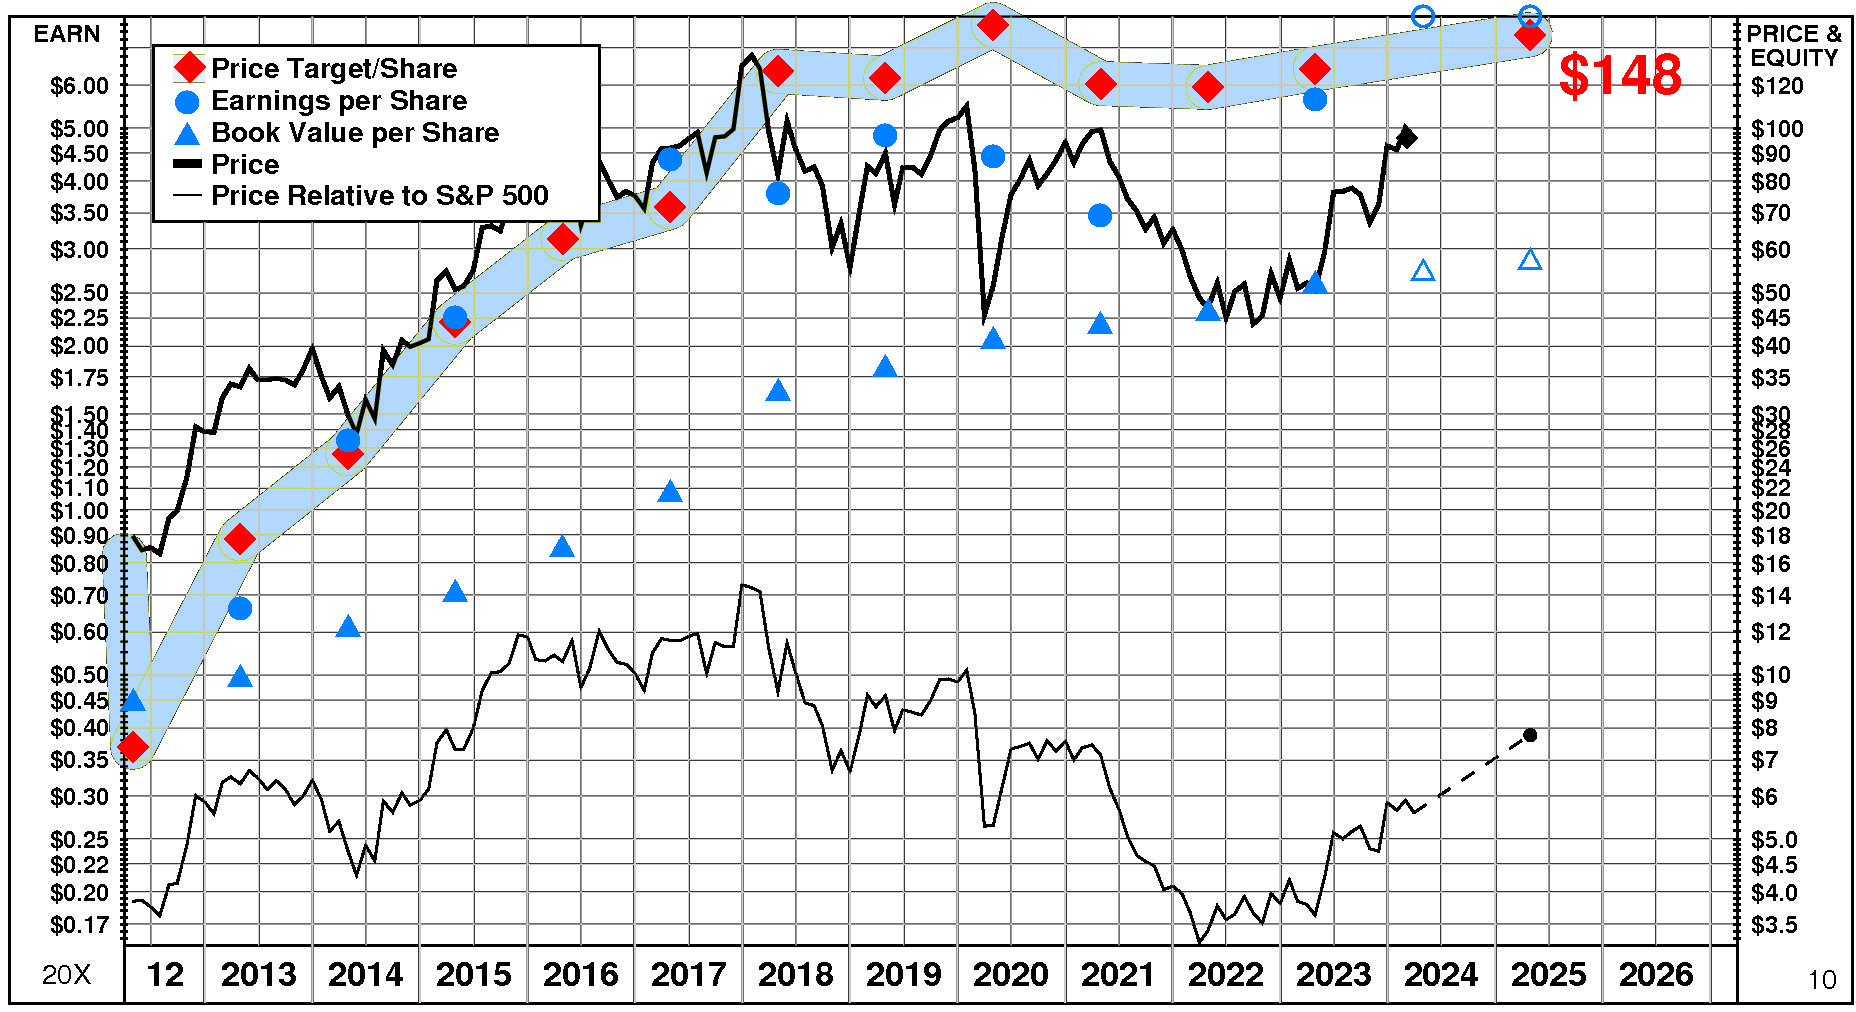
American Woodmark’s stock is selling well below targeted value. The current stock price of $96.23 compares to targeted value 12 months forward of $147.
This neutral appreciation potential results in an appreciation score of 55 (45% of the universe has greater appreciation potential.)
American Woodmark has a Power Rating of 95. (AMWD’s very high Power Rating indicates that it has a higher likelihood of achieving favorable investment performance over the near to intermediate term than all but 5% of companies in the universe.)
Factors contributing to this very high Power Rating include: recent price action has been extremely favorable; the Millwork, Veneer, Plywood comparison group is in a strong phase currently; and the recent trend in AMWD’s earnings estimates has been favorable.
INVESTMENT PROFILE
AMWD’s financial strength is high. Financial strength rating is 72.
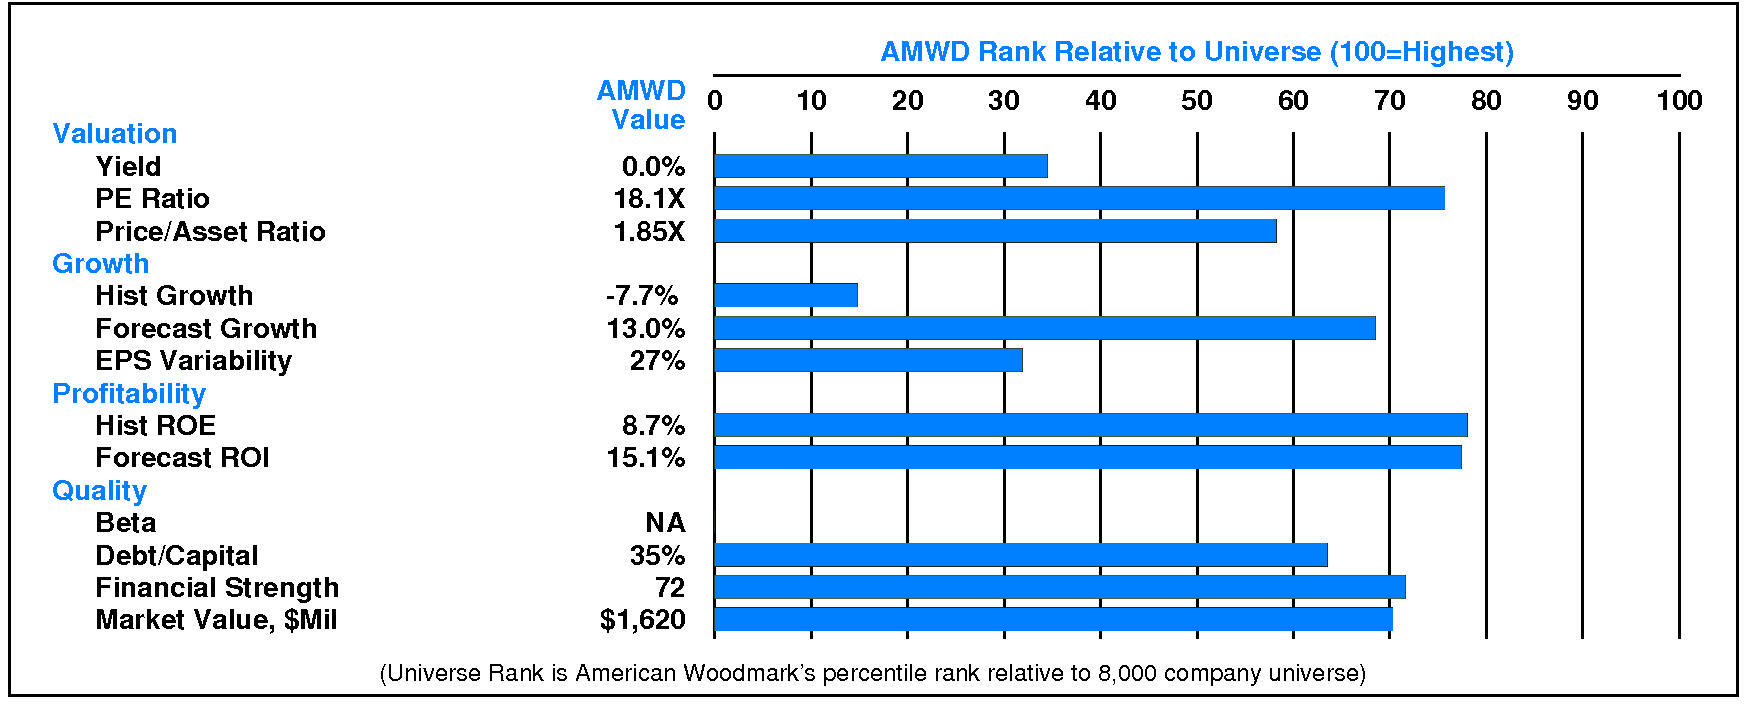
Relative to the S&P 500 Composite, American Woodmark Corp has moderate Value characteristics; its appeal is likely to be to Capital Gain-oriented investors; the perception is that AMWD is normal risk. High expected growth is a positive for AMWD. Low historical growth is a relative weakness for AMWD. AMWD’s valuation is low: low dividend yield, low P/E ratio, and low price/book ratio. AMWD has unusually low market capitalization.
CURRENT SIGNALS
American Woodmark’s current operations are strong. Return on equity is rising, reflecting: improving asset utilization; widening pretax margins; rising tax keep rate; and rising leverage.
American Woodmark’s current technical position is very strong. The stock price is in a 4.2 month up move. The stock has appreciated 55.5% from its prior low. The stock price is above its 200 day moving average which is in an uptrend.
ALERTS
Marginal negative changes in American Woodmark Corp (NASDAQ: AMWD) fundamentals have recently occurred: significant quarterly earnings deceleration occurred.
The stock is currently rated A.
American Woodmark Corp (NASDAQ: AMWD) stock closed at $96.23 on 3/7/24 after an increase of 1.6%. NORMAL trading volume accompanied the advance. The stock has declined -4.8% during the last week but has been exceptionally strong relative to the market over the last nine months.
CASH FLOW
In 2023, American Woodmark generated a very significant increase in cash of +$19.4 million (+87%). Sources of cash were much larger than uses. Cash generated from 2023 EBITDA totaled +$229.5 million. Non-operating sources contributed +$0.7 million (+0% of EBITDA). Cash taxes consumed -$55.4 million (-24% of EBITDA). Withdrawal of investment from the business totaled +$1.6 million (+1% of EBITDA). On a net basis, debt investors withdrew -$164.3 million (-72% of EBITDA) while equity investors supplied +$7.2 million (+3% of EBITDA).
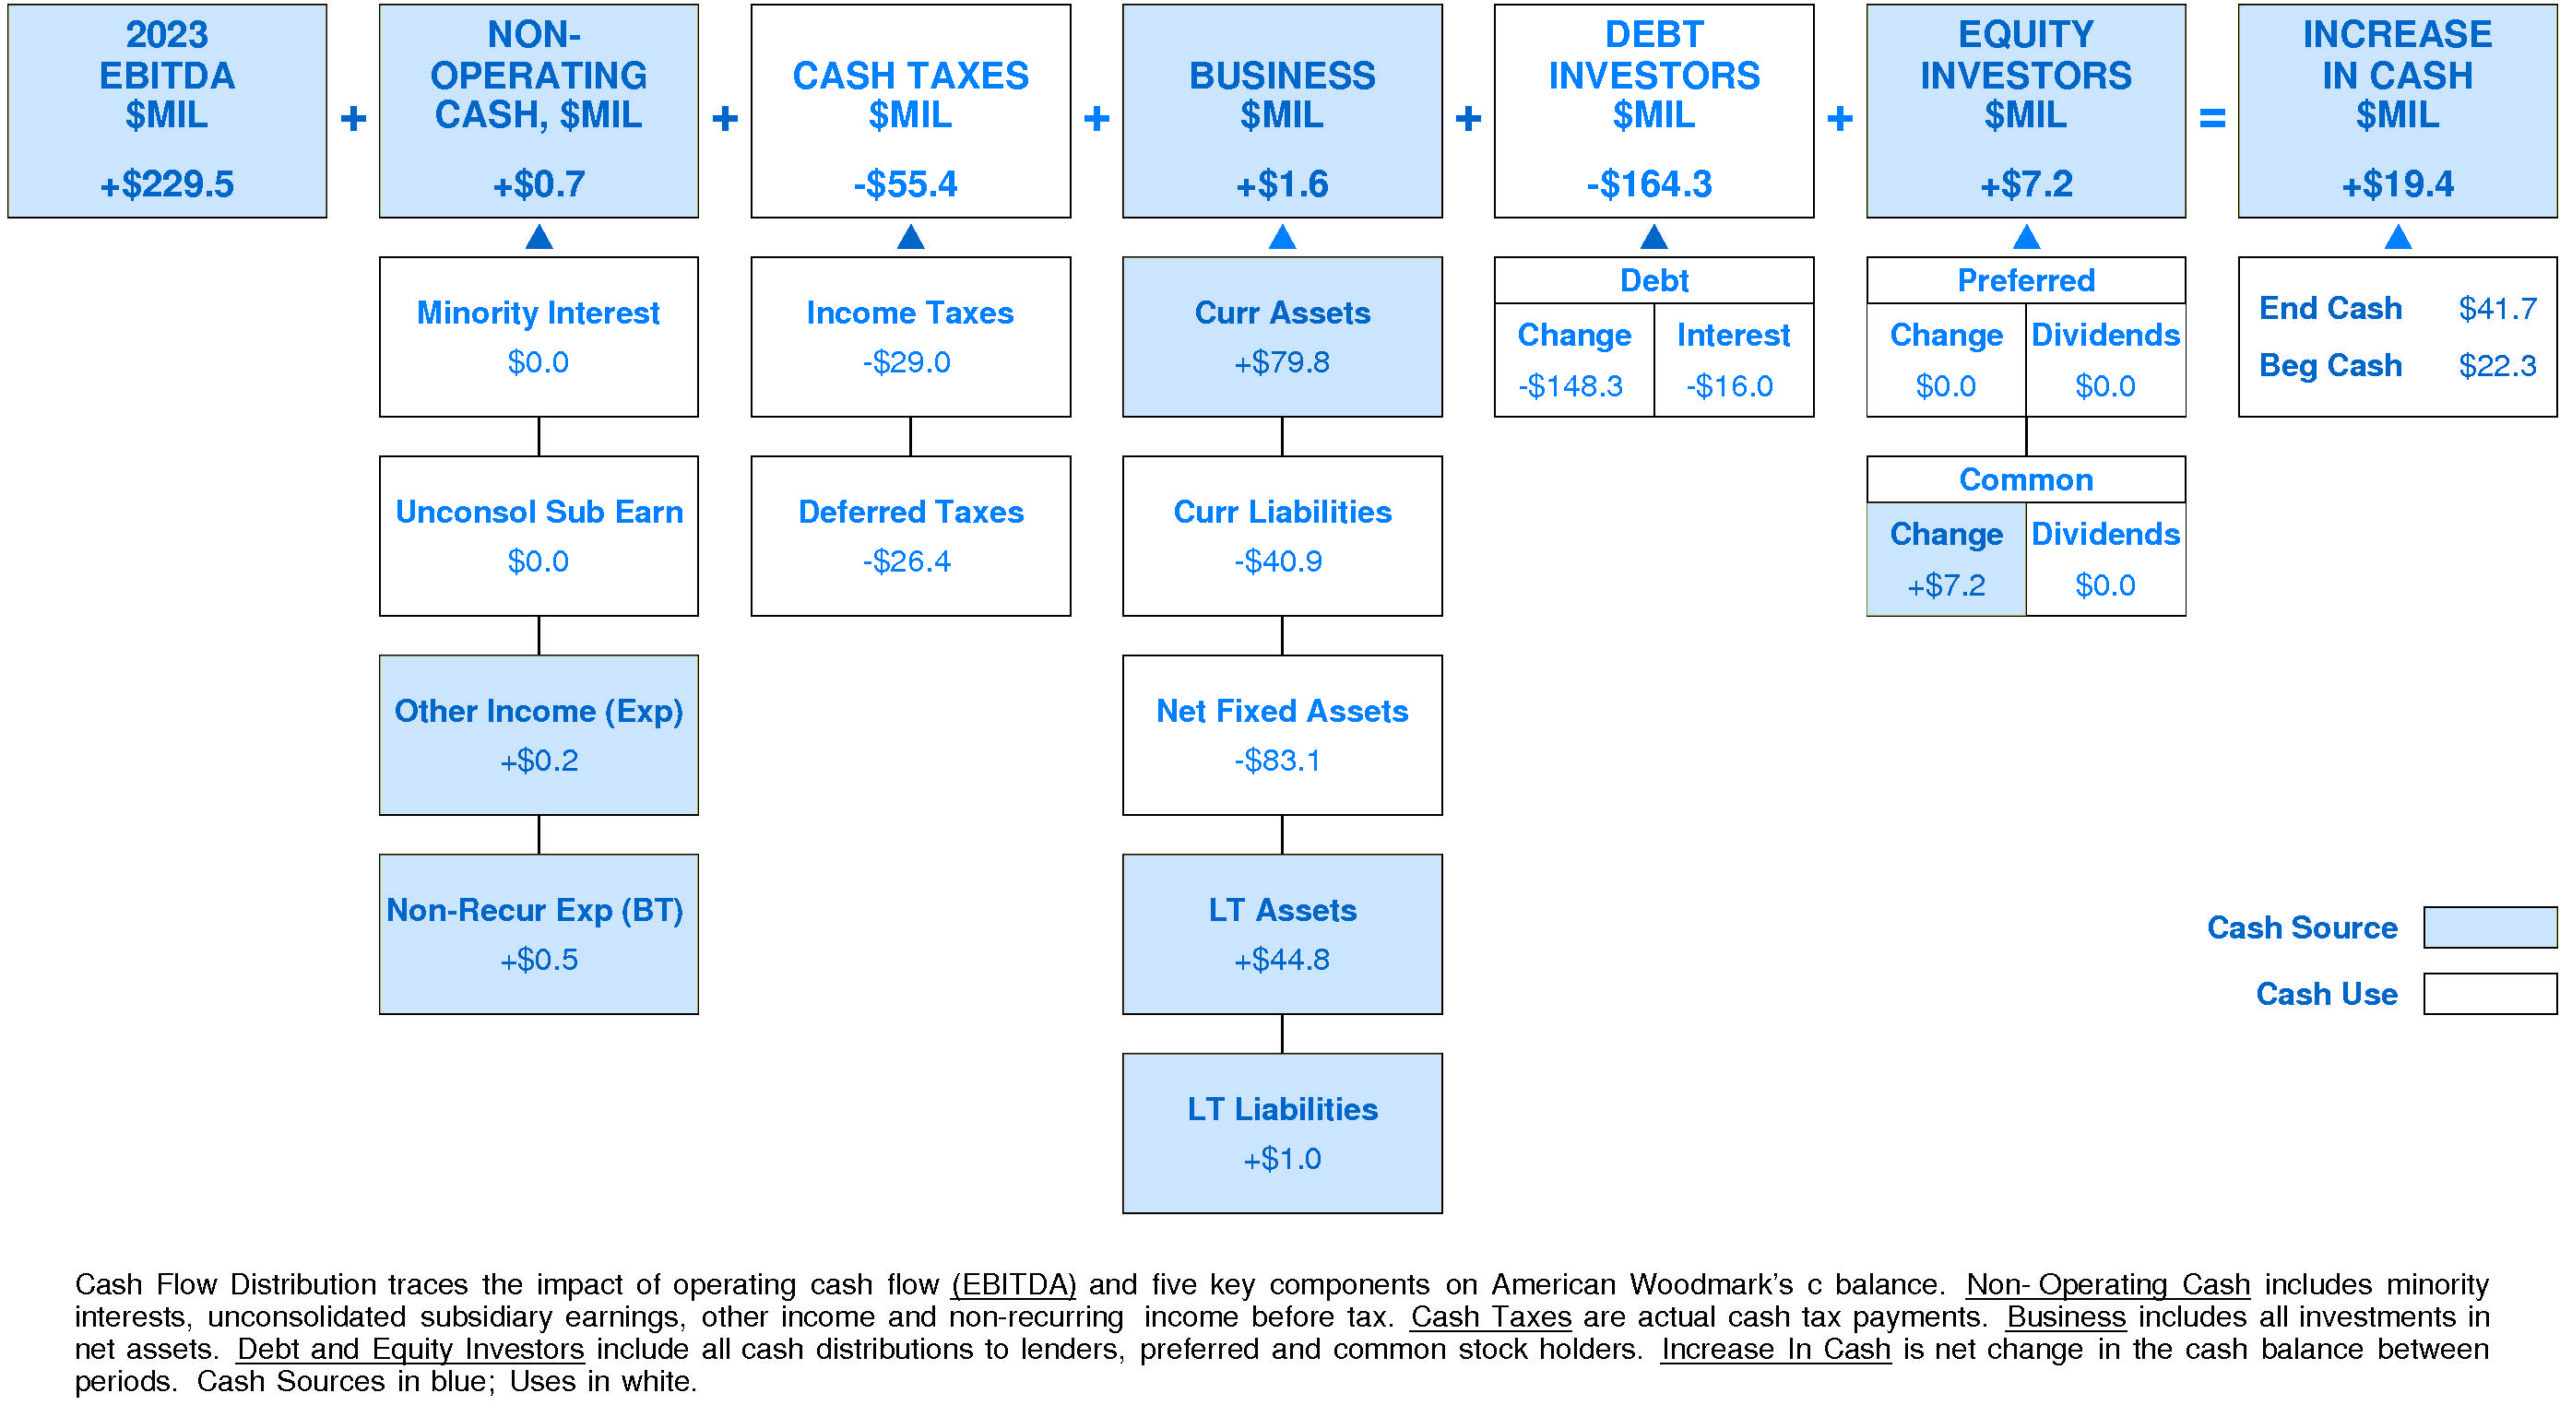
American Woodmark’s Non-operating Income, %EBITDA has suffered a volatile overall downtrend over the period. This downtrend was accompanied by a similar trend for the American Woodmark Peer Group. In most years, American Woodmark was in the top quartile. Currently, American Woodmark is at the upper quartile at +0% of EBITDA (+$0.7 million).
American Woodmark’s Cash Taxes, %EBITDA enjoyed a volatile overall uptrend over the period. This improvement was accompanied by stability for the American Woodmark Peer Group. In most years, American Woodmark was in the lower quartile and top quartile. Currently, American Woodmark is below median at -24% of EBITDA (-$55.4 million).
American Woodmark’s Business Re-investment, %EBITDA has exhibited a volatile overall uptrend over the period. This improvement was accompanied by stability for the American Woodmark Peer Group. In most years, American Woodmark was in the second quartile and lower quartile. Currently, American Woodmark is above median at +1% of EBITDA (+$1.6 million).
American Woodmark’s Debt Investors, %EBITDA has experienced a volatile overall downtrend over the period. This downtrend was accompanied by stability for the American Woodmark Peer Group. In most years, American Woodmark was in the second quartile and lower quartile. Currently, American Woodmark is lower quartile at -72% of EBITDA (-$164.3 million).
American Woodmark’s Equity Investors, %EBITDA has experienced a downtrend over the period. This downtrend was accompanied by a similar trend for the American Woodmark Peer Group. In most years, American Woodmark was in the second quartile and top quartile. Currently, American Woodmark is at the upper quartile at +3% of EBITDA (+$7.2 million).
American Woodmark’s Change in Cash, %EBITDA has experienced a very strong overall downtrend over the period. This downtrend was accompanied by a similar trend for the American Woodmark Peer Group. In most years, American Woodmark was in the top quartile and lower quartile. Currently, American Woodmark is slightly above median at +8% of EBITDA (+$19.4 million).
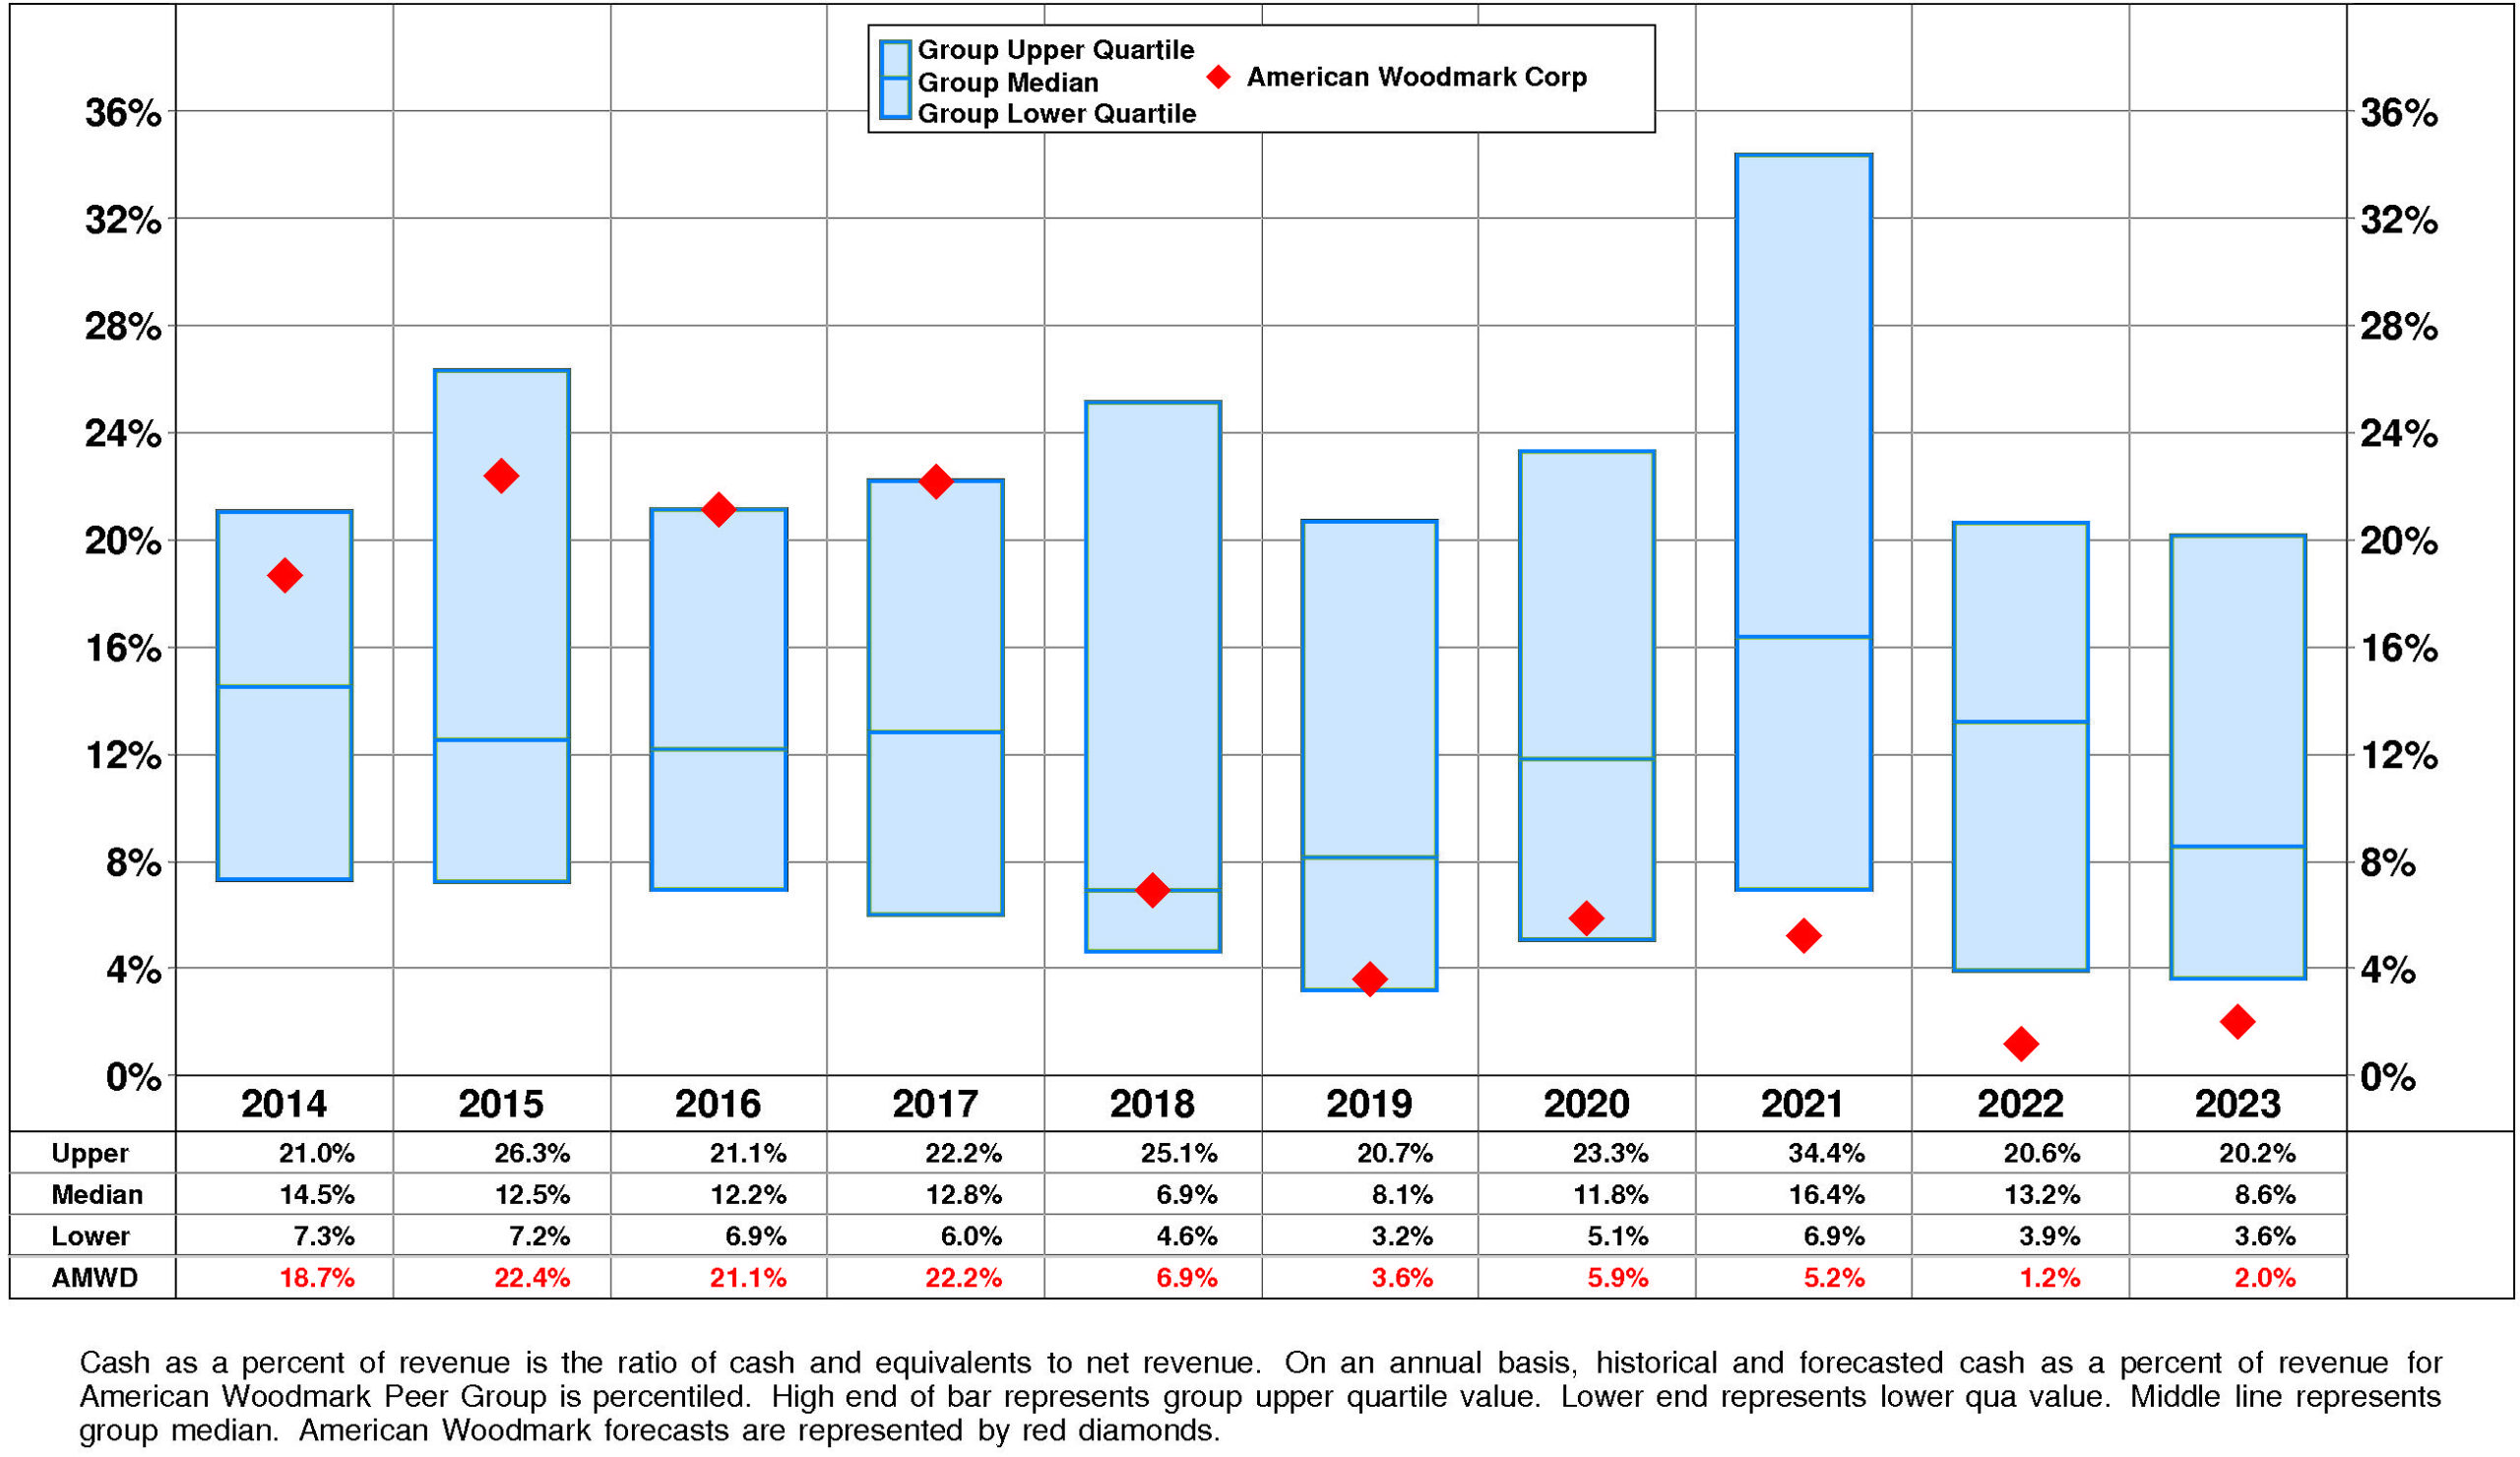
American Woodmark’s Cash, %Revenue has suffered a strong overall downtrend over the period. This downtrend was accompanied by stability for the American Woodmark Peer Group. In most years, American Woodmark was in the lower quartile and top quartile. Currently, American Woodmark is lower quartile at +2%.
PROFITABILITY
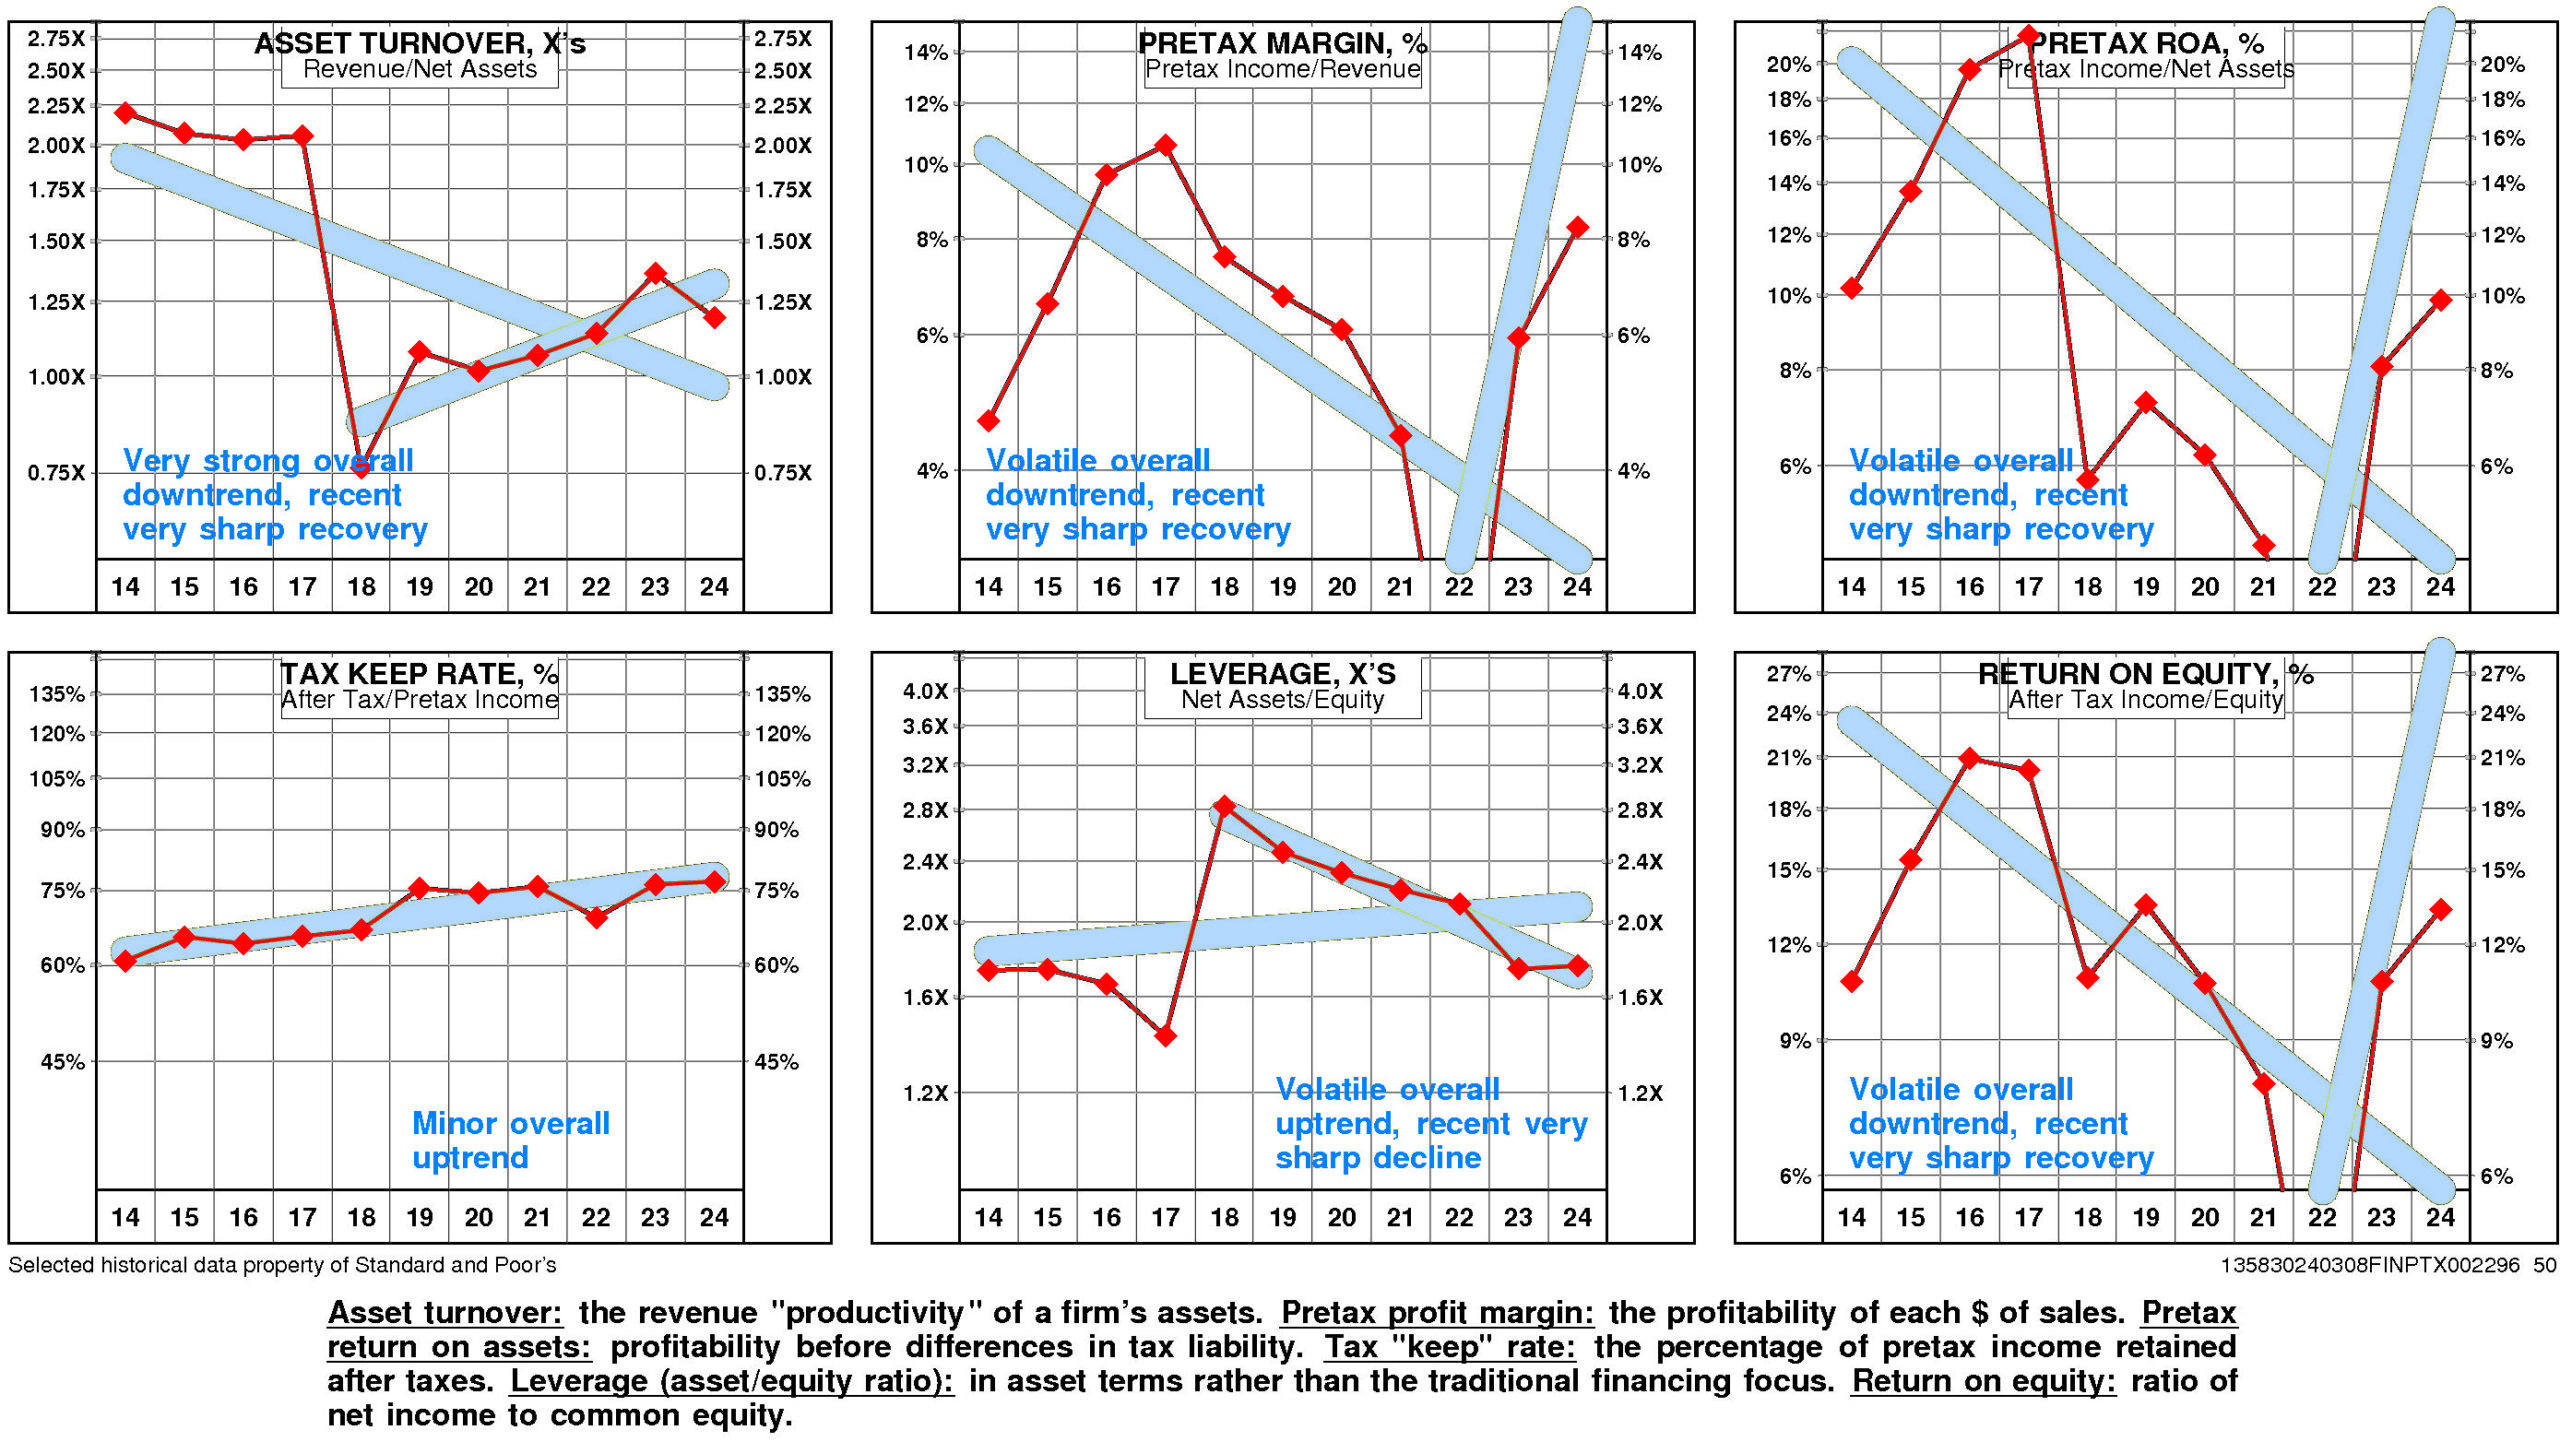
American Woodmark’s return on equity has eroded very significantly since 2014. The current level is 13.3% versus the high of 10.7% and the low of -3.8%.
This very significant erosion was due to very strong negative trend in pretax operating return and strong positive trend in non-operating factors.
The productivity of American Woodmark’s assets declined over the full period 2014-2024: asset turnover has suffered a very strong overall downtrend although it experienced a very sharp recovery after the 2018 low.
Reinforcing this trend, pretax margin experienced a strong overall downtrend even as it experienced a very sharp recovery after the 2022 low.
Non-operating factors (income taxes and financial leverage) had a significant positive influence on return on equity.
American Woodmark’s return on equity is upper quartile (13.3%) for the four quarters ended January, 2024.
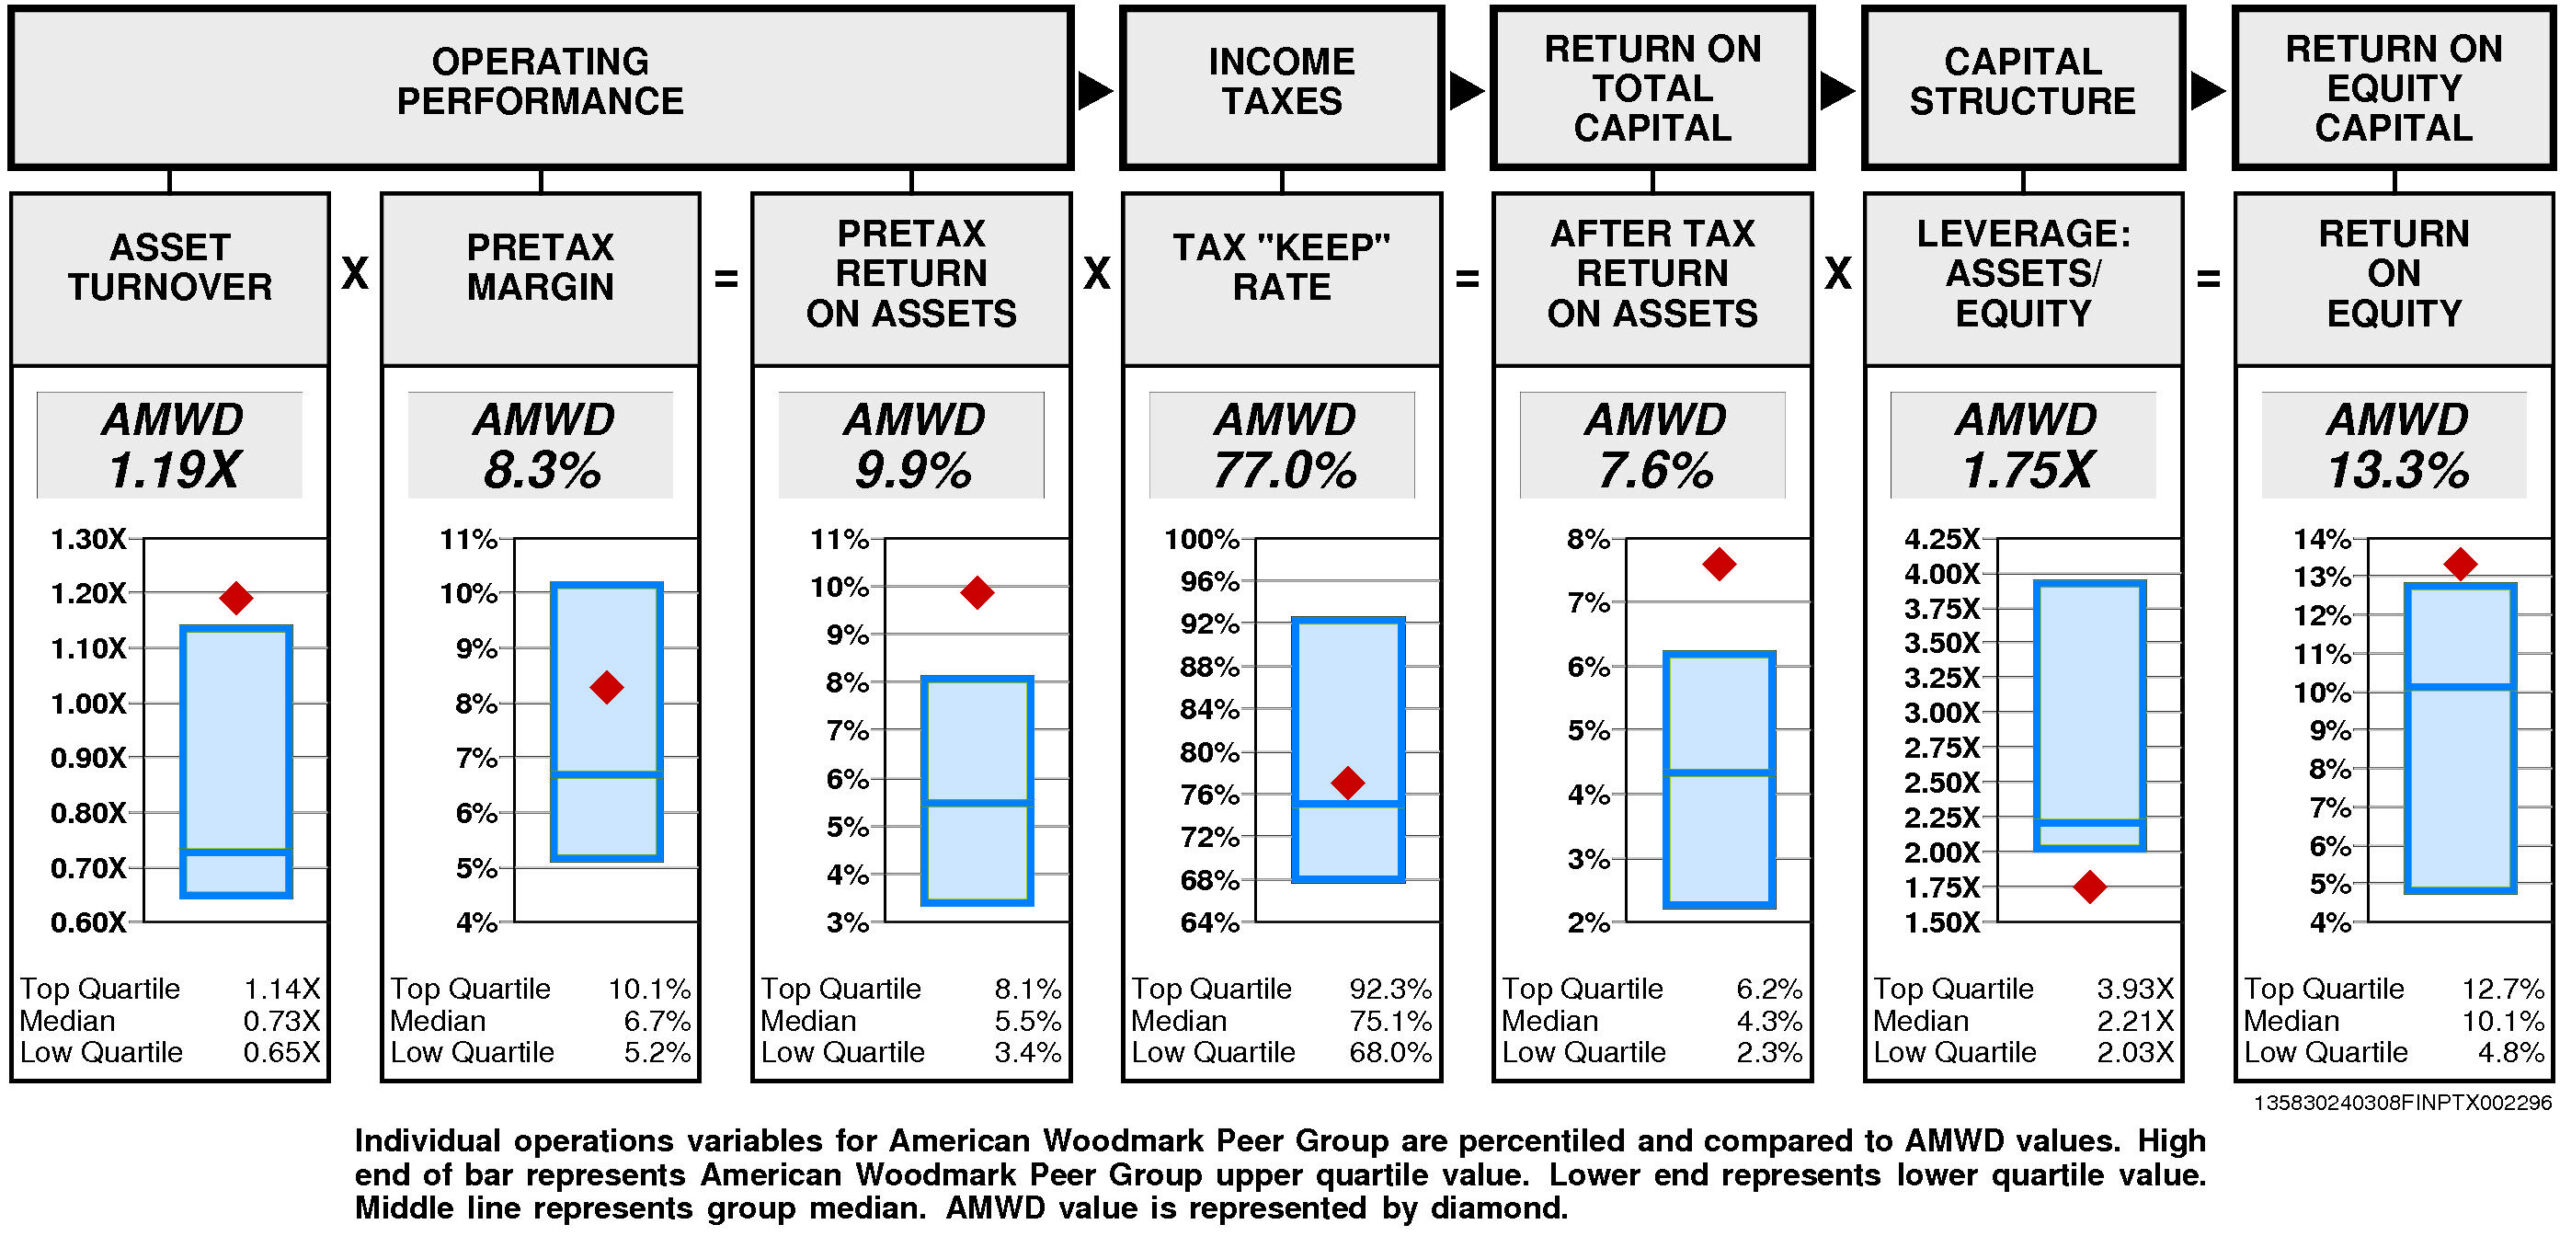
Operating performance (pretax return on assets) is upper quartile (9.9%) reflecting asset turnover that is upper quartile (1.19X) and above median pretax margin (8.3%).
Tax “keep” rate (income tax management) is slightly above median (77.0%) resulting in after tax return on assets that is upper quartile.
Financial leverage (leverage) is lower quartile (1.75X).
GROWTH RATES
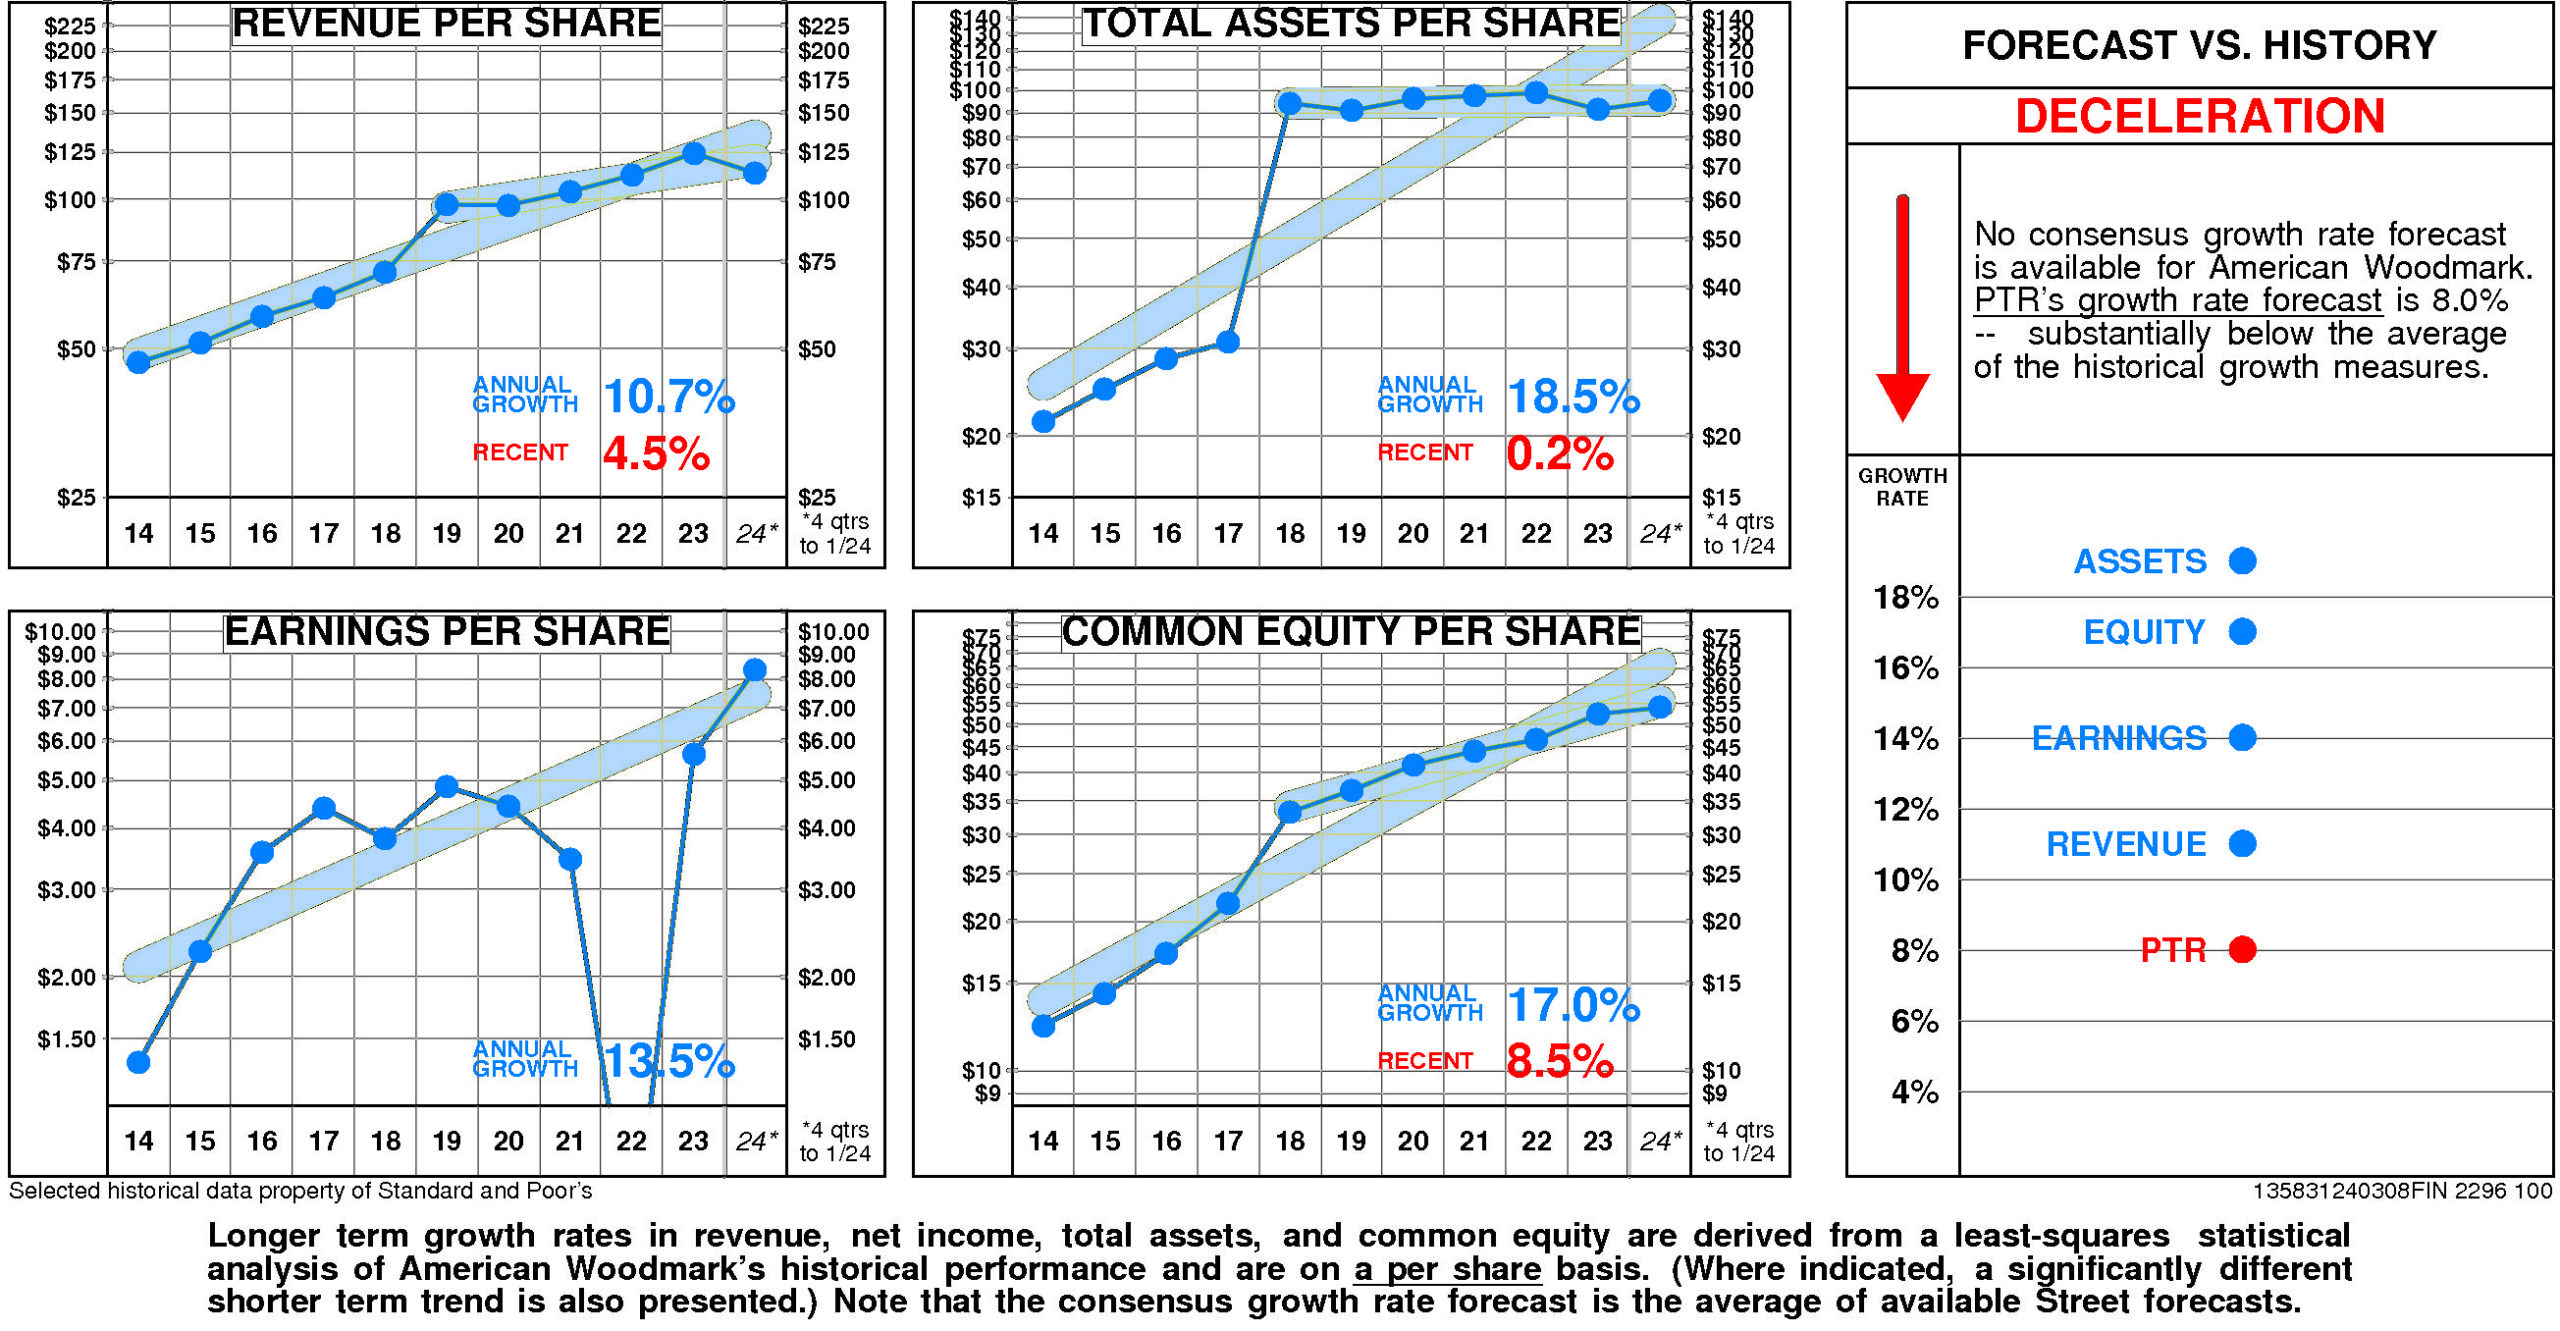
Overall, American Woodmark’s growth rate has slowed very considerably in recent years.
American Woodmark’s historical income statement growth and balance sheet growth have diverged. Revenue growth has fallen short of asset growth; earnings growth has paralleled equity growth.
Annual revenue growth has been 10.7% per year. (More recently it has been 4.5%.)
Total asset growth has been 18.5% per year. (More recently it has been 0.2%.)
Annual E.P.S. growth has been 13.5% per year.
Equity growth has been 17.0% per year. (More recently it has been 8.5%.)
No consensus growth rate forecast is available for American Woodmark.
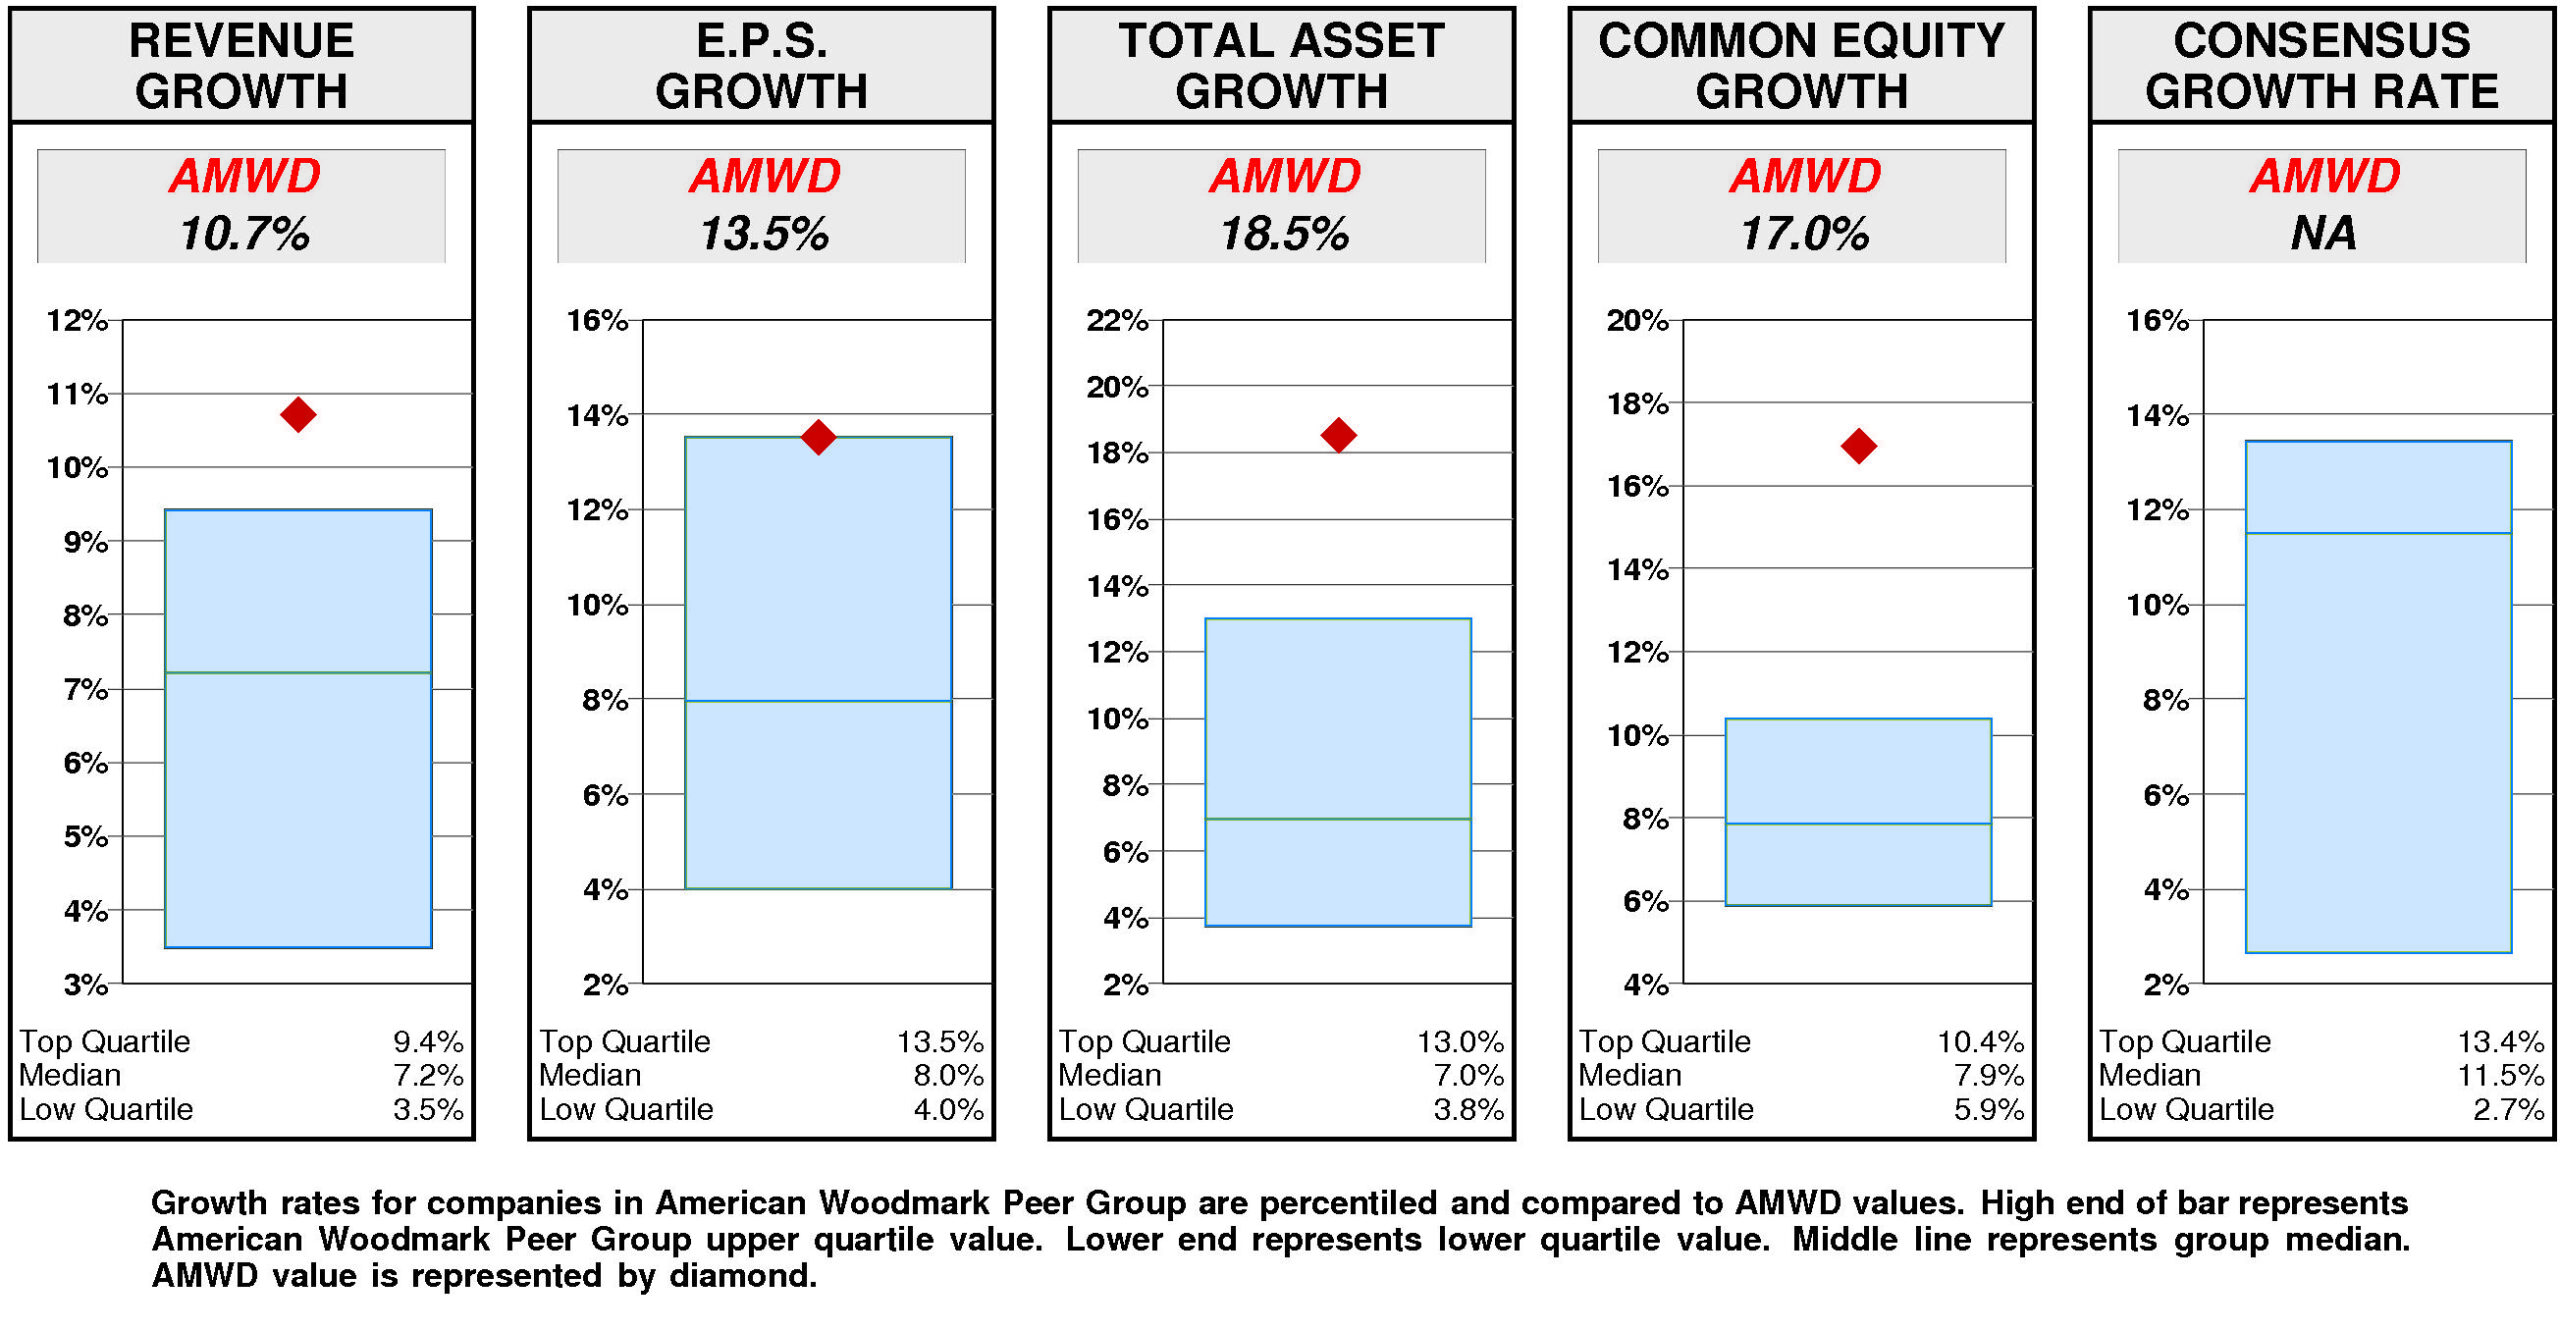
Relative to the American Woodmark Peer Group, American Woodmark’s historical growth measures are consistently top quartile. Revenue growth (10.7%) has been upper quartile. Total asset growth (18.5%) has been upper quartile. Equity growth (17.0%) has been upper quartile. E.P.S. growth (13.5%) has been at the upper quartile.
Consensus growth forecast is unavailable.
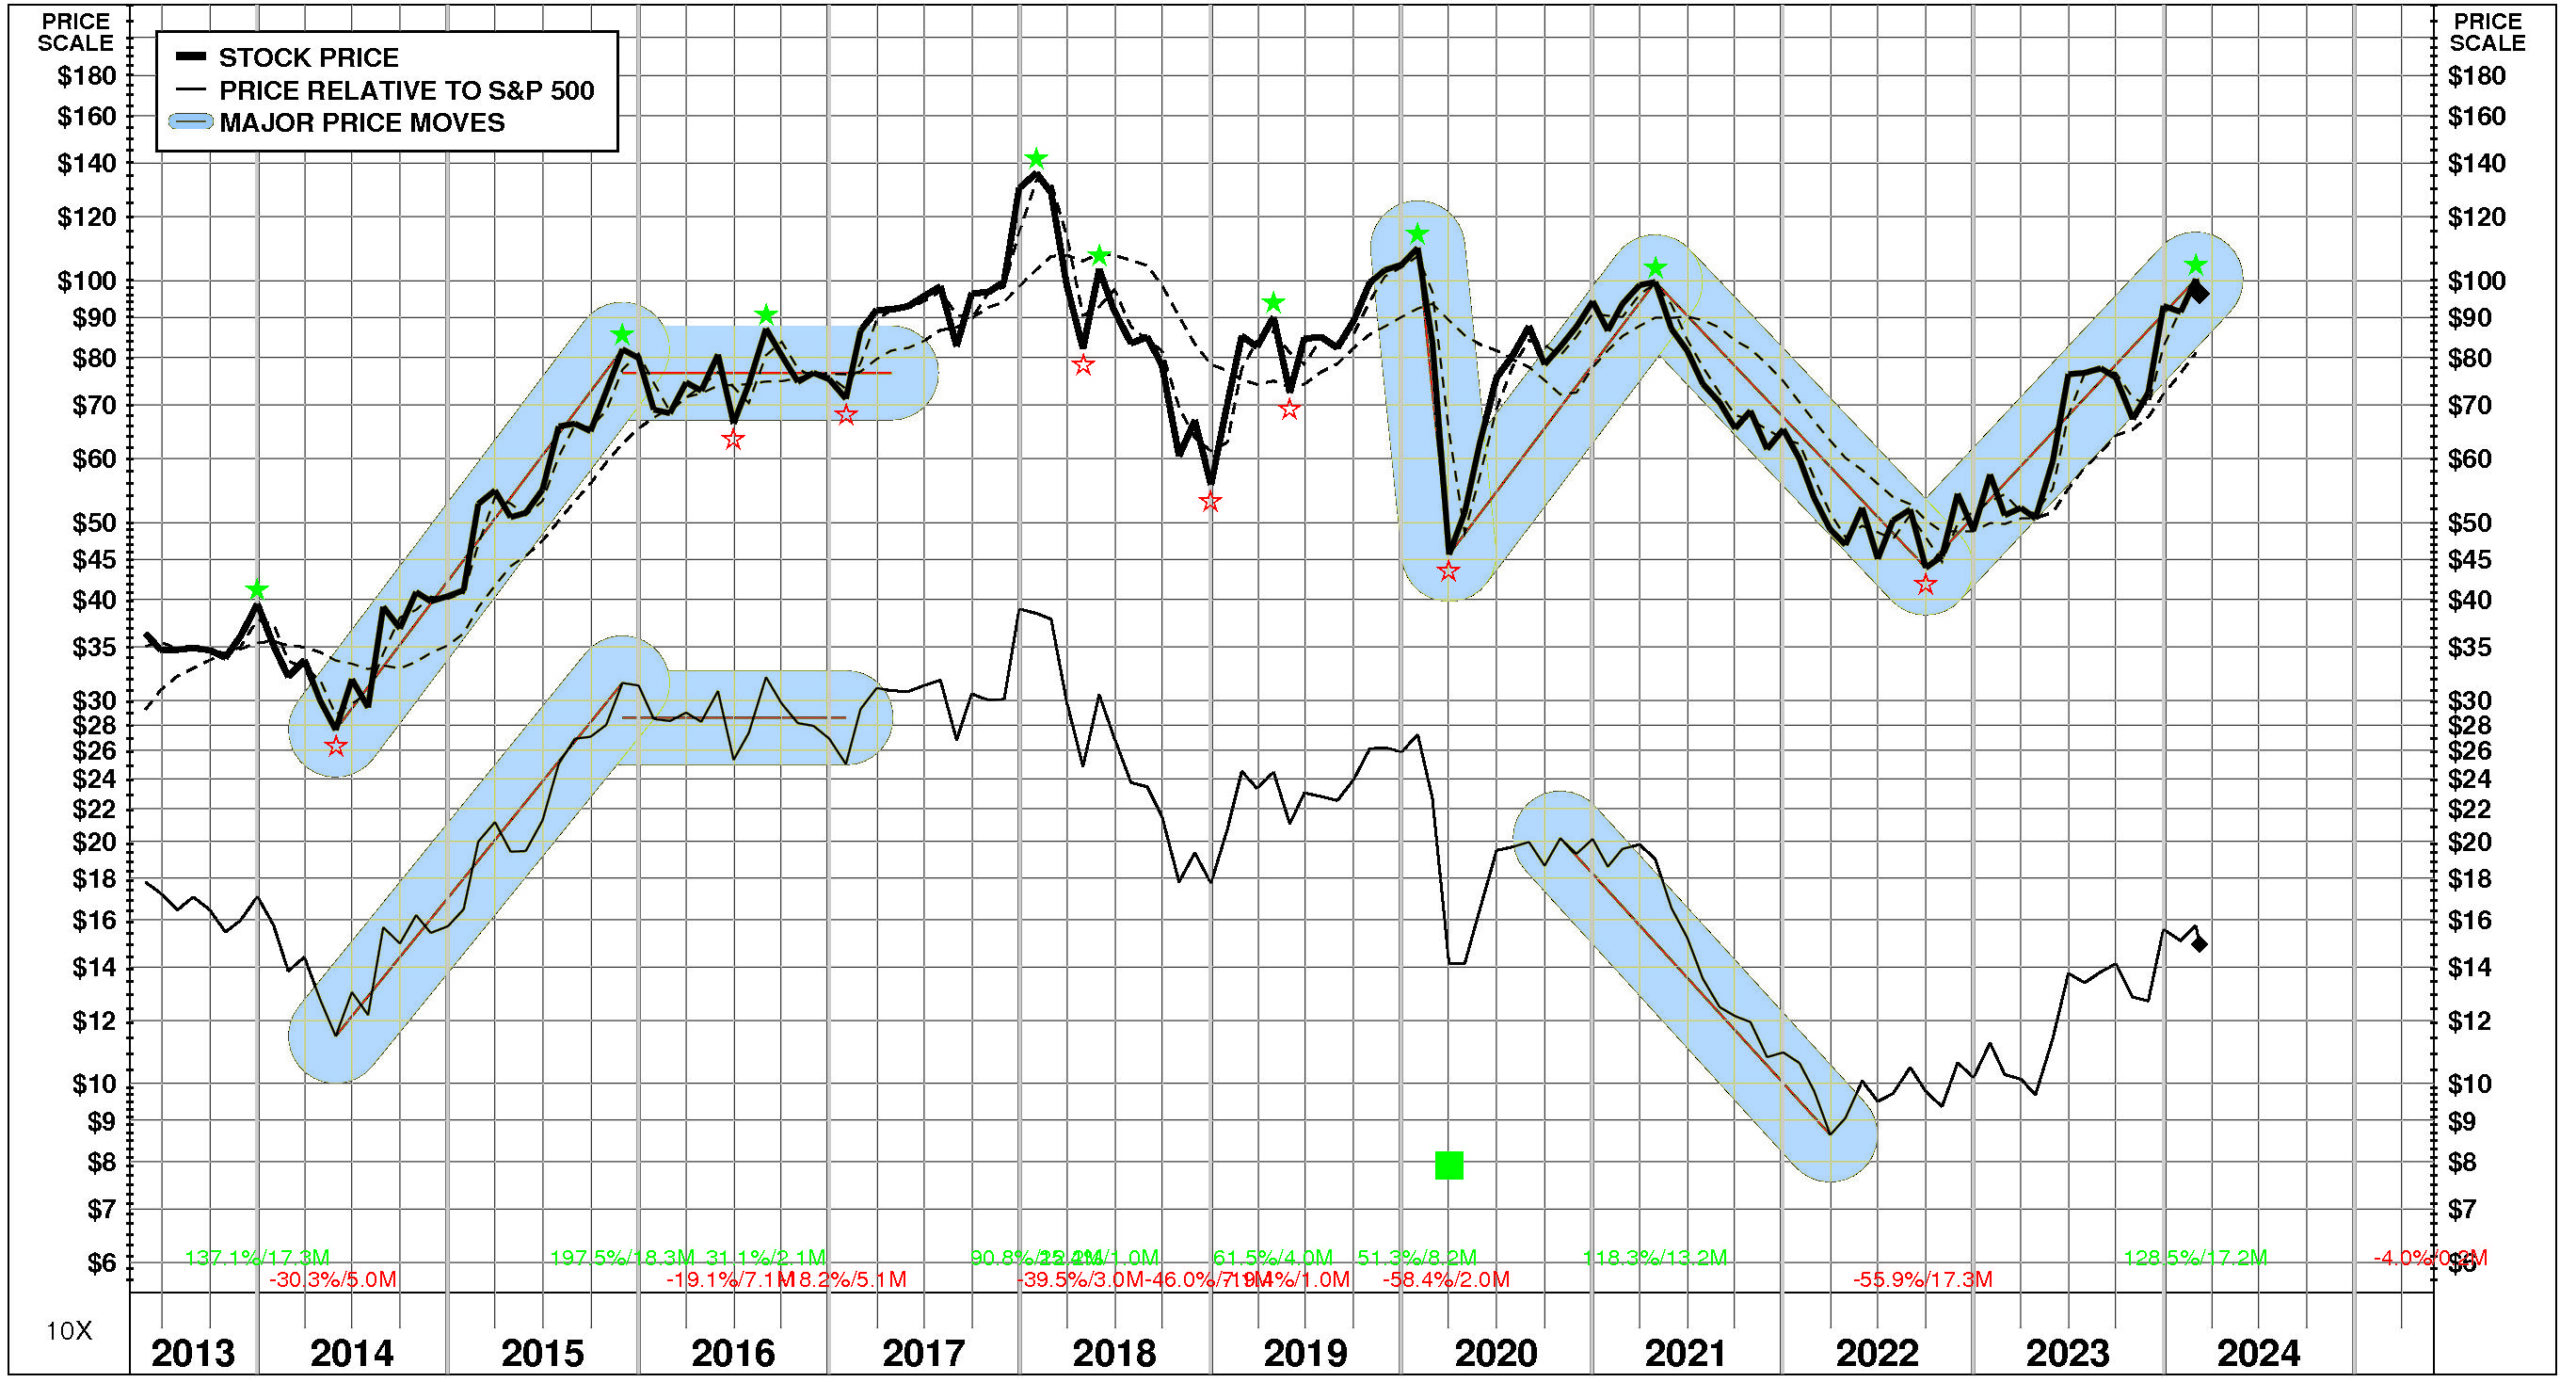
PRICE HISTORY
Over the full time period, American Woodmark’s stock price performance has been variable and slightly below market. Between May, 2013 and March, 2024, American Woodmark’s stock price rose +165%; relative to the market, this was a -16% loss. Significant price moves during the period: 1) September, 2022 – February, 2024: +129%; 2) April, 2021 – September, 2022: -56%; 3) March, 2020 – April, 2021: +118%; 4) January, 2020 – March, 2020: -58%; and 5) May, 2014 – November, 2015: +197%.
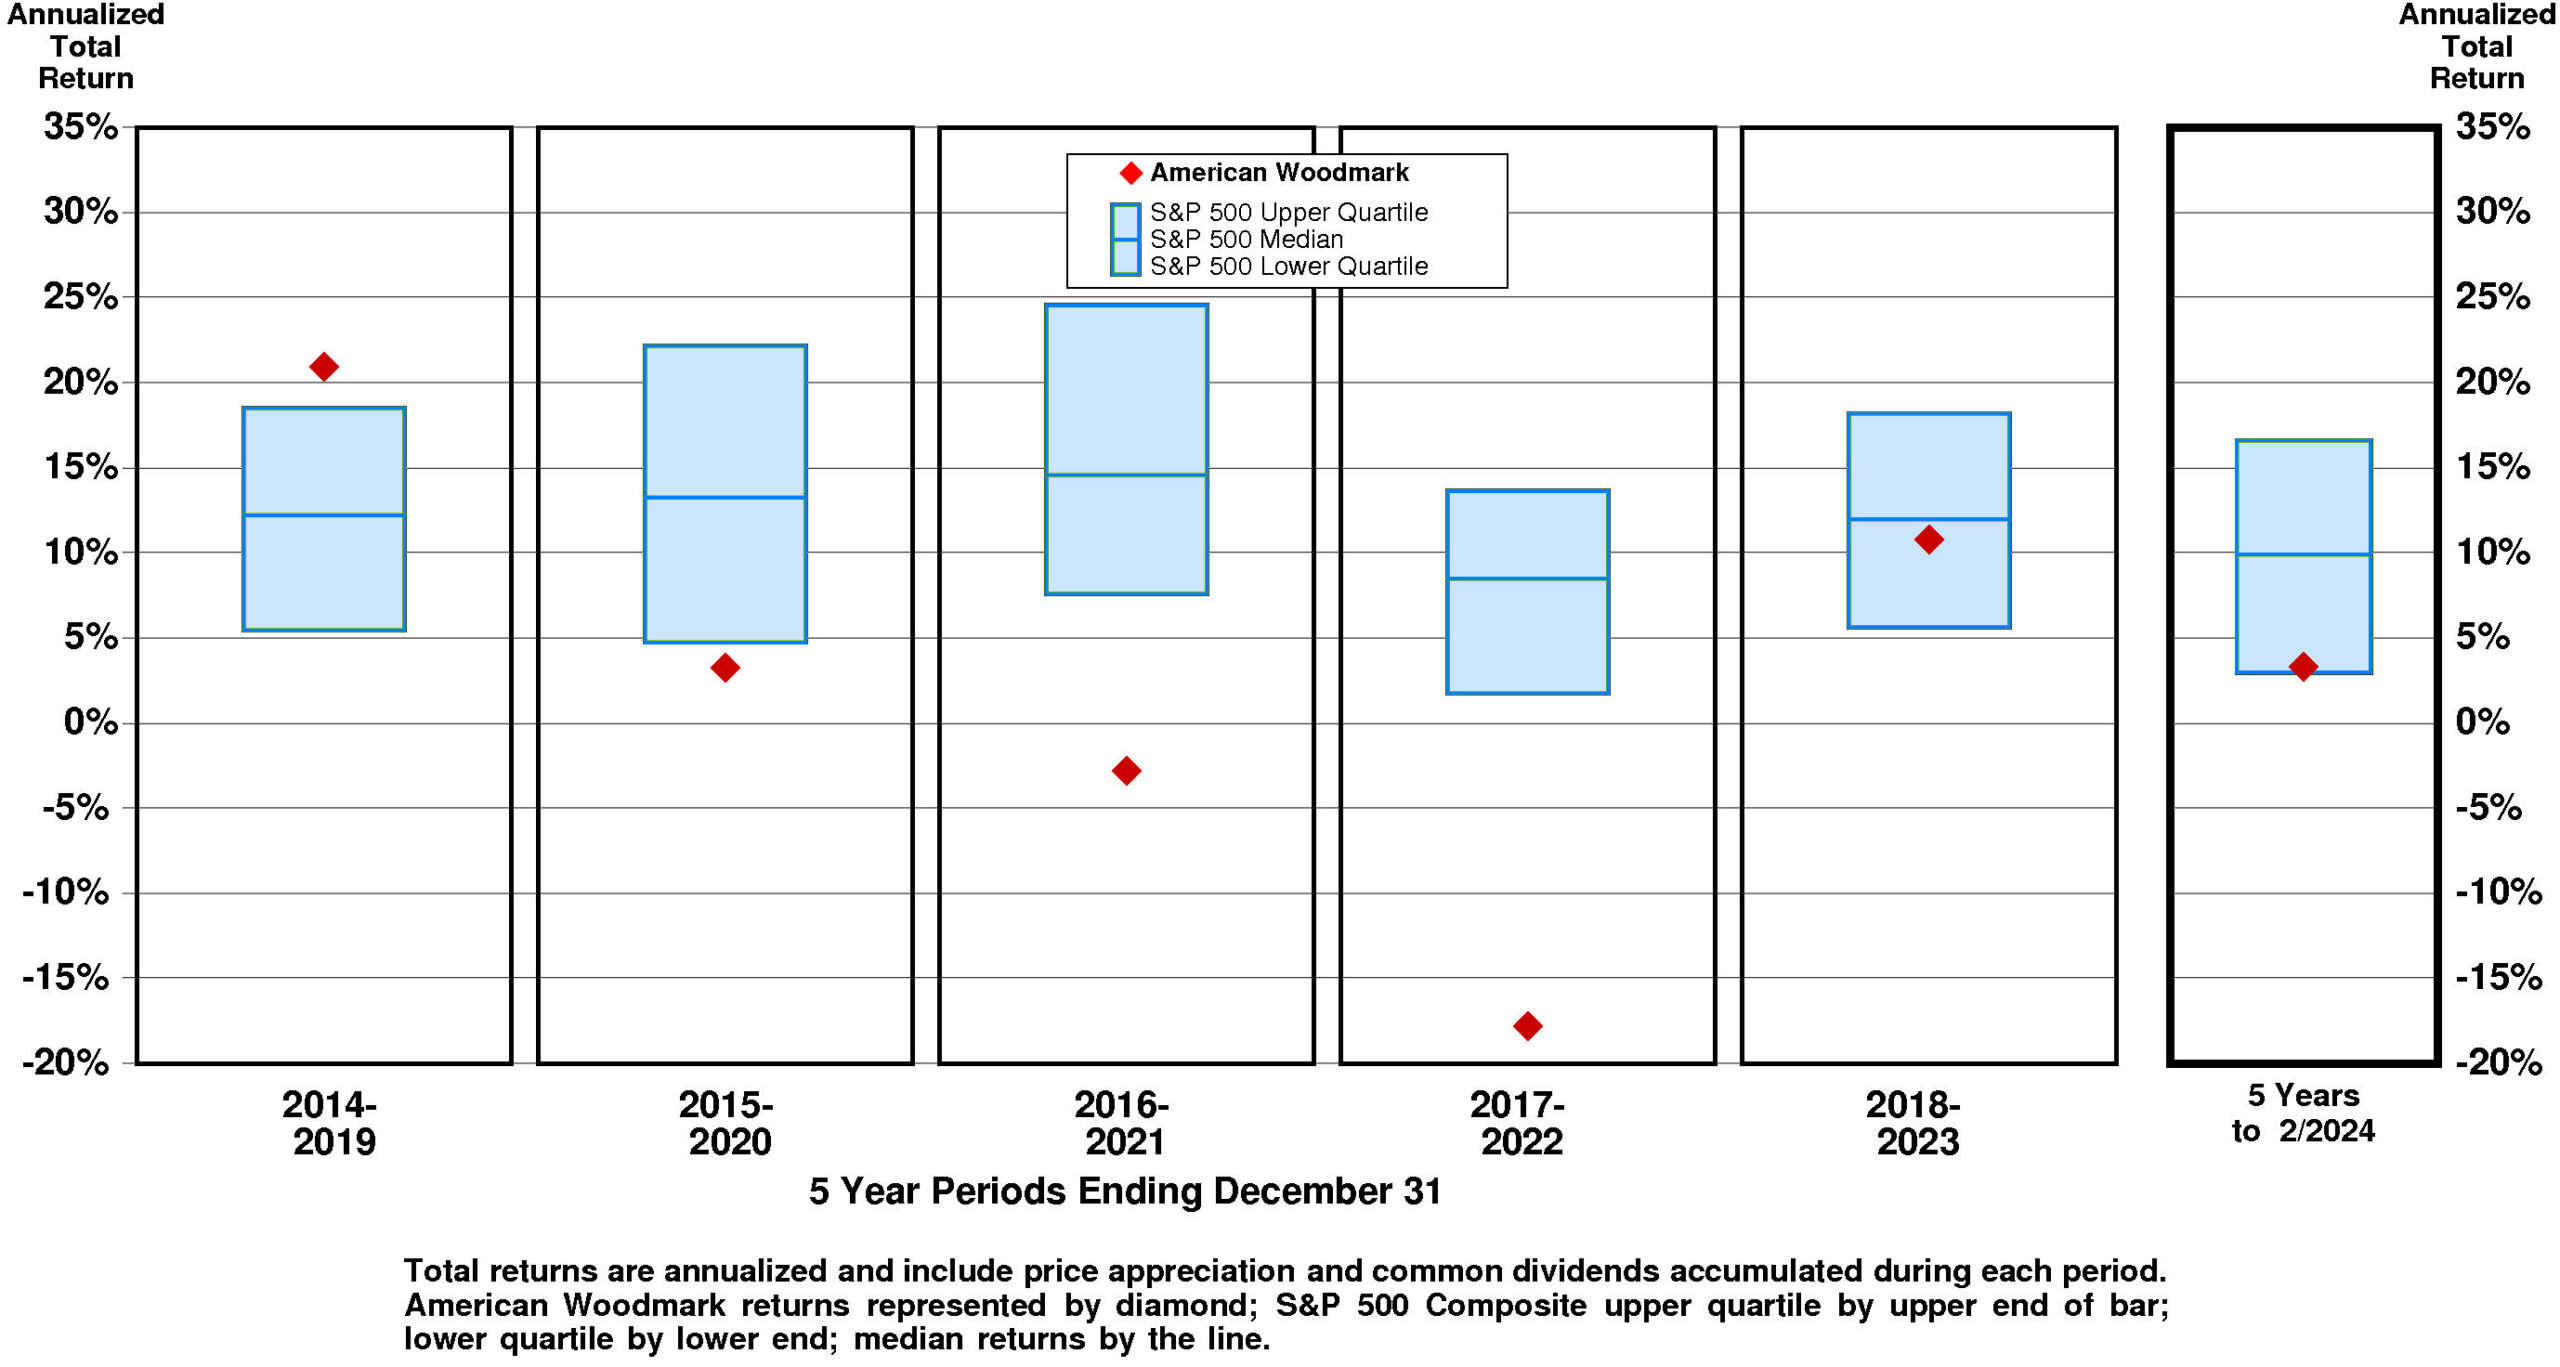
TOTAL INVESTMENT RETURNS
Current annual total return performance of 96.6% is upper quartile relative to the S&P 500 Composite.
In addition to being upper quartile relative to S&P 500 Composite, current annual total return performance through February, 2024 of 96.6% is upper quartile relative to American Woodmark Corp Peer Group.
Current 5-year total return performance of 3.3% is substantially below median relative to the S&P 500 Composite.
Through February, 2024, with substantially below median current 5-year total return of 3.3% relative to S&P 500 Composite, American Woodmark’s total return performance is slightly below median relative to American Woodmark Corp Peer Group.
VALUATION BENCHMARKS
Relative to S&P 500 Composite, AMWD’s overall valuation is quite low. Four of five factors are lower quartile. The highest factor is the ratio of enterprise value/assets, followed by the ratio of enterprise value/earnings before interest and taxes, then by the price/equity ratio, then by the price/earnings ratio. The lowest factor, ratio of enterprise value/revenue, is lower quartile.
Relative to American Woodmark Peer Group, AMWD’s overall valuation is low. The highest factor, the ratio of enterprise value/assets, is above median. Price/equity ratio is at median. Ratio of enterprise value/earnings before interest and taxes is at the lower quartile. Ratio of enterprise value/revenue is at the lower quartile. The lowest factor, the price/earnings ratio, is lower quartile.
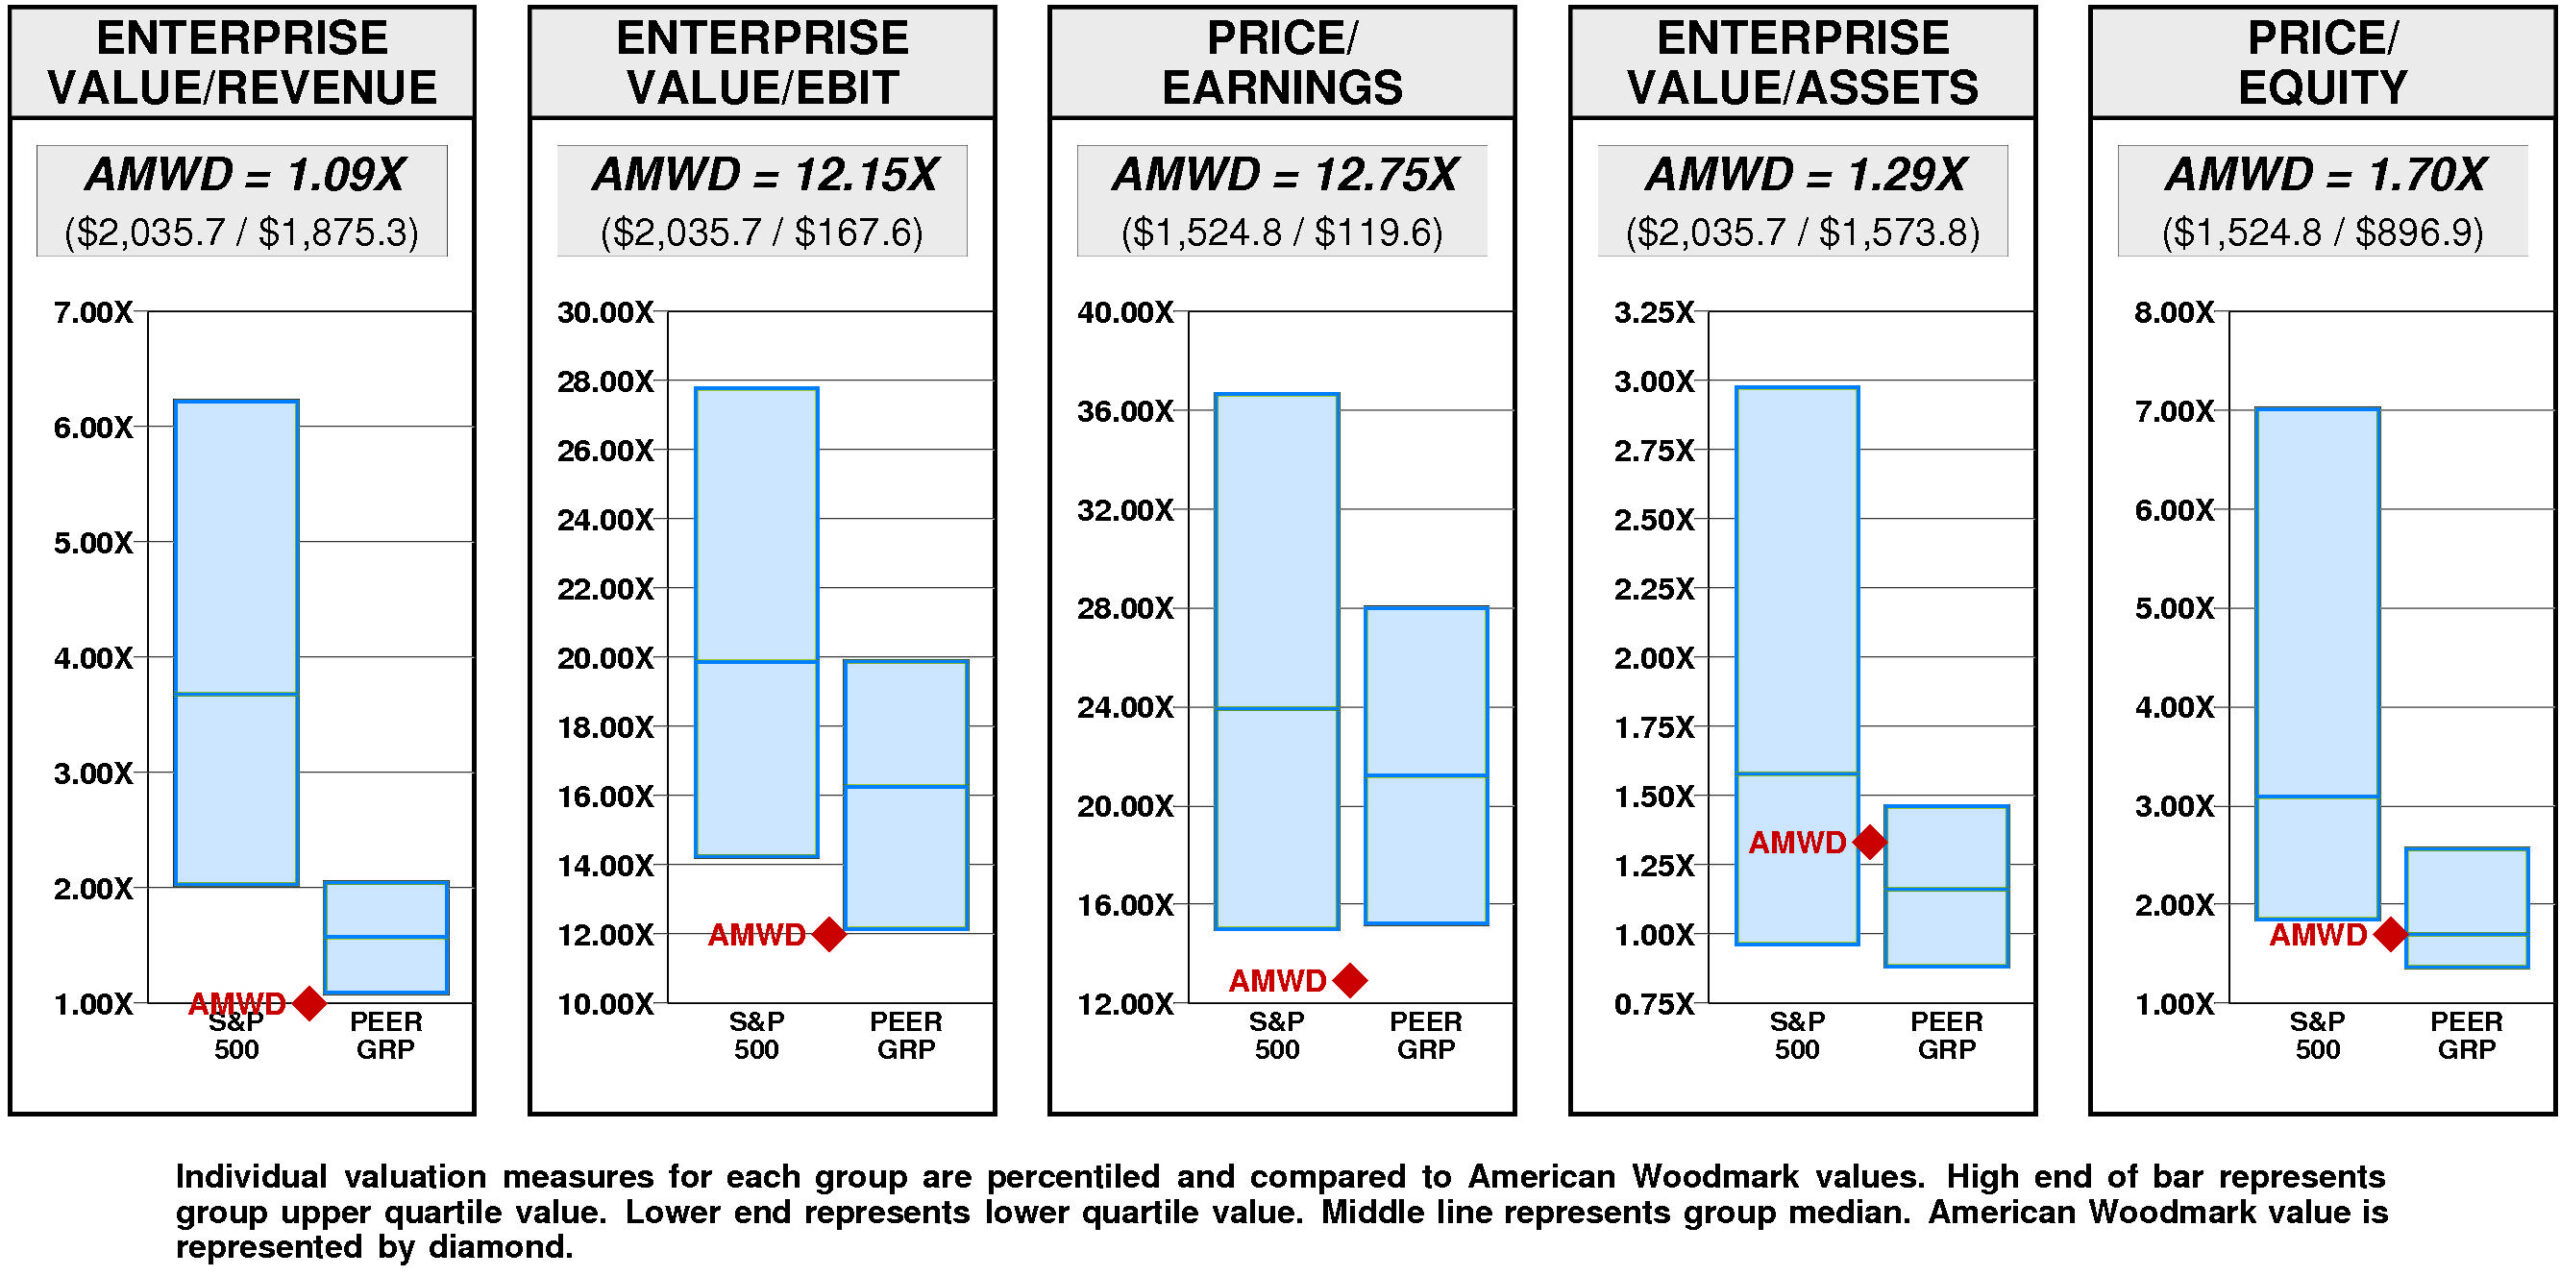
American Woodmark has a major value gap compared to the median. For AMWD to hit median valuation, its current ratio of enterprise value/revenue would have to rise from the current level of 1.09X to 1.58X. If AMWD’s ratio of enterprise value/revenue were to rise to 1.58X, its stock price would be higher by $58 to $154.
For AMWD to achieve upper quartile valuation relative to the American Woodmark Peer Group, its current ratio of enterprise value/revenue would have to rise from the current level of 1.09X to 2.05X. If AMWD’s ratio of enterprise value/revenue were to rise to 2.05X, its stock price would increase by $114 from the current level of $96.
VALUE TARGETS
Reflecting future returns on capital that are forecasted to be above the cost of capital, AMWD is expected to continue to be an important Value Builder.
American Woodmark’s current Price Target of $148 represents a +54% change from the current price of $96.23.
This neutral appreciation potential results in an appreciation score of 55 (45% of the universe has greater appreciation potential.)
With this neutral Appreciation Score of 55, the high Power Rating of 95 results in an Value Trend Rating of A.
American Woodmark’s current Price Target is $148 (+16% from the 2023 Target of $128 and +54% from the 03/07/24 price of $96.23). This slight rise in the Target is the result of a +6% increase in the equity base and a +9% increase in the price/equity multiple. The forecasted increase in cost of equity has a very large negative impact on the price/equity multiple and the forecasted decline in growth has a large negative impact as well. More than offsetting these Drivers, the forecasted increase in return on equity has a very large positive impact.
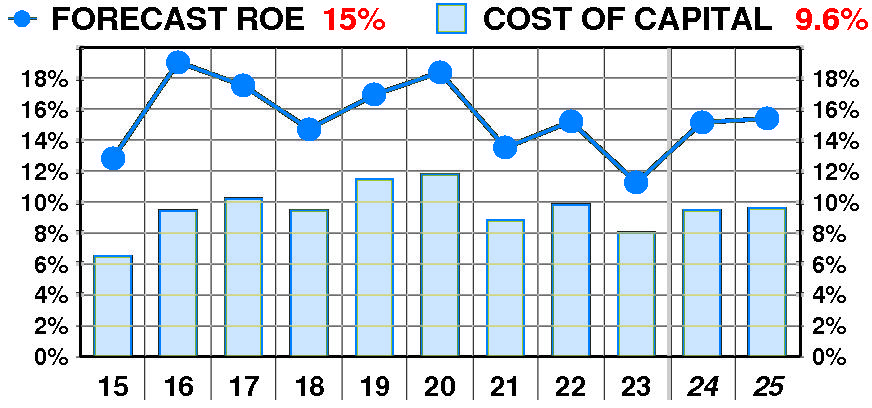
PTR’s return on equity forecast is 15.4% — slightly above our recent forecasts. Forecasted return on equity suffered a dramatic, erratic decline between 2015 and 2023. The current forecast is below the 2016 peak of 19%.
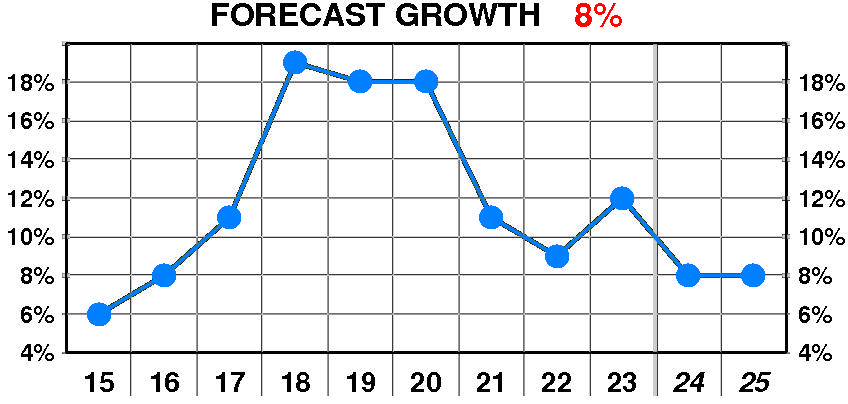
PTR’s growth forecast is 8.0% — slightly below our recent forecasts. Forecasted growth enjoyed a dramatic, erratic increase between 2015 and 2023. The current forecast is significantly below the 2018 peak of 19%.
PTR’s cost of equity forecast is 9.6% — in line with recent levels. Forecasted cost of equity exhibited a modest, erratic increase between 2015 and 2023. The current forecast is above the 2015 low of 6.5%.
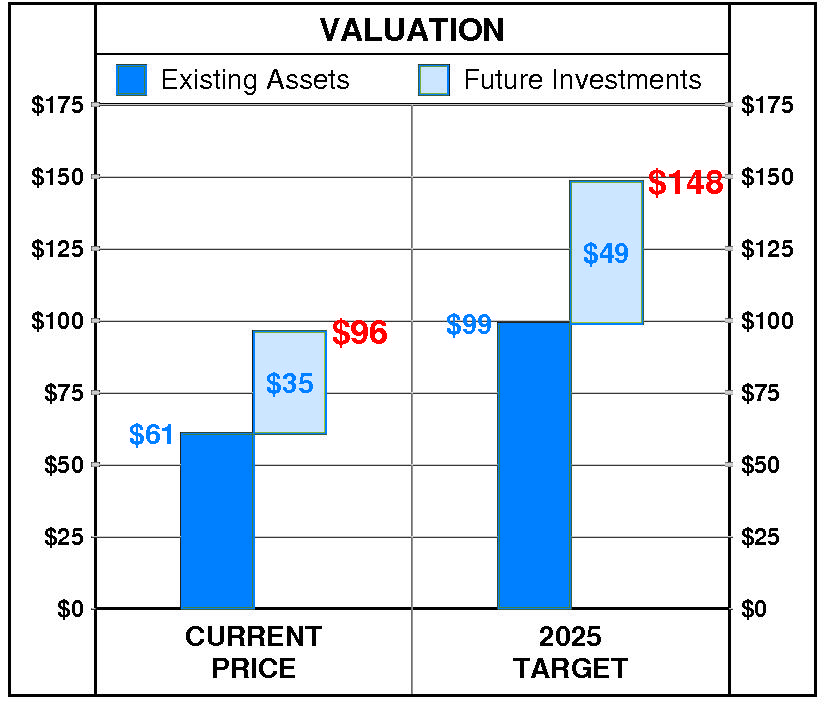
At American Woodmark’s current price of $96.23, investors are placing a positive value of $35 on its future investments. This view is consistent with the company’s most recent performance that reflected a growth rate of 12.0% per year, and a return on equity of 11.2% versus a cost of equity of 8.0%.
PTR’s 2025 Price Target of $148 is based on these forecasts and reflects an estimated value of existing assets of $99 and a value of future investments of $49.
Be the first to comment