BUSINESS
Honeywell International Inc. operates as a diversified technology and manufacturing company worldwide. Its Aerospace segment offers auxiliary power units, propulsion engines, integrated avionics, environmental control and electric power systems, engine controls, flight safety, communications, navigation hardware, data and software applications, radar and surveillance systems, aircraft lighting, advanced systems and instruments, satellite and space components, and aircraft wheels and brakes; spare parts; repair, overhaul, and maintenance services; thermal systems, as well as wireless connectivity and management services.
INVESTMENT RATING
HON's future returns on capital are forecasted to exceed the cost of capital. Accordingly, the company is expected to continue to be a major Value Builder.
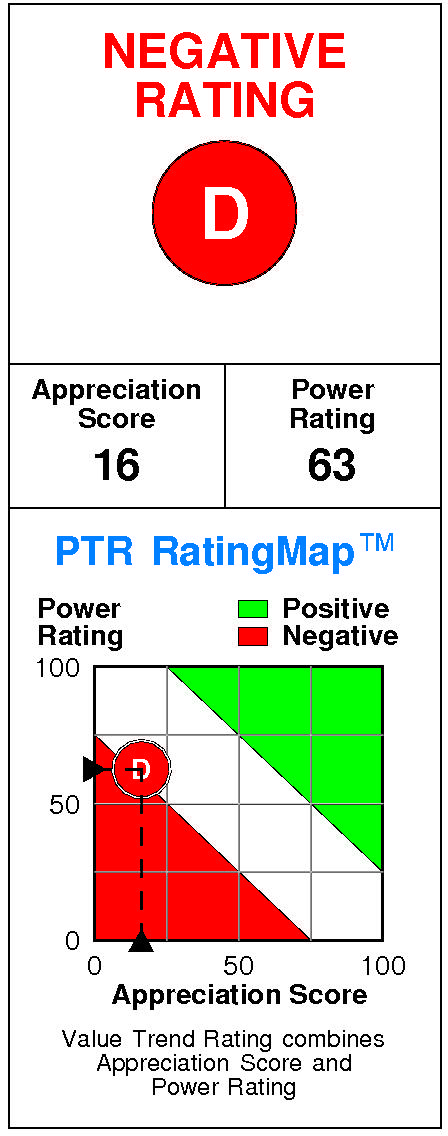
Honeywell International has a current Value Trend Rating of D (Negative).
This rating combines contradictory signals from two proprietary PTR measures of a stock's attractiveness. Honeywell International has a poor Appreciation Score of 16 but a slightly positive Power Rating of 63, leading to the Negative Value Trend Rating.
Honeywell International's stock is selling significantly above targeted value.
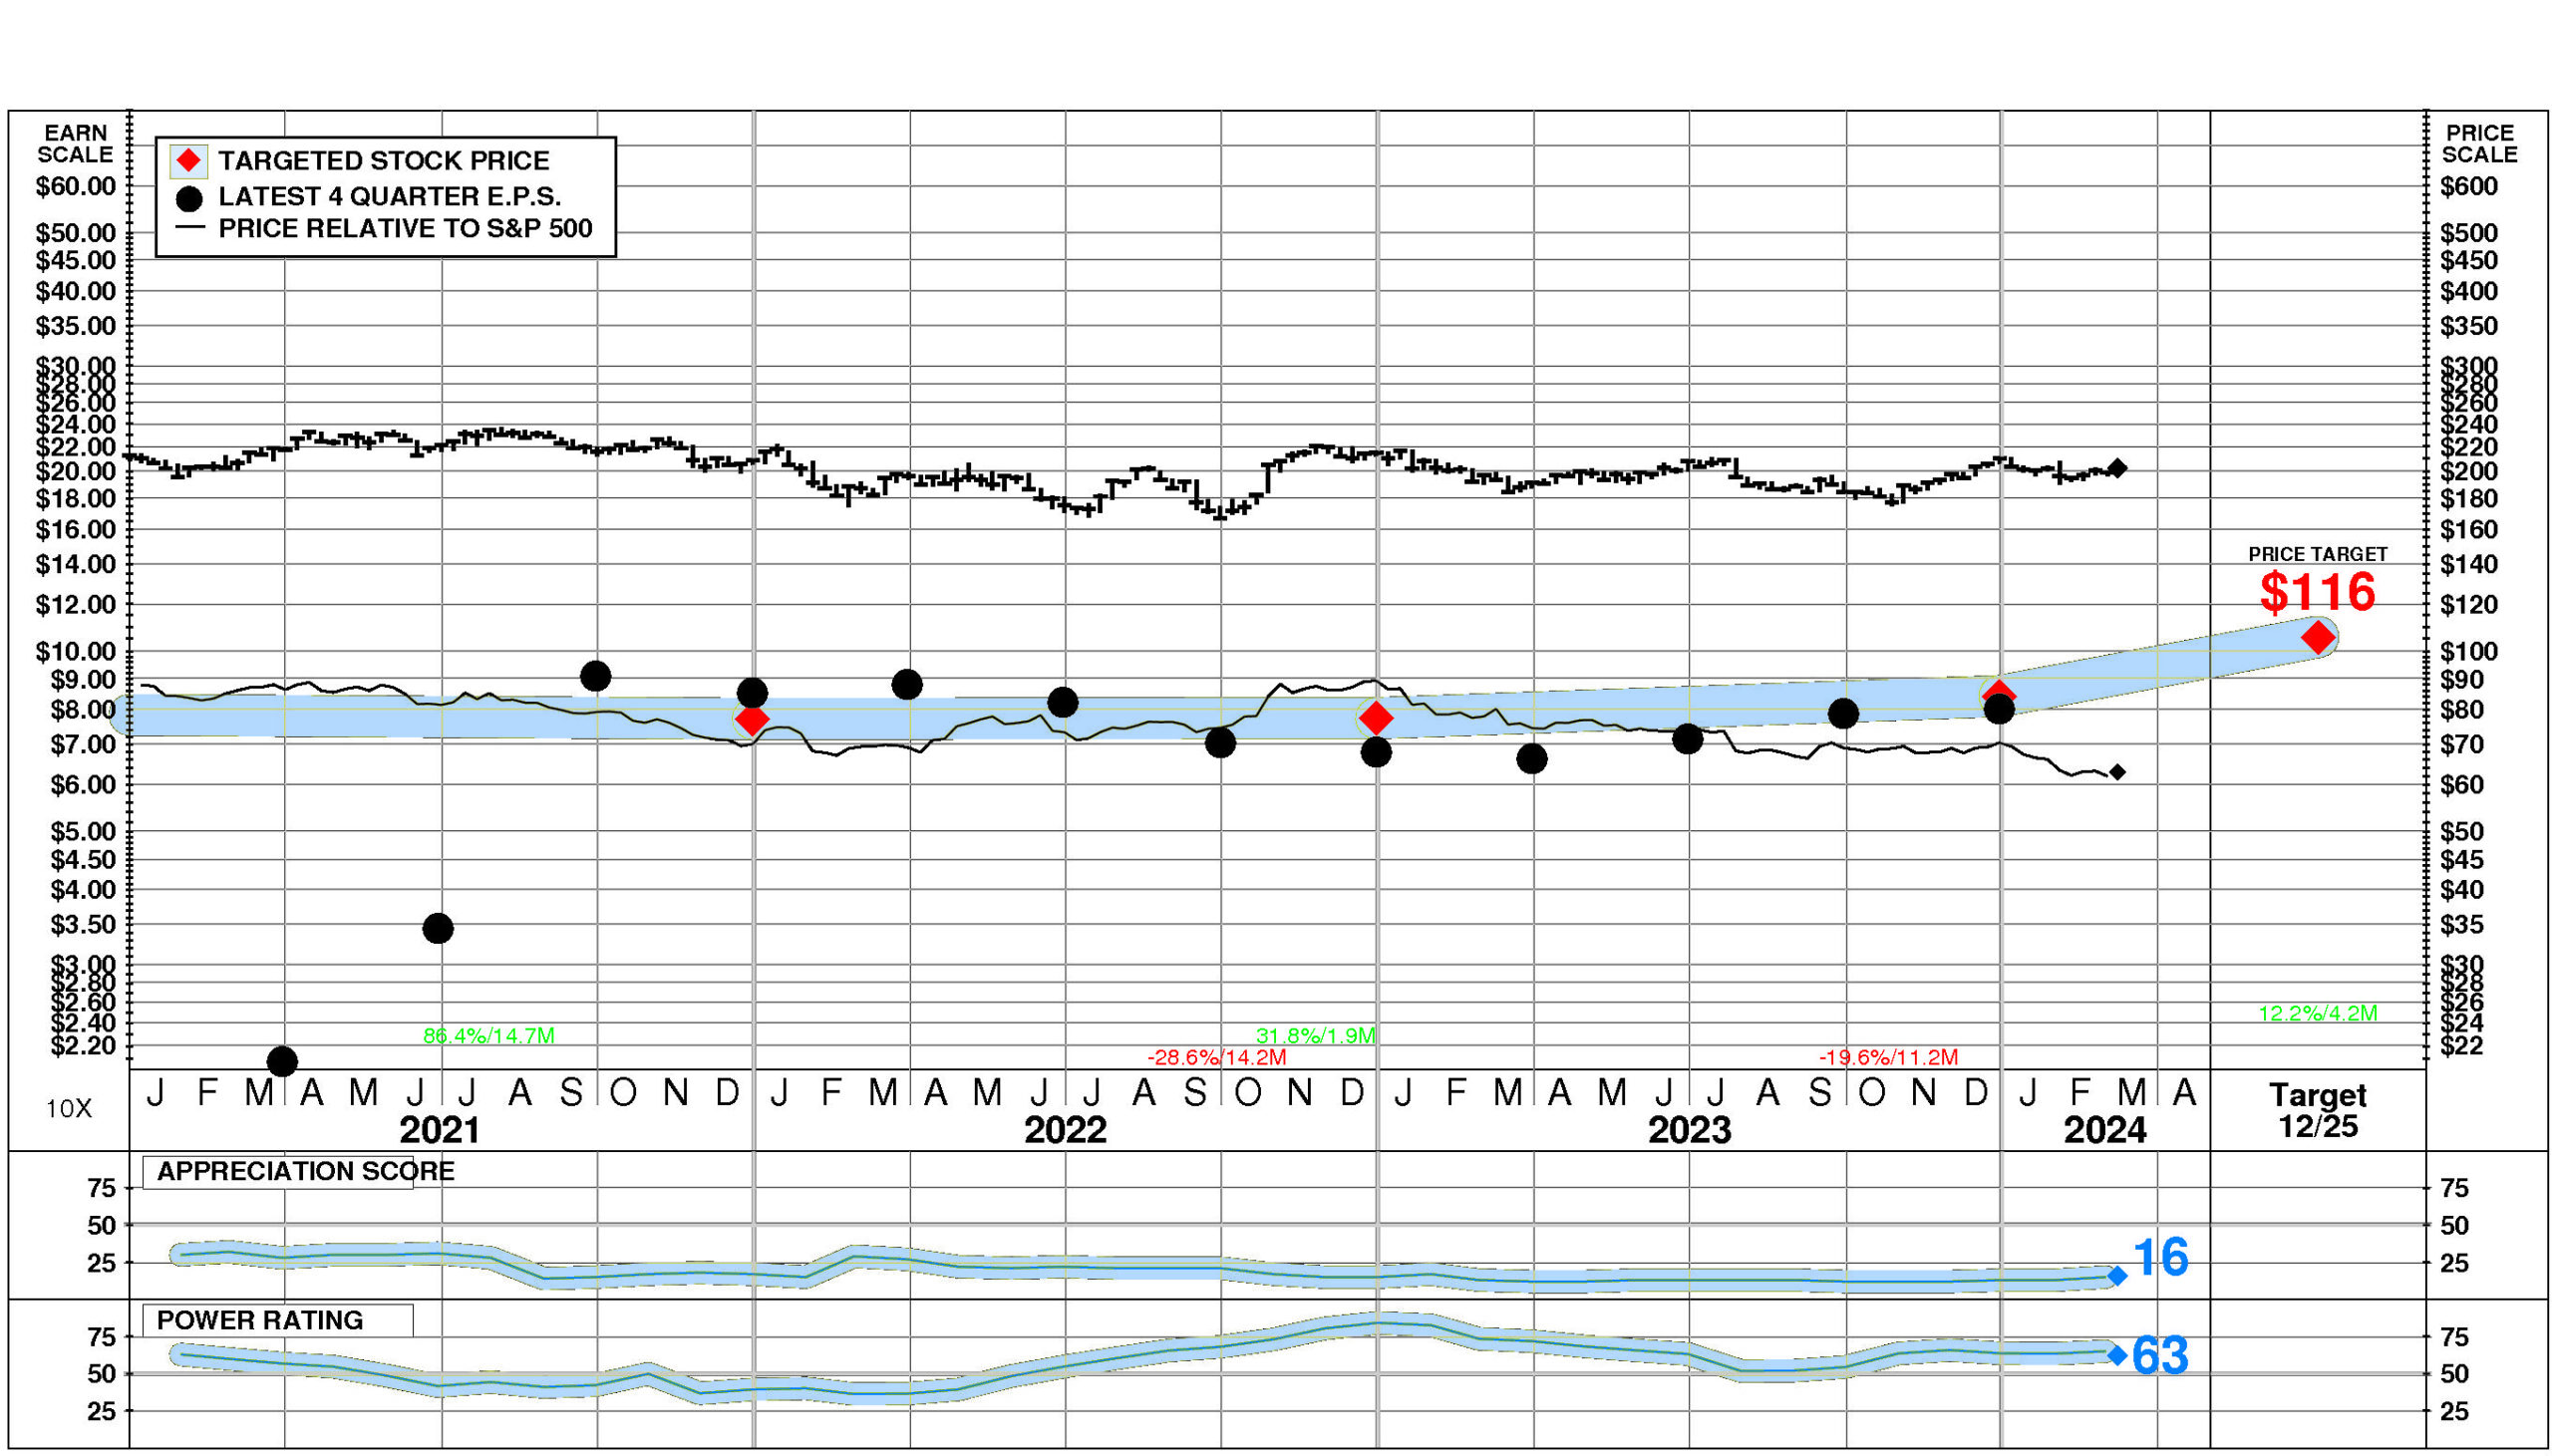
The current stock price of $202.61 compares to targeted value 12 months forward of $106.
Honeywell International's low appreciation potential results in an appreciation score of 16 (84% of the universe has greater appreciation potential.)
Honeywell International has a Power Rating of 63.
(This slightly positive Power Rating indicates that HON's chances of achieving attractive investment performance over the near to intermediate term are only average.)
Factors contributing to this slightly positive Power Rating include: the Conglomerates comparison group is in a strong phase currently; earnings estimate behavior for HON has been slightly favorable recently; and recent price action has been neutral.
INVESTMENT PROFILE
HON's financial strength is high. Financial strength rating is 88.
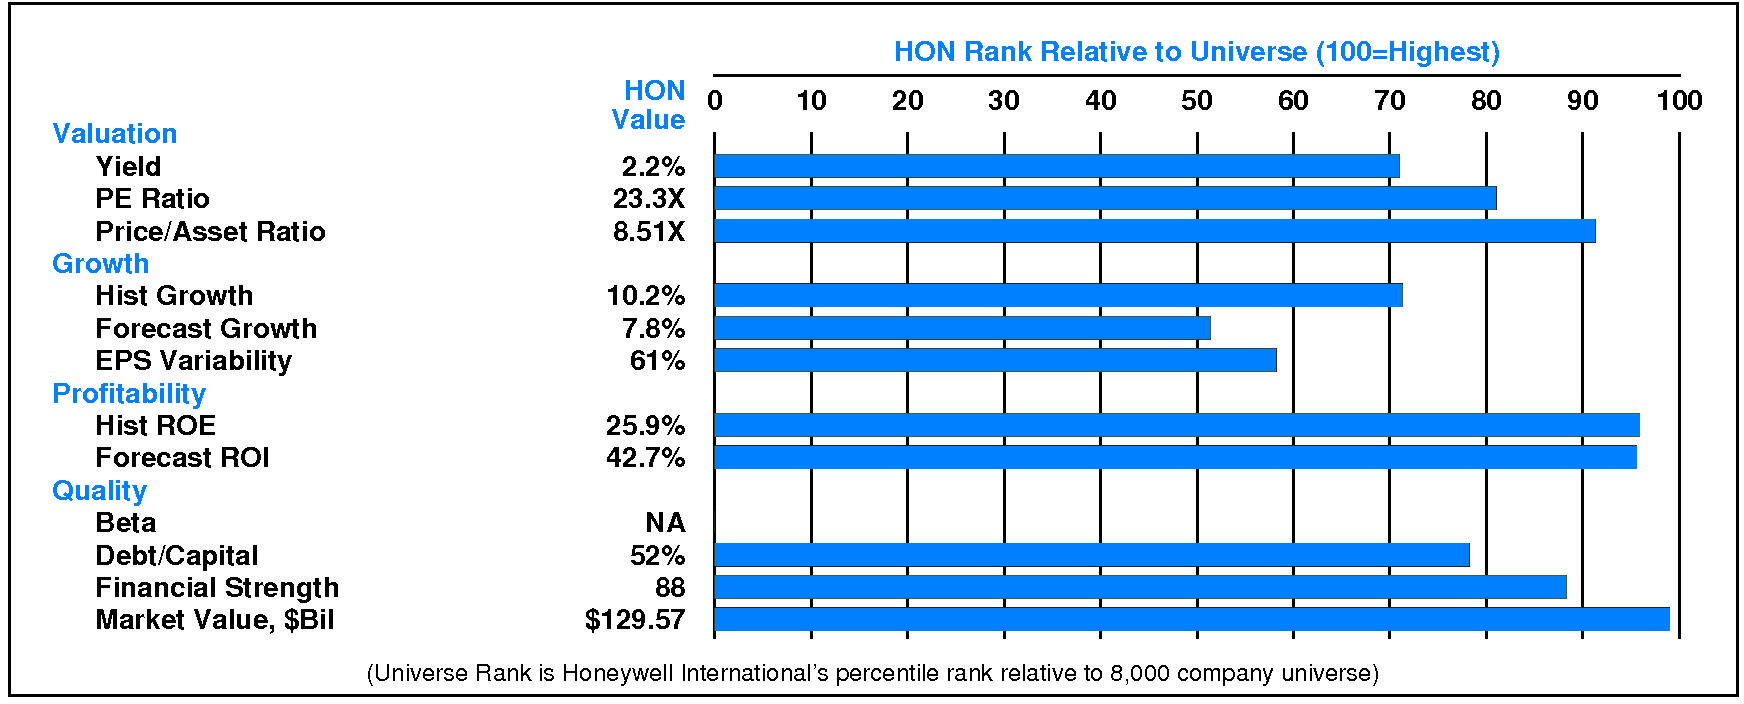
Relative to the S&P 500 Composite, Honeywell International Inc has moderate Growth characteristics; its appeal is likely to be to Capital Gain-oriented investors; the perception is that HON is normal risk.
All factors are relative strengths. HON's valuation is moderate: moderate dividend yield, moderate P/E ratio, and high price/book ratio. HON has unusually high market capitalization.
CURRENT SIGNALS
Honeywell International's current operations are strong.
Return on equity is rising, reflecting: improving asset utilization; and rising tax keep rate.
Honeywell International's current technical position is mixed.
The stock price is in a 11.2 month down move. The stock has declined 16.4% from its prior high. The 200 day moving average is in an uptrend. The stock price is below its 200 day moving average.
ALERTS
Honeywell International Inc (NASDAQ: HON). Slight positive changes in fundamentals have recently occurred: significant quarterly earnings acceleration occurred.
The stock is currently rated D.
Honeywell International Inc (NASDAQ: HON) stock increased 1.1% on 3/7/24. The shares closed at $202.61. However, trading volume in this advance was below average at 77% of normal. The stock has performed in line with the market over the last nine months and has risen 2.6% during the last week.
CASH FLOW
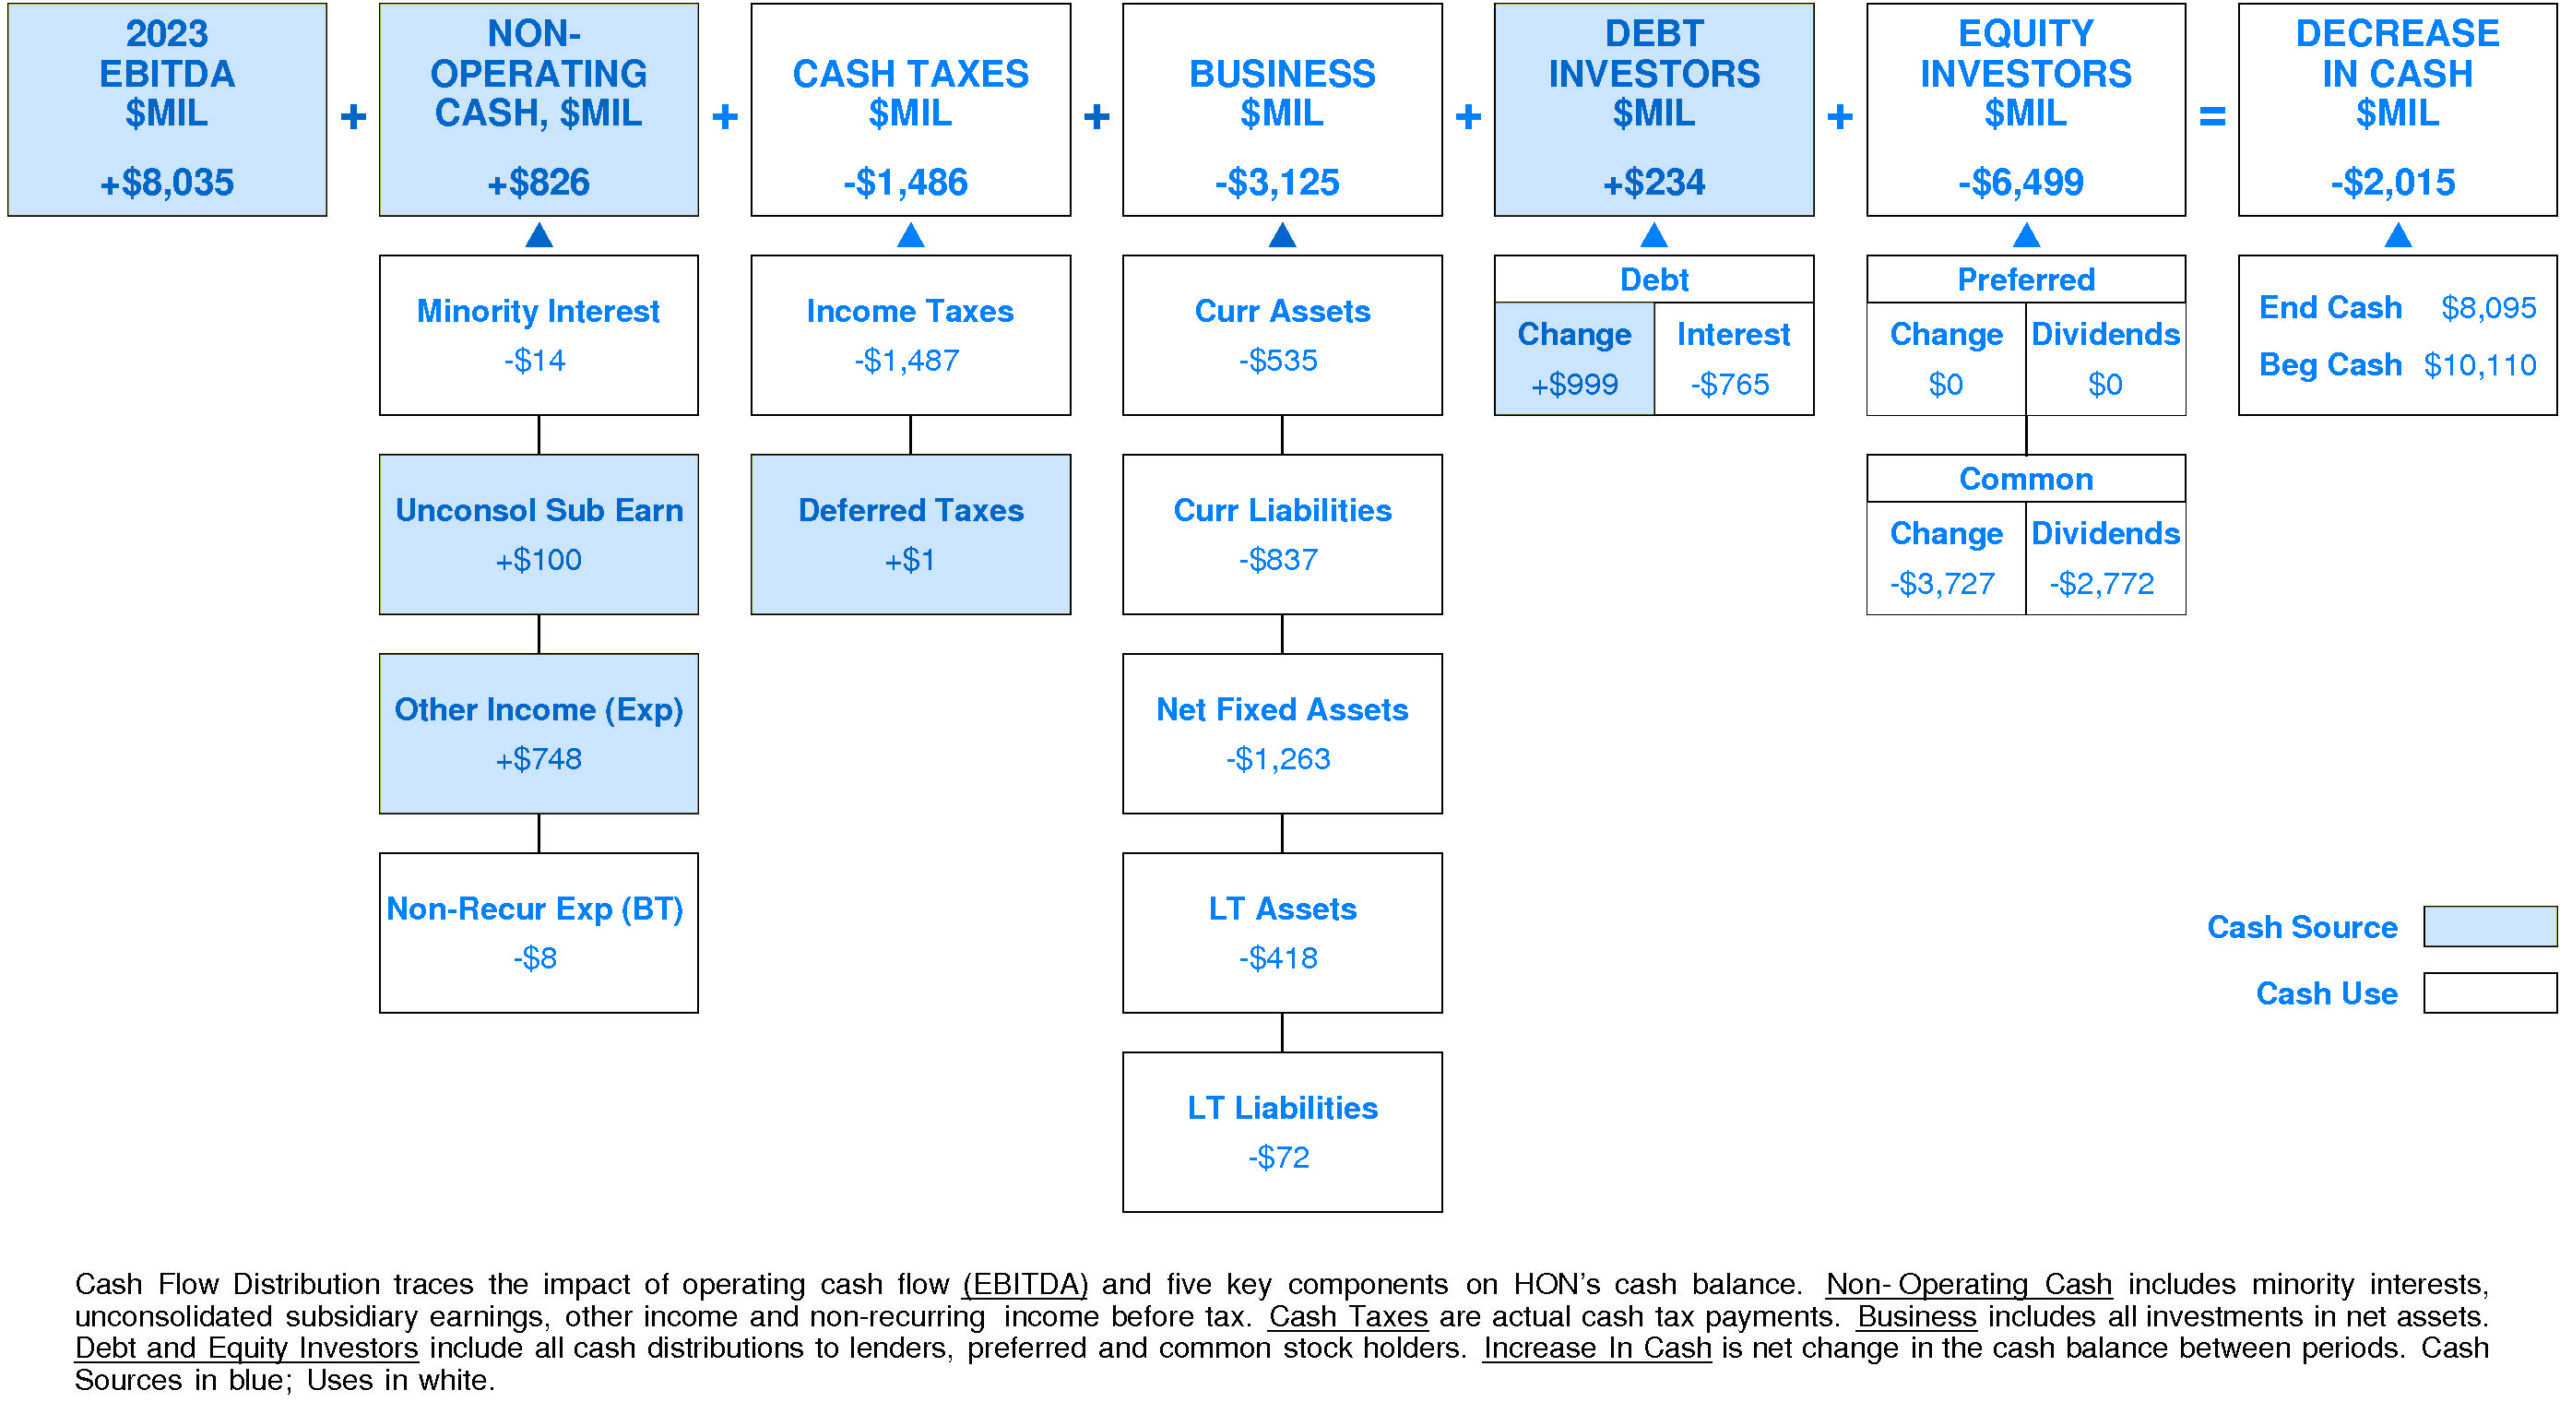
In 2023, Honeywell International experienced a significant decline in cash of -$2,015 million (-20%). Sources of cash were lower than uses.
Cash generated from 2023 EBITDA totaled +$8,035 million. Non-operating sources contributed +$826 million (+10% of EBITDA). Cash taxes consumed -$1,486 million (-18% of EBITDA). Re-investment in the business amounted to -$3,125 million (-39% of EBITDA). On a net basis, debt investors contributed +$234 million (+3% of EBITDA) while equity investors removed -$6,499 million (-81% of EBITDA).
HON's Non-operating Income, %EBITDA has exhibited a minor overall uptrend over the period.
This improvement was accompanied by stability for the Honeywell International Peer Group. In most years, Honeywell International was in the third quartile and top quartile. Currently, Honeywell International is upper quartile at +10% of EBITDA (+$826 million).
HON's Cash Taxes, %EBITDA has exhibited a volatile overall uptrend over the period.
This improvement was accompanied by a similar trend for the Honeywell International Peer Group. In most years, Honeywell International was in the third quartile and top quartile. Currently, Honeywell International is substantially below median at -18% of EBITDA (-$1,486 million).
HON's Business Re-investment, %EBITDA has exhibited little to no overall change over the period.
This stability was accompanied by a downtrend for the Honeywell International Peer Group. In most years, Honeywell International was in the top quartile and second quartile. Currently, Honeywell International is substantially below median at -39% of EBITDA (-$3,125 million).
HON's Debt Investors, %EBITDA has experienced a volatile overall downtrend over the period.
This downtrend was accompanied by a similar trend for the Honeywell International Peer Group. (Since 2021 Debt Investors, %EBITDA has experienced a very sharp recovery.) In most years, Honeywell International was in the top quartile and third quartile. Currently, Honeywell International is at median at +3% of EBITDA (+$234 million).
HON's Equity Investors, %EBITDA has suffered a strong overall downtrend over the period.
This downtrend was accompanied by an opposite trend for the Honeywell International Peer Group. (Since 2021 Equity Investors, %EBITDA has accelerated sharply.) In most years, Honeywell International was in the lower quartile and top quartile. Currently, Honeywell International is lower quartile at -81% of EBITDA (-$6,499 million).
HON's Change in Cash, %EBITDA has experienced a volatile overall downtrend over the period.
This downtrend was accompanied by stability for the Honeywell International Peer Group. In most years, Honeywell International was in the second quartile and top quartile. Currently, Honeywell International is lower quartile at -25% of EBITDA (-$2,015 million).
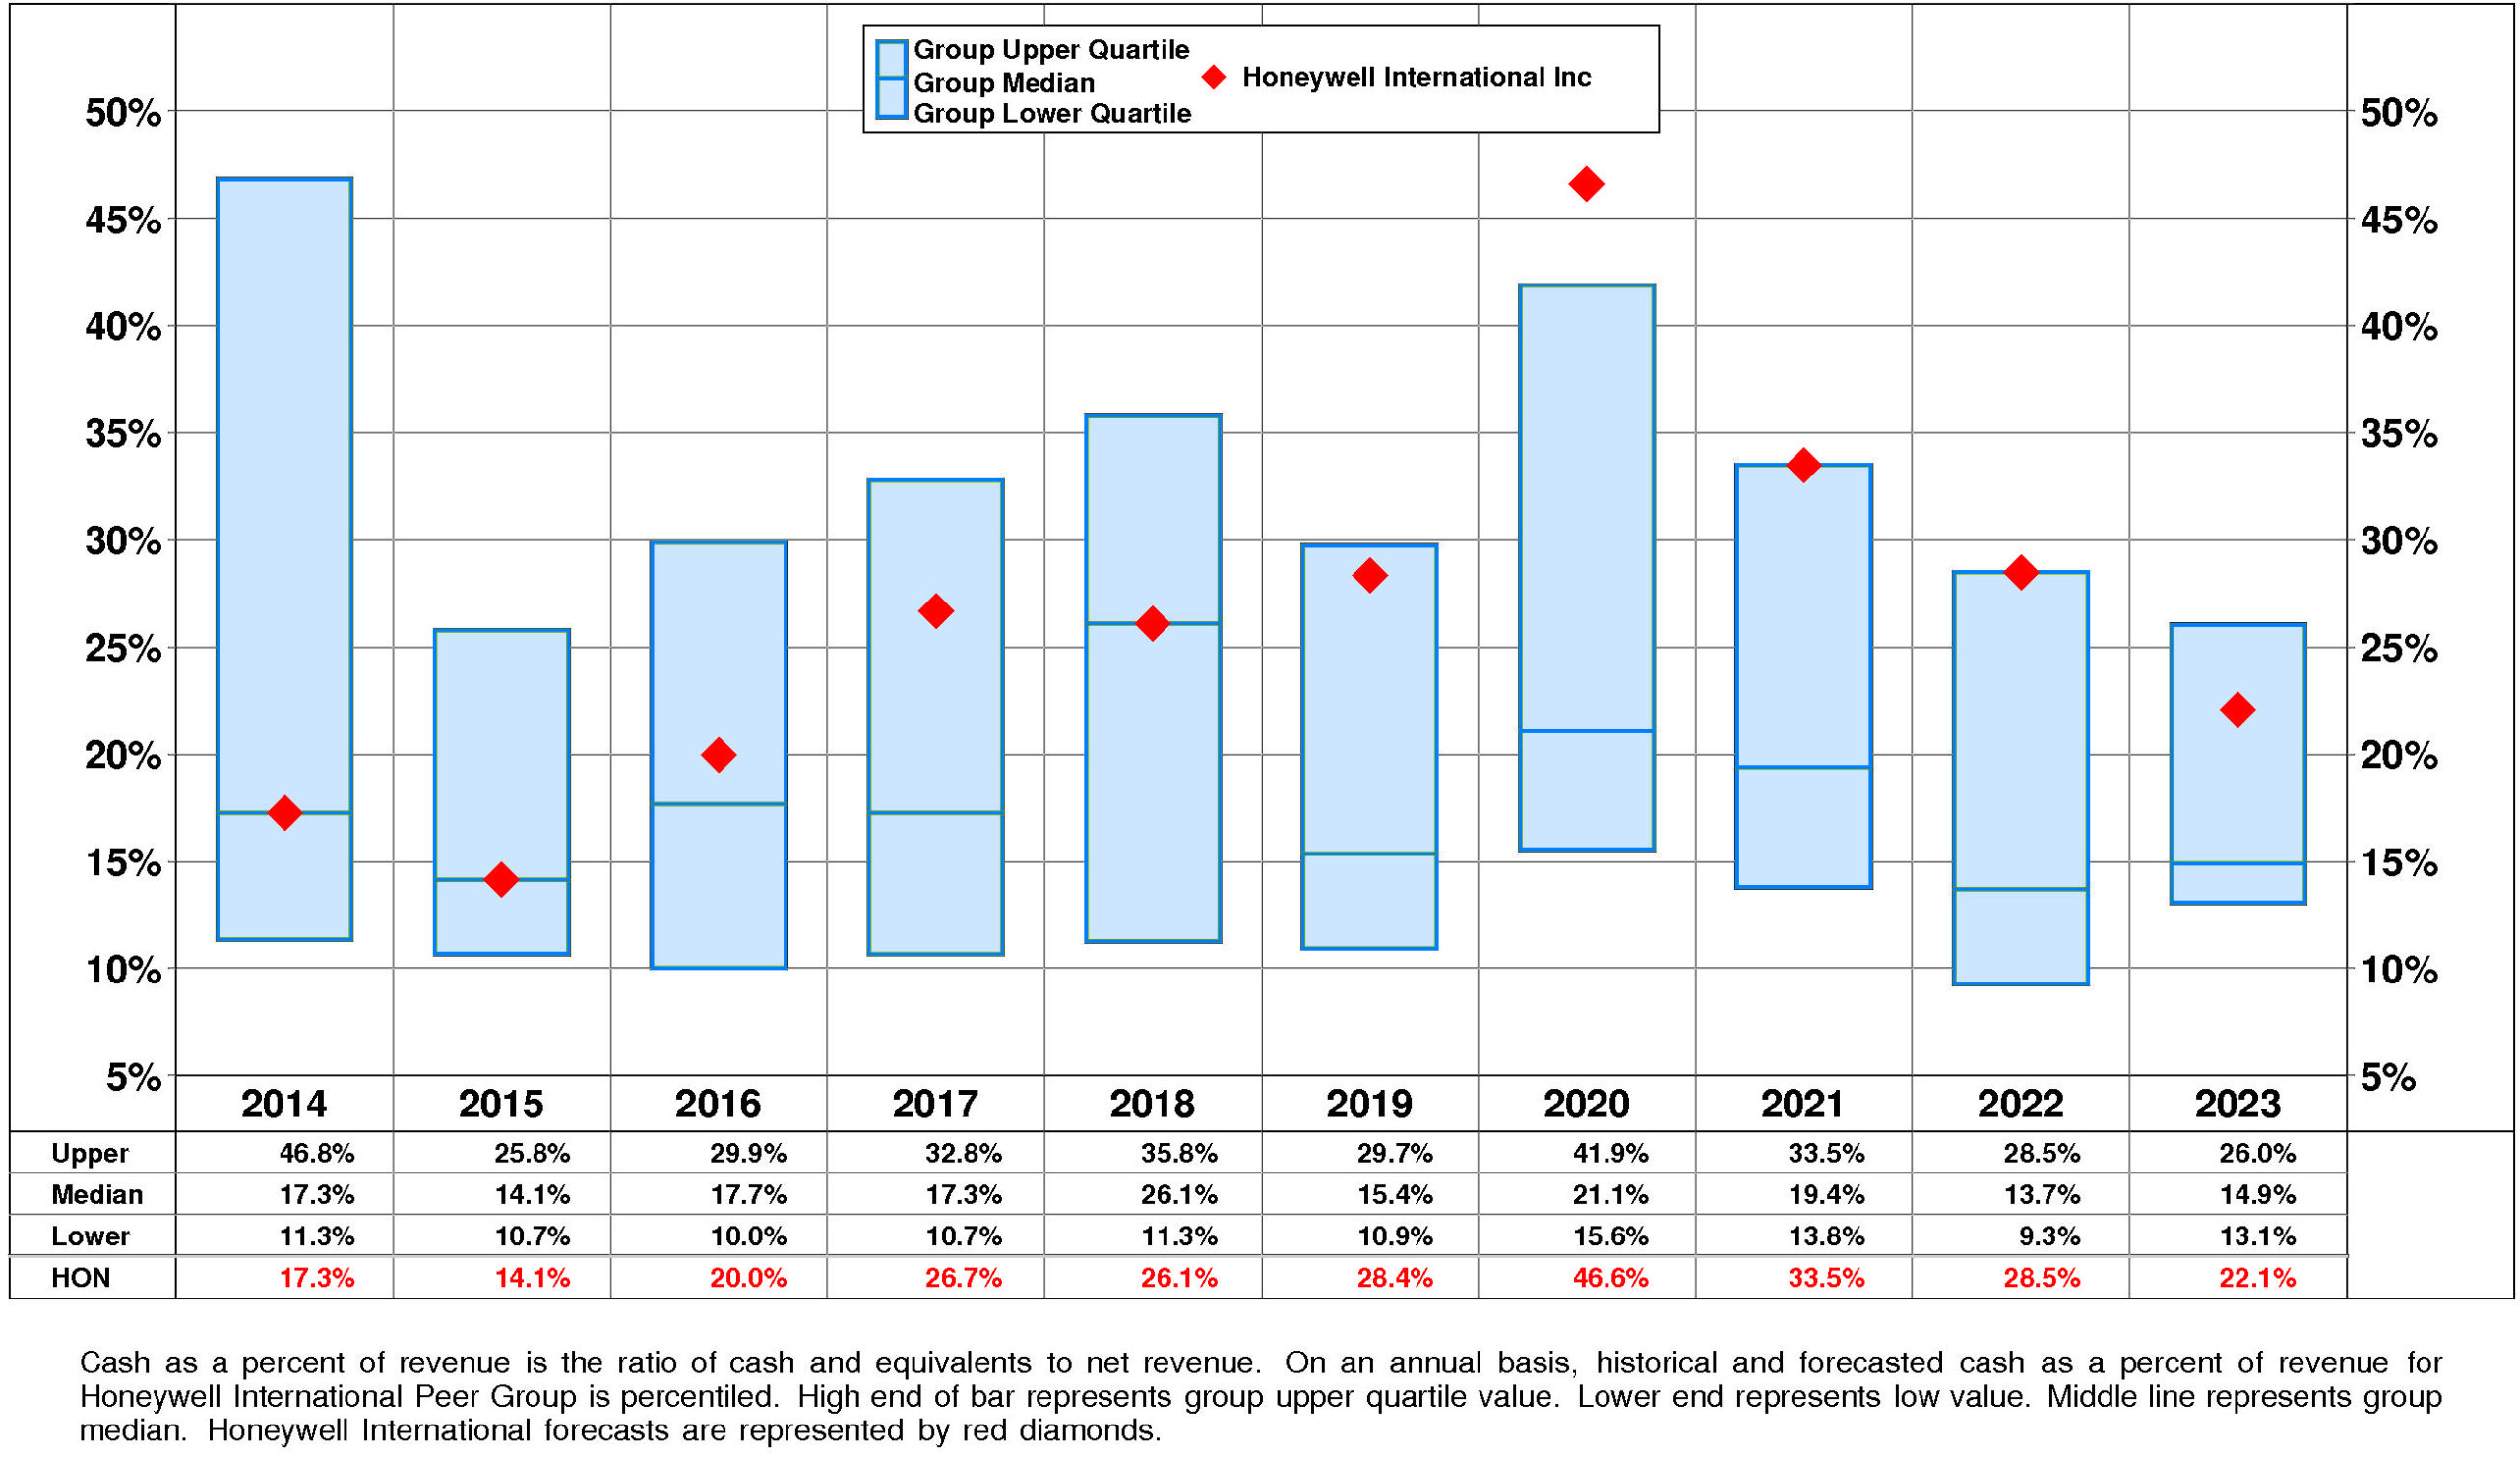
HON's Cash, %Revenue has exhibited a minor overall uptrend over the period.
This improvement was accompanied by stability for the Honeywell International Peer Group. (Since 2020 Cash, %Revenue has experienced a very sharp decline.) In most years, Honeywell International was in the second quartile and top quartile. Currently, Honeywell International is above median at +22%.
PROFITABILITY
HON's return on equity has improved very significantly since 2014. The current level of 35.7% is 1.49X the low for the period and is -4.1% from the high.
HON's minor negative trend in pretax operating return significantly offset by a very strong positive trend in non-operating factors is a significant analytical factor.
The productivity of HON's assets declined over the full period 2014-2023: asset turnover has suffered a very strong overall downtrend.
HON's pretax margin enjoyed a strong overall uptrend over the period 2014-2023.
Non-operating factors (income taxes and financial leverage) had a very significant positive influence on return on equity.
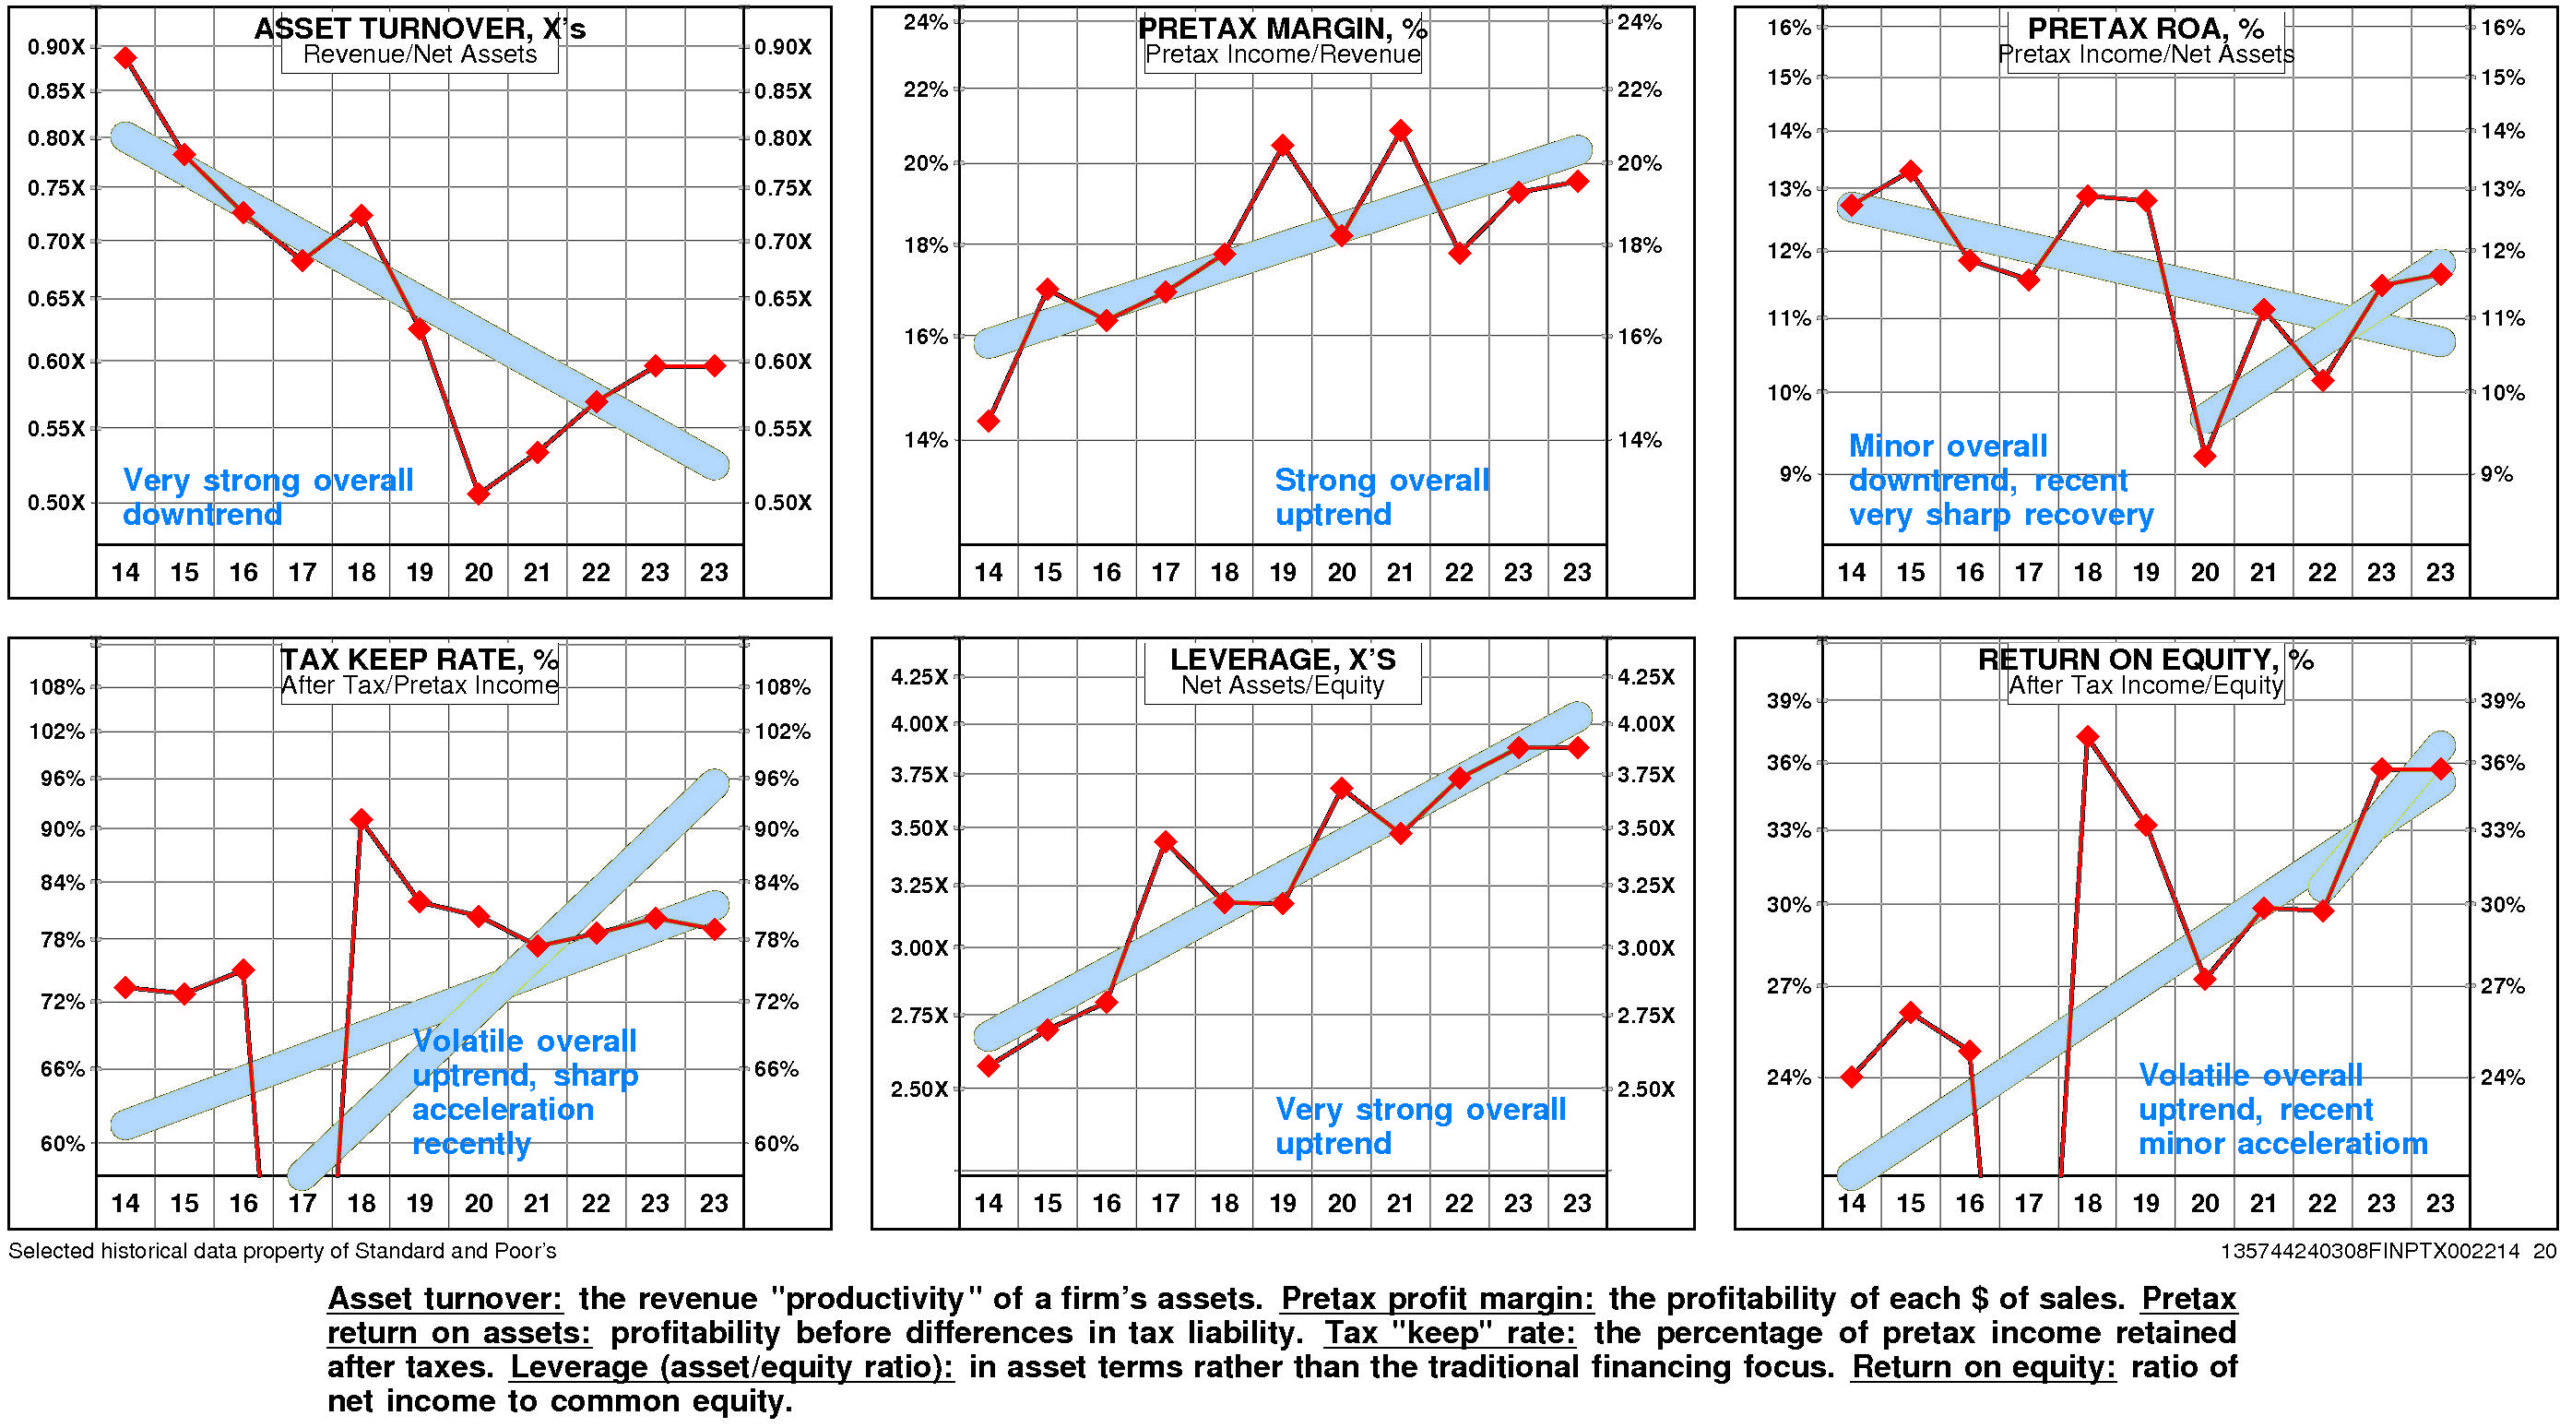
HON's return on equity is at the upper quartile (35.7%) for the four quarters ended December, 2023.
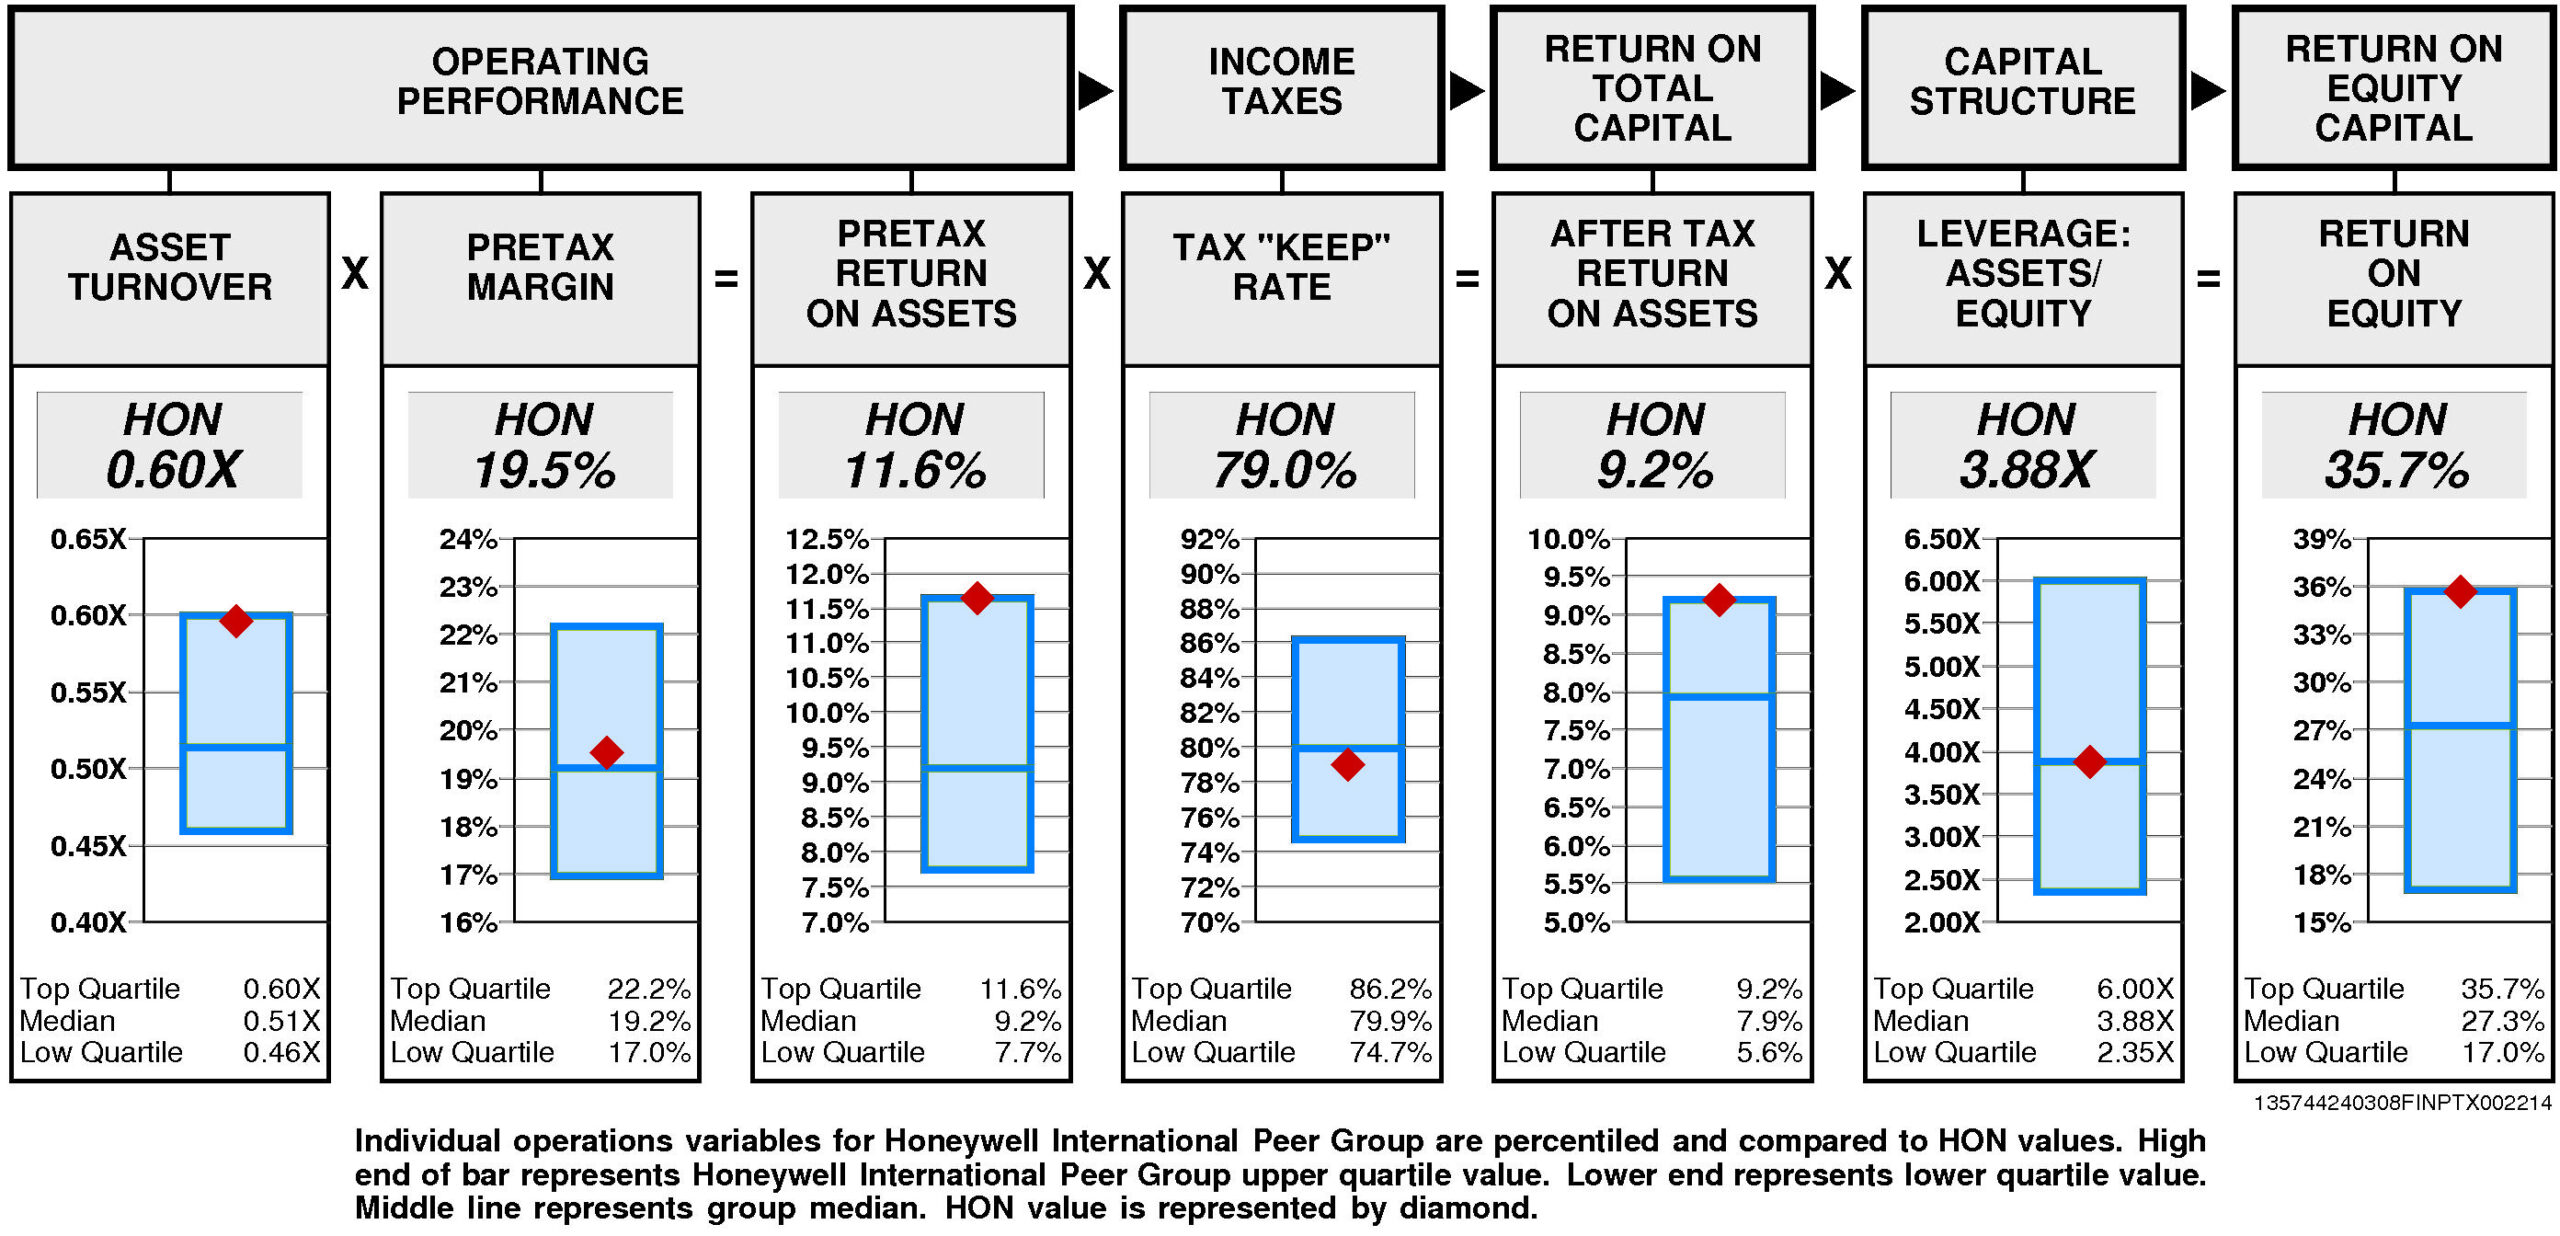
Operating performance (pretax return on assets) is at the upper quartile (11.6%) reflecting asset turnover that is at the upper quartile (0.60X) and at median pretax margin (19.5%).
Tax “keep” rate (income tax management) is at median (79.0%) resulting in after tax return on assets that is at the upper quartile.
Financial leverage (leverage) is at median (3.88X).
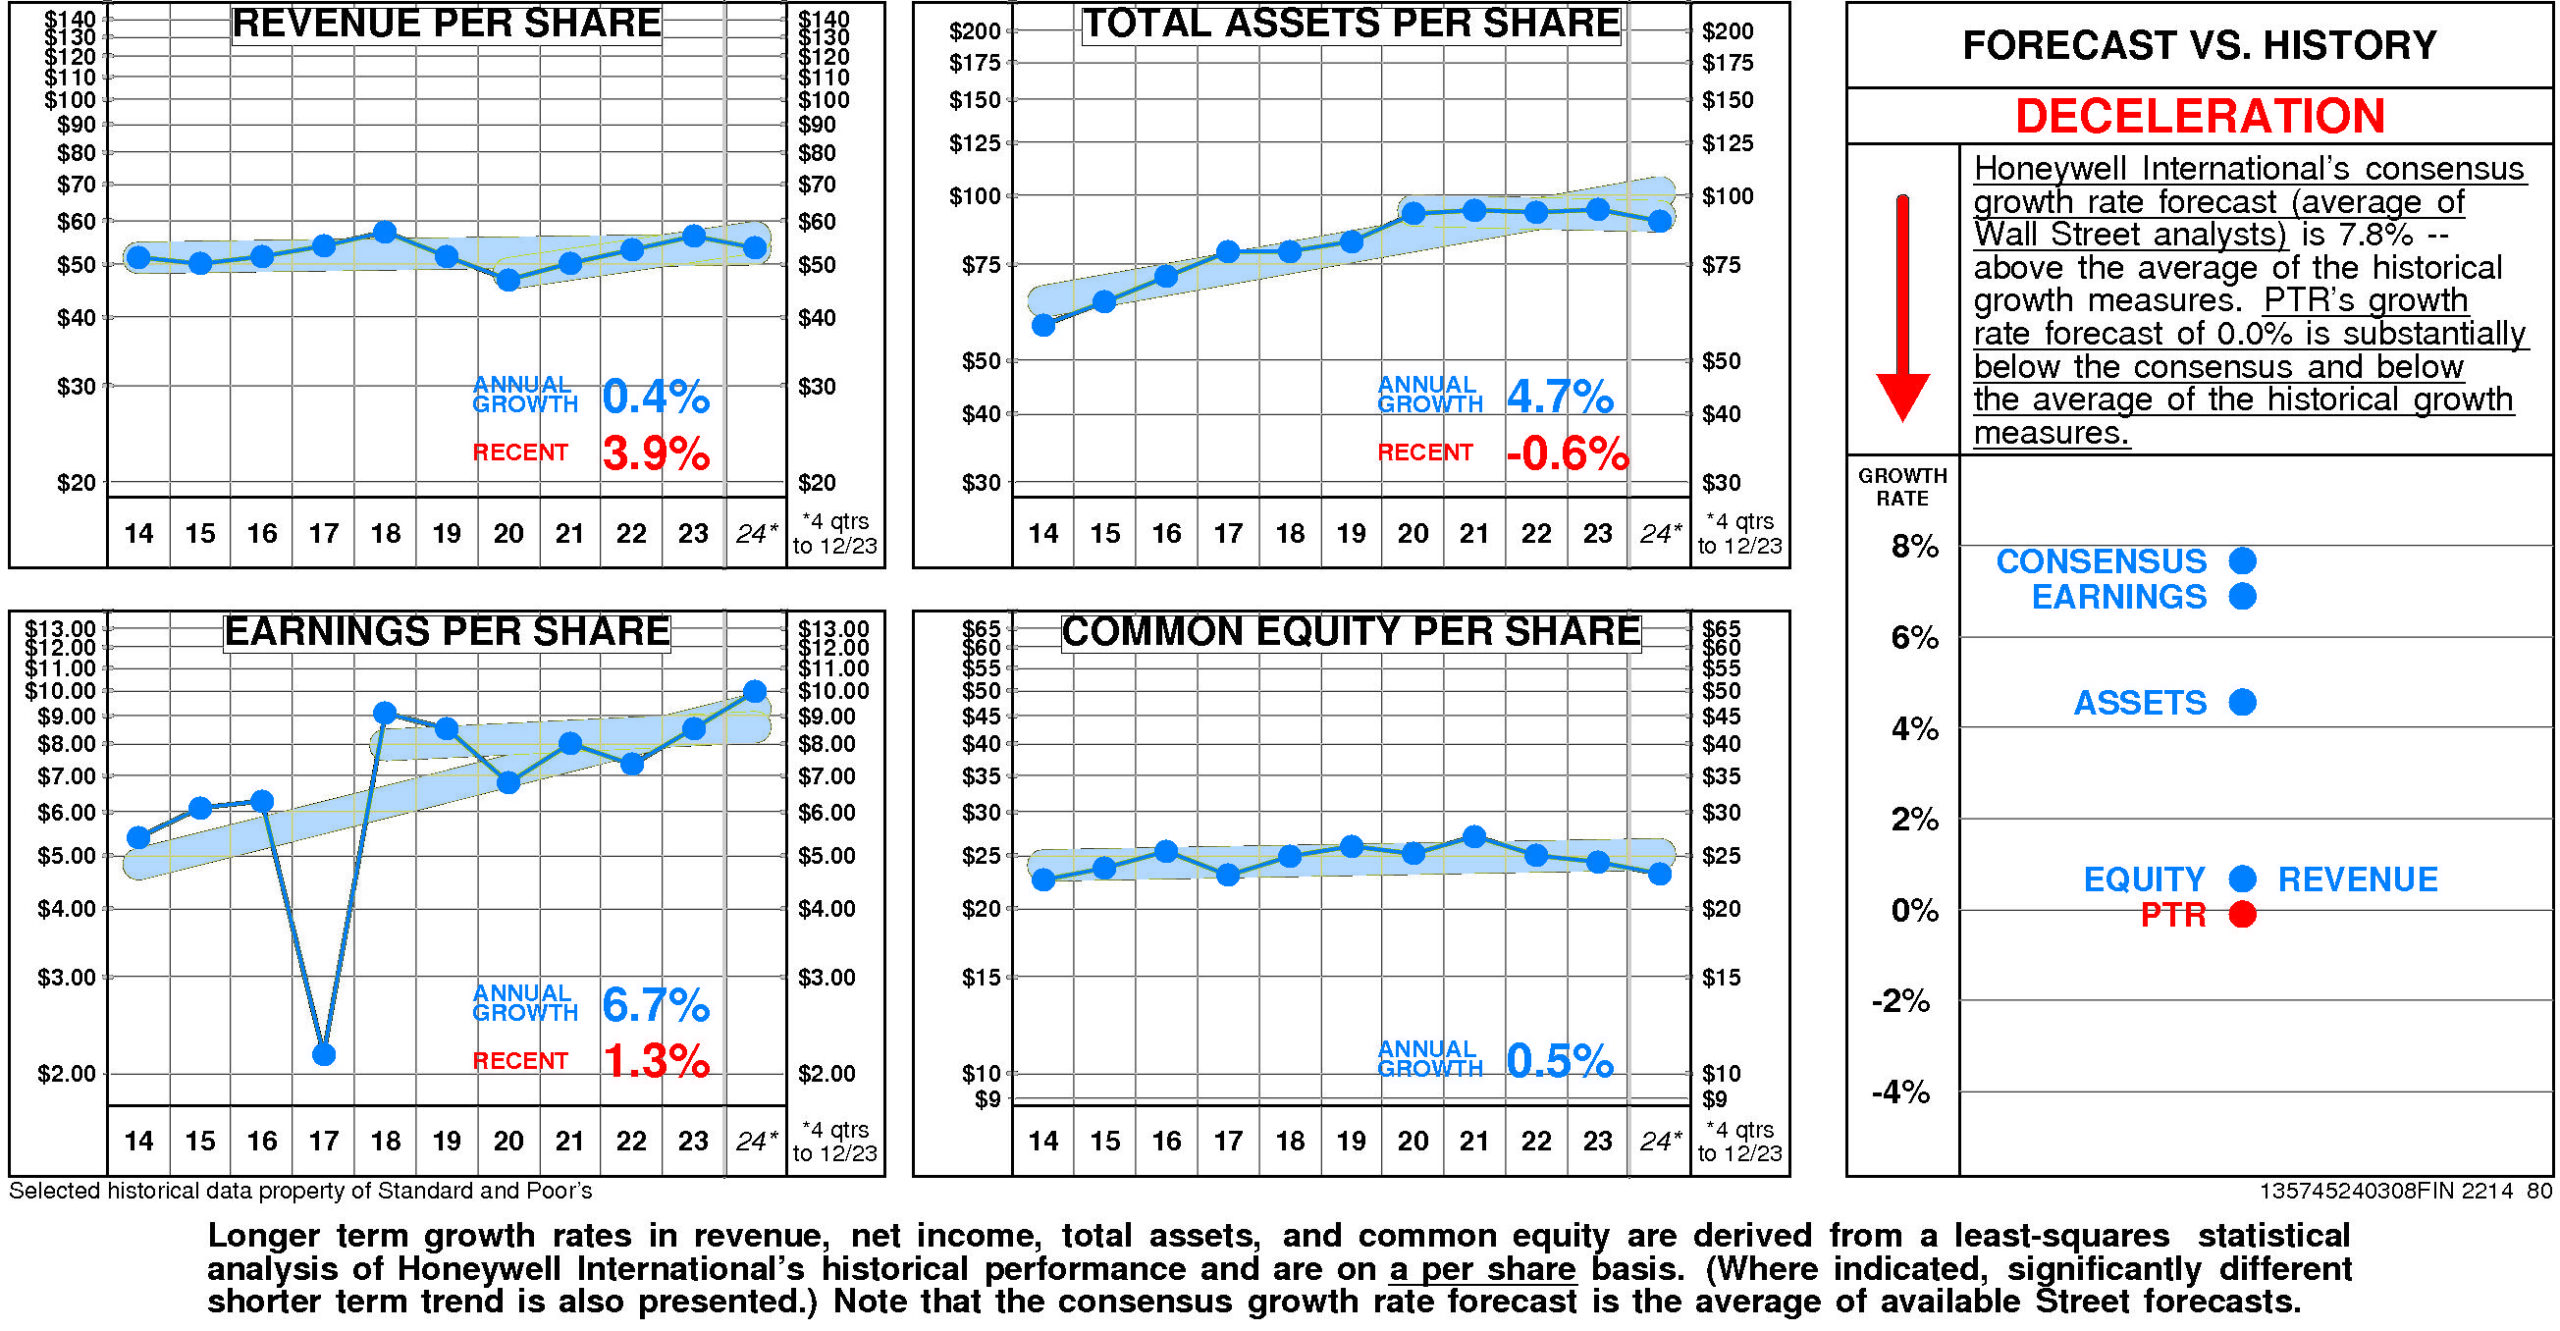
GROWTH RATES
Overall, Honeywell International's growth rate has slowed considerably in recent years.
Honeywell International's historical income statement growth and balance sheet growth have diverged. Revenue growth has paralleled asset growth; earnings growth has exceeded equity growth.
Annual revenue growth
has been 0.4% per year. (More recently it has been 3.9%.)
Total asset growth
has been 4.7% per year. (More recently it has been -0.6%.)
Annual E.P.S. growth
has been 6.7% per year. (More recently it has been 1.3%.)
Equity growth
has been 0.5% per year.
Honeywell International's consensus growth rate forecast (average of Wall Street analysts)
is 7.8% — above the average of the historical growth measures.
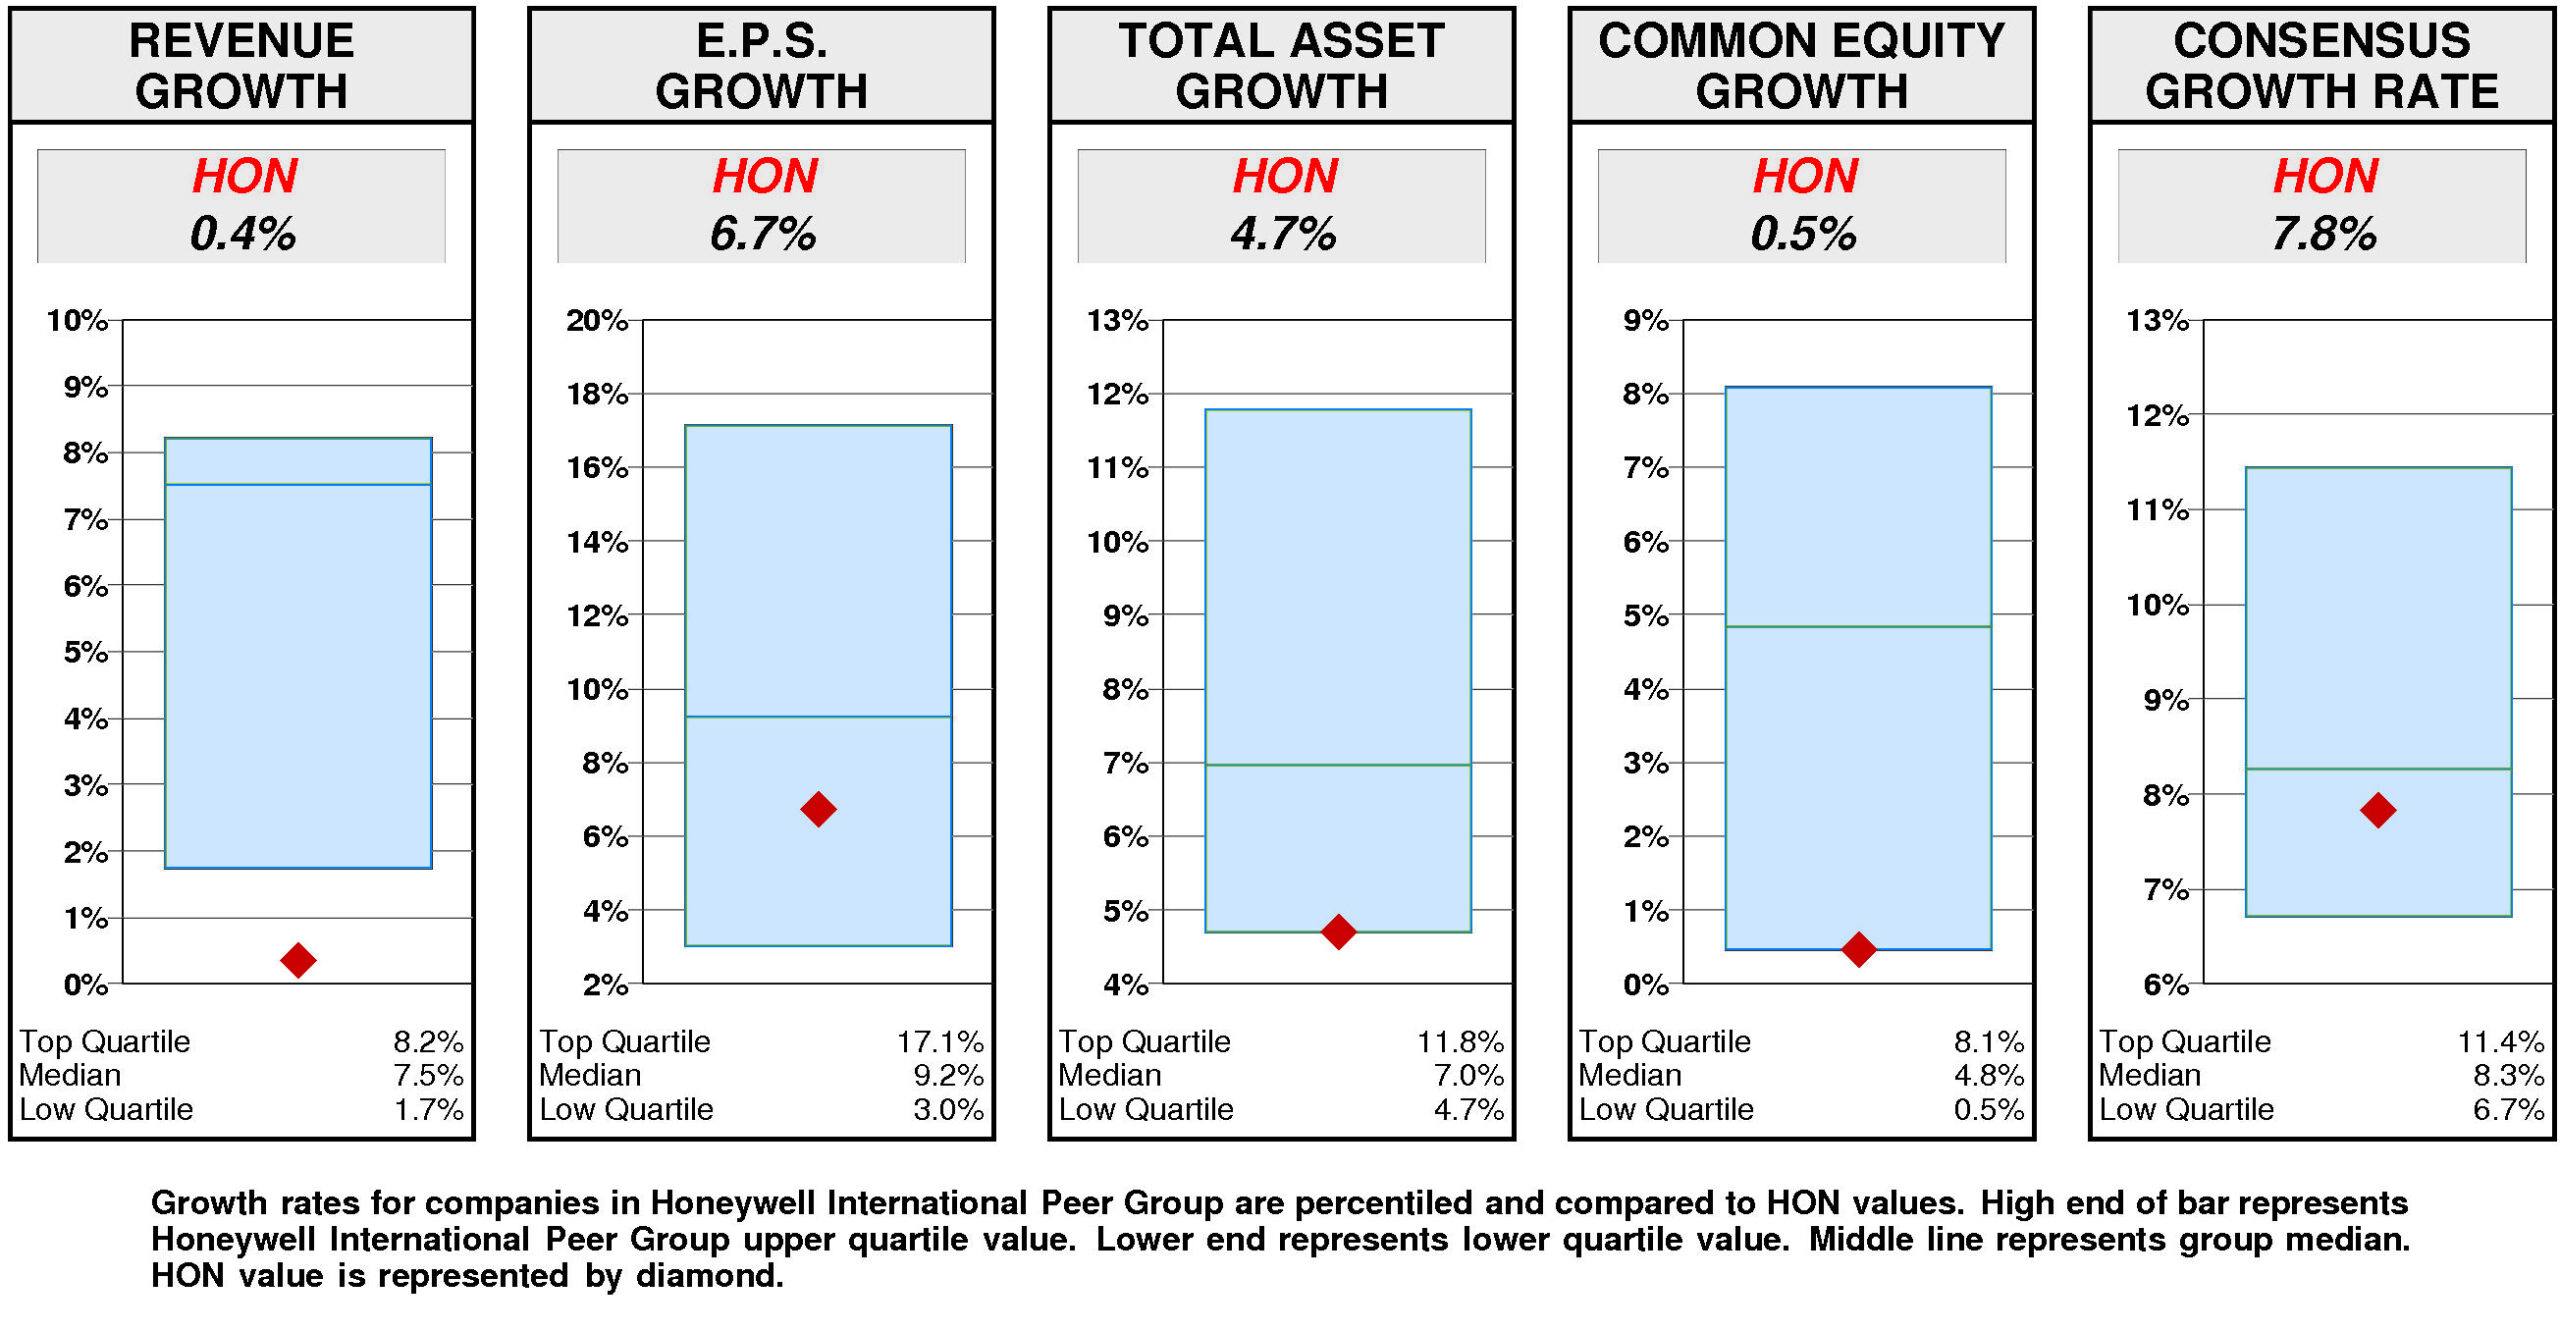
Relative to the Honeywell International Peer Group, Honeywell International's historical growth measures are generally third quartile.
E.P.S. growth (6.7%) has been below median. Total asset growth (4.7%) has been at the lower quartile. Equity growth (0.5%) has been at the lower quartile. Revenue growth (0.4%) has been lower quartile.
Consistent with this pattern, consensus growth forecast (7.8%) is also below median.
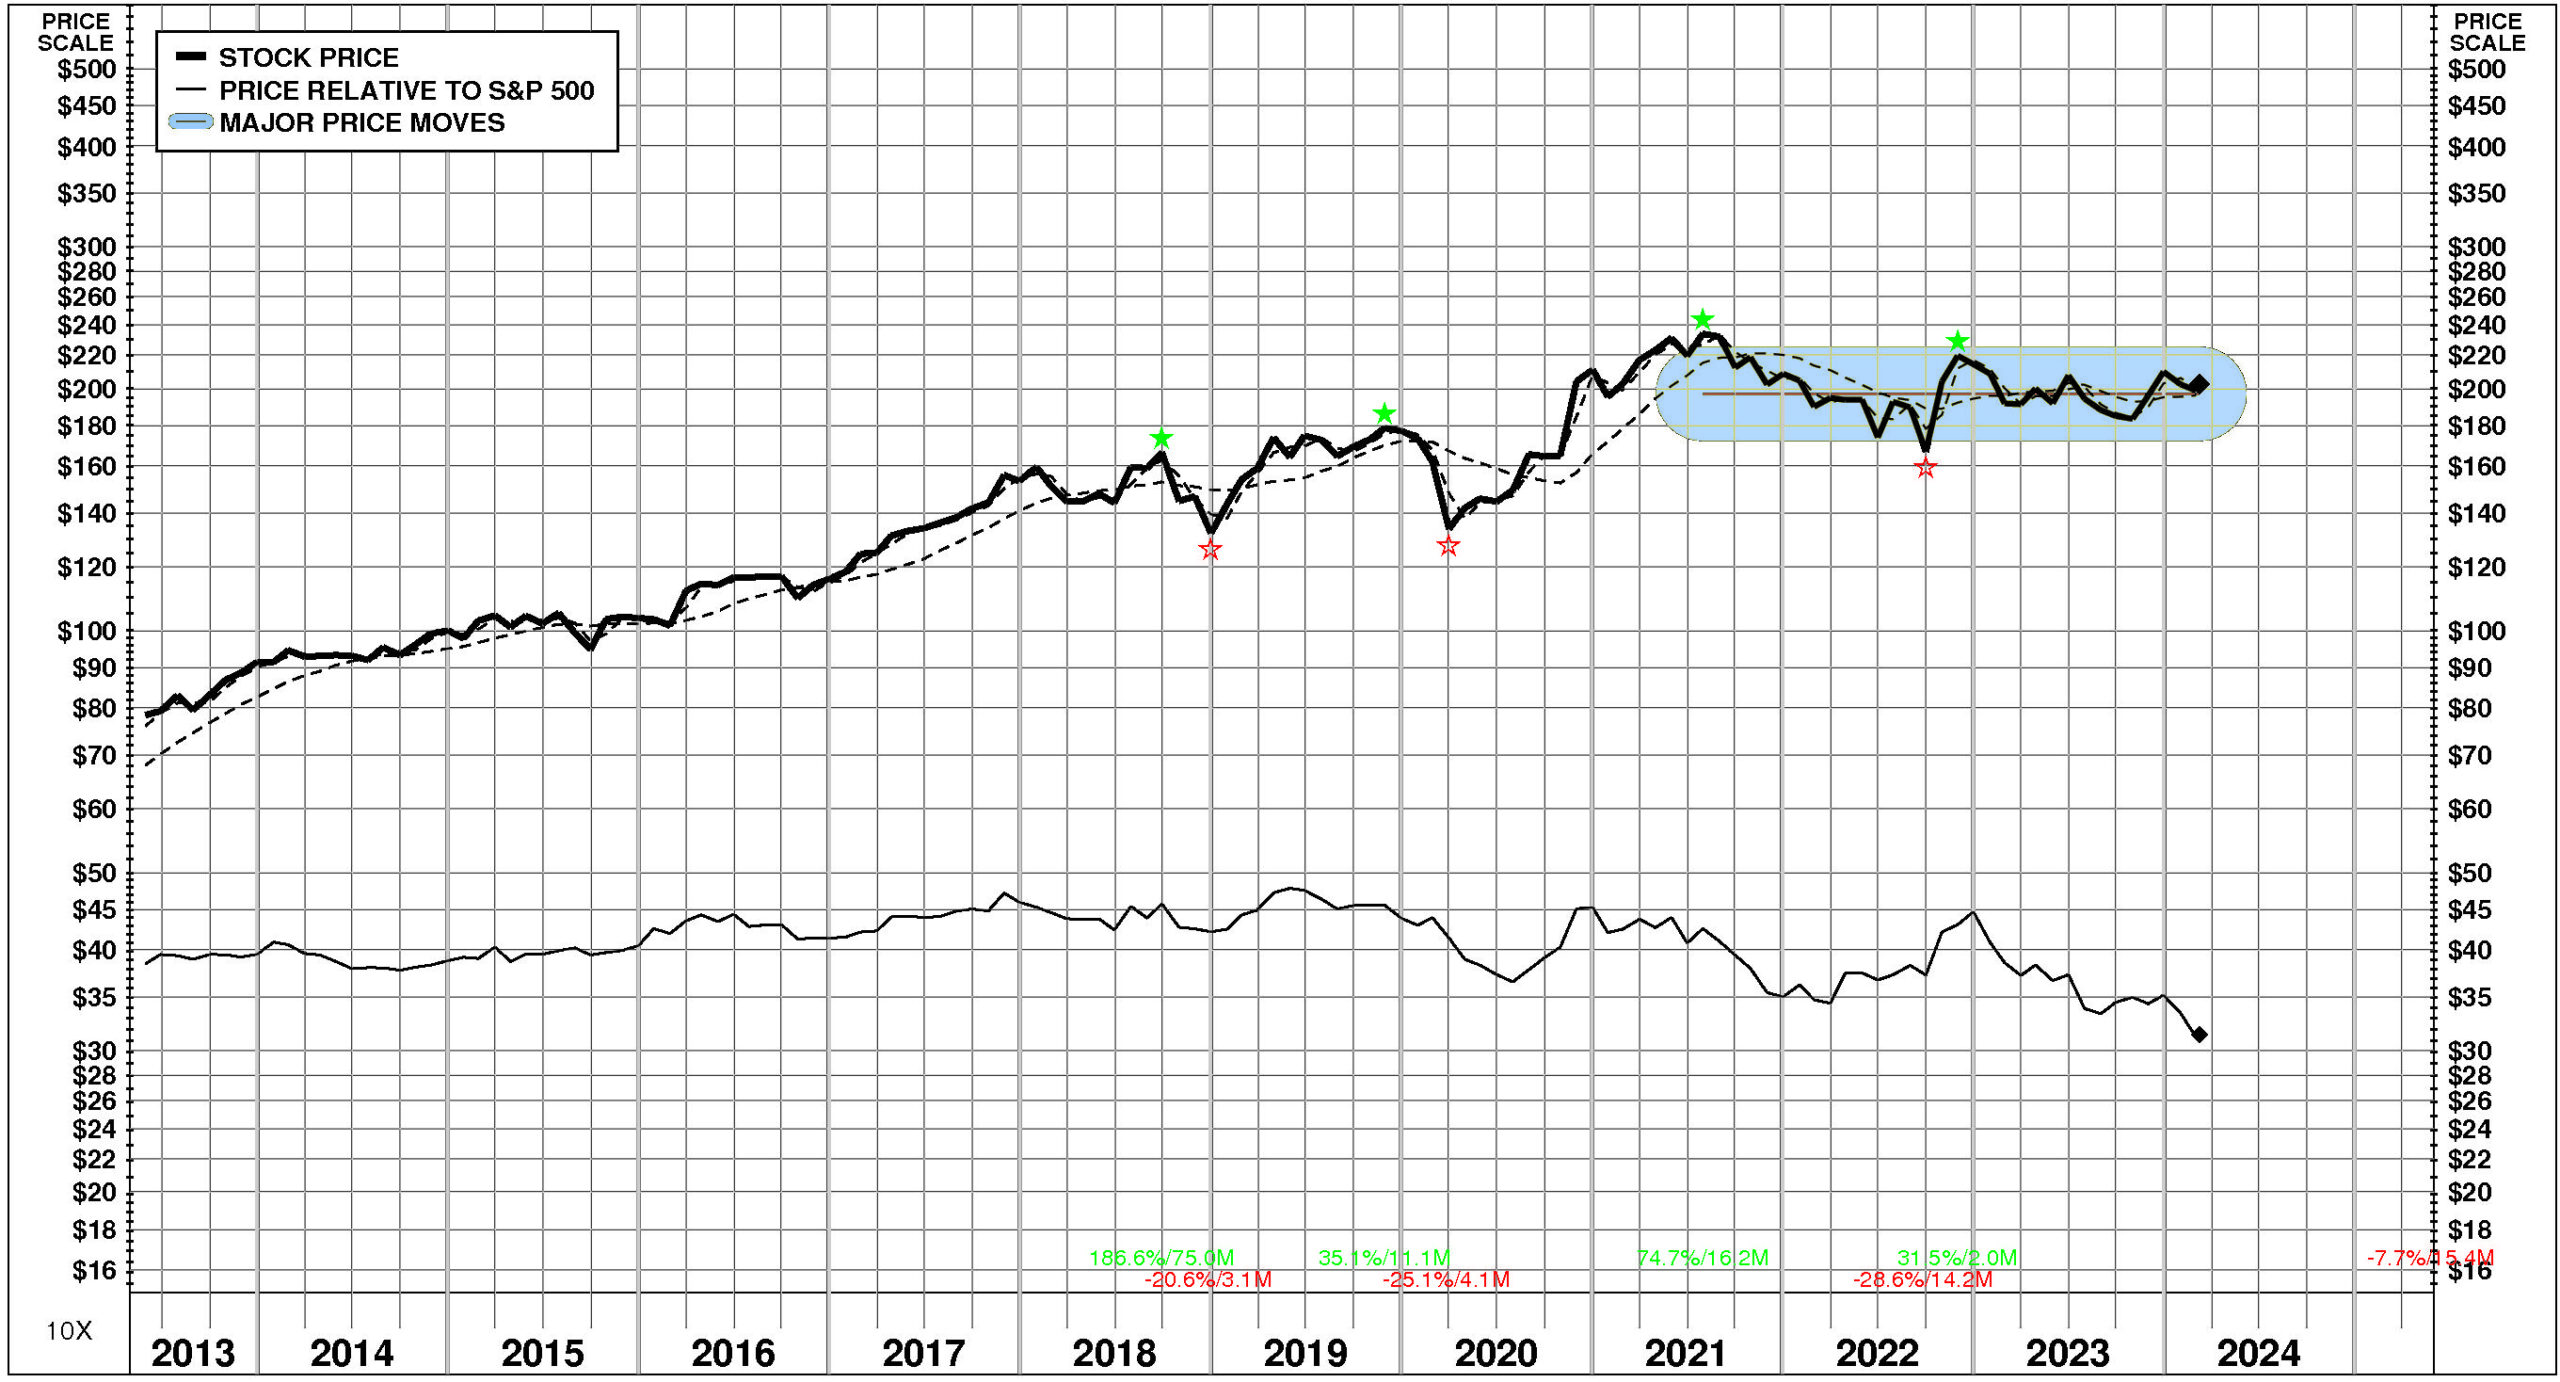
PRICE HISTORY
Over the full time period, Honeywell International's stock price performance has been slightly below market.
Between May, 2013 and March, 2024, Honeywell International's stock price rose +158%; relative to the market, this was a -18% loss.
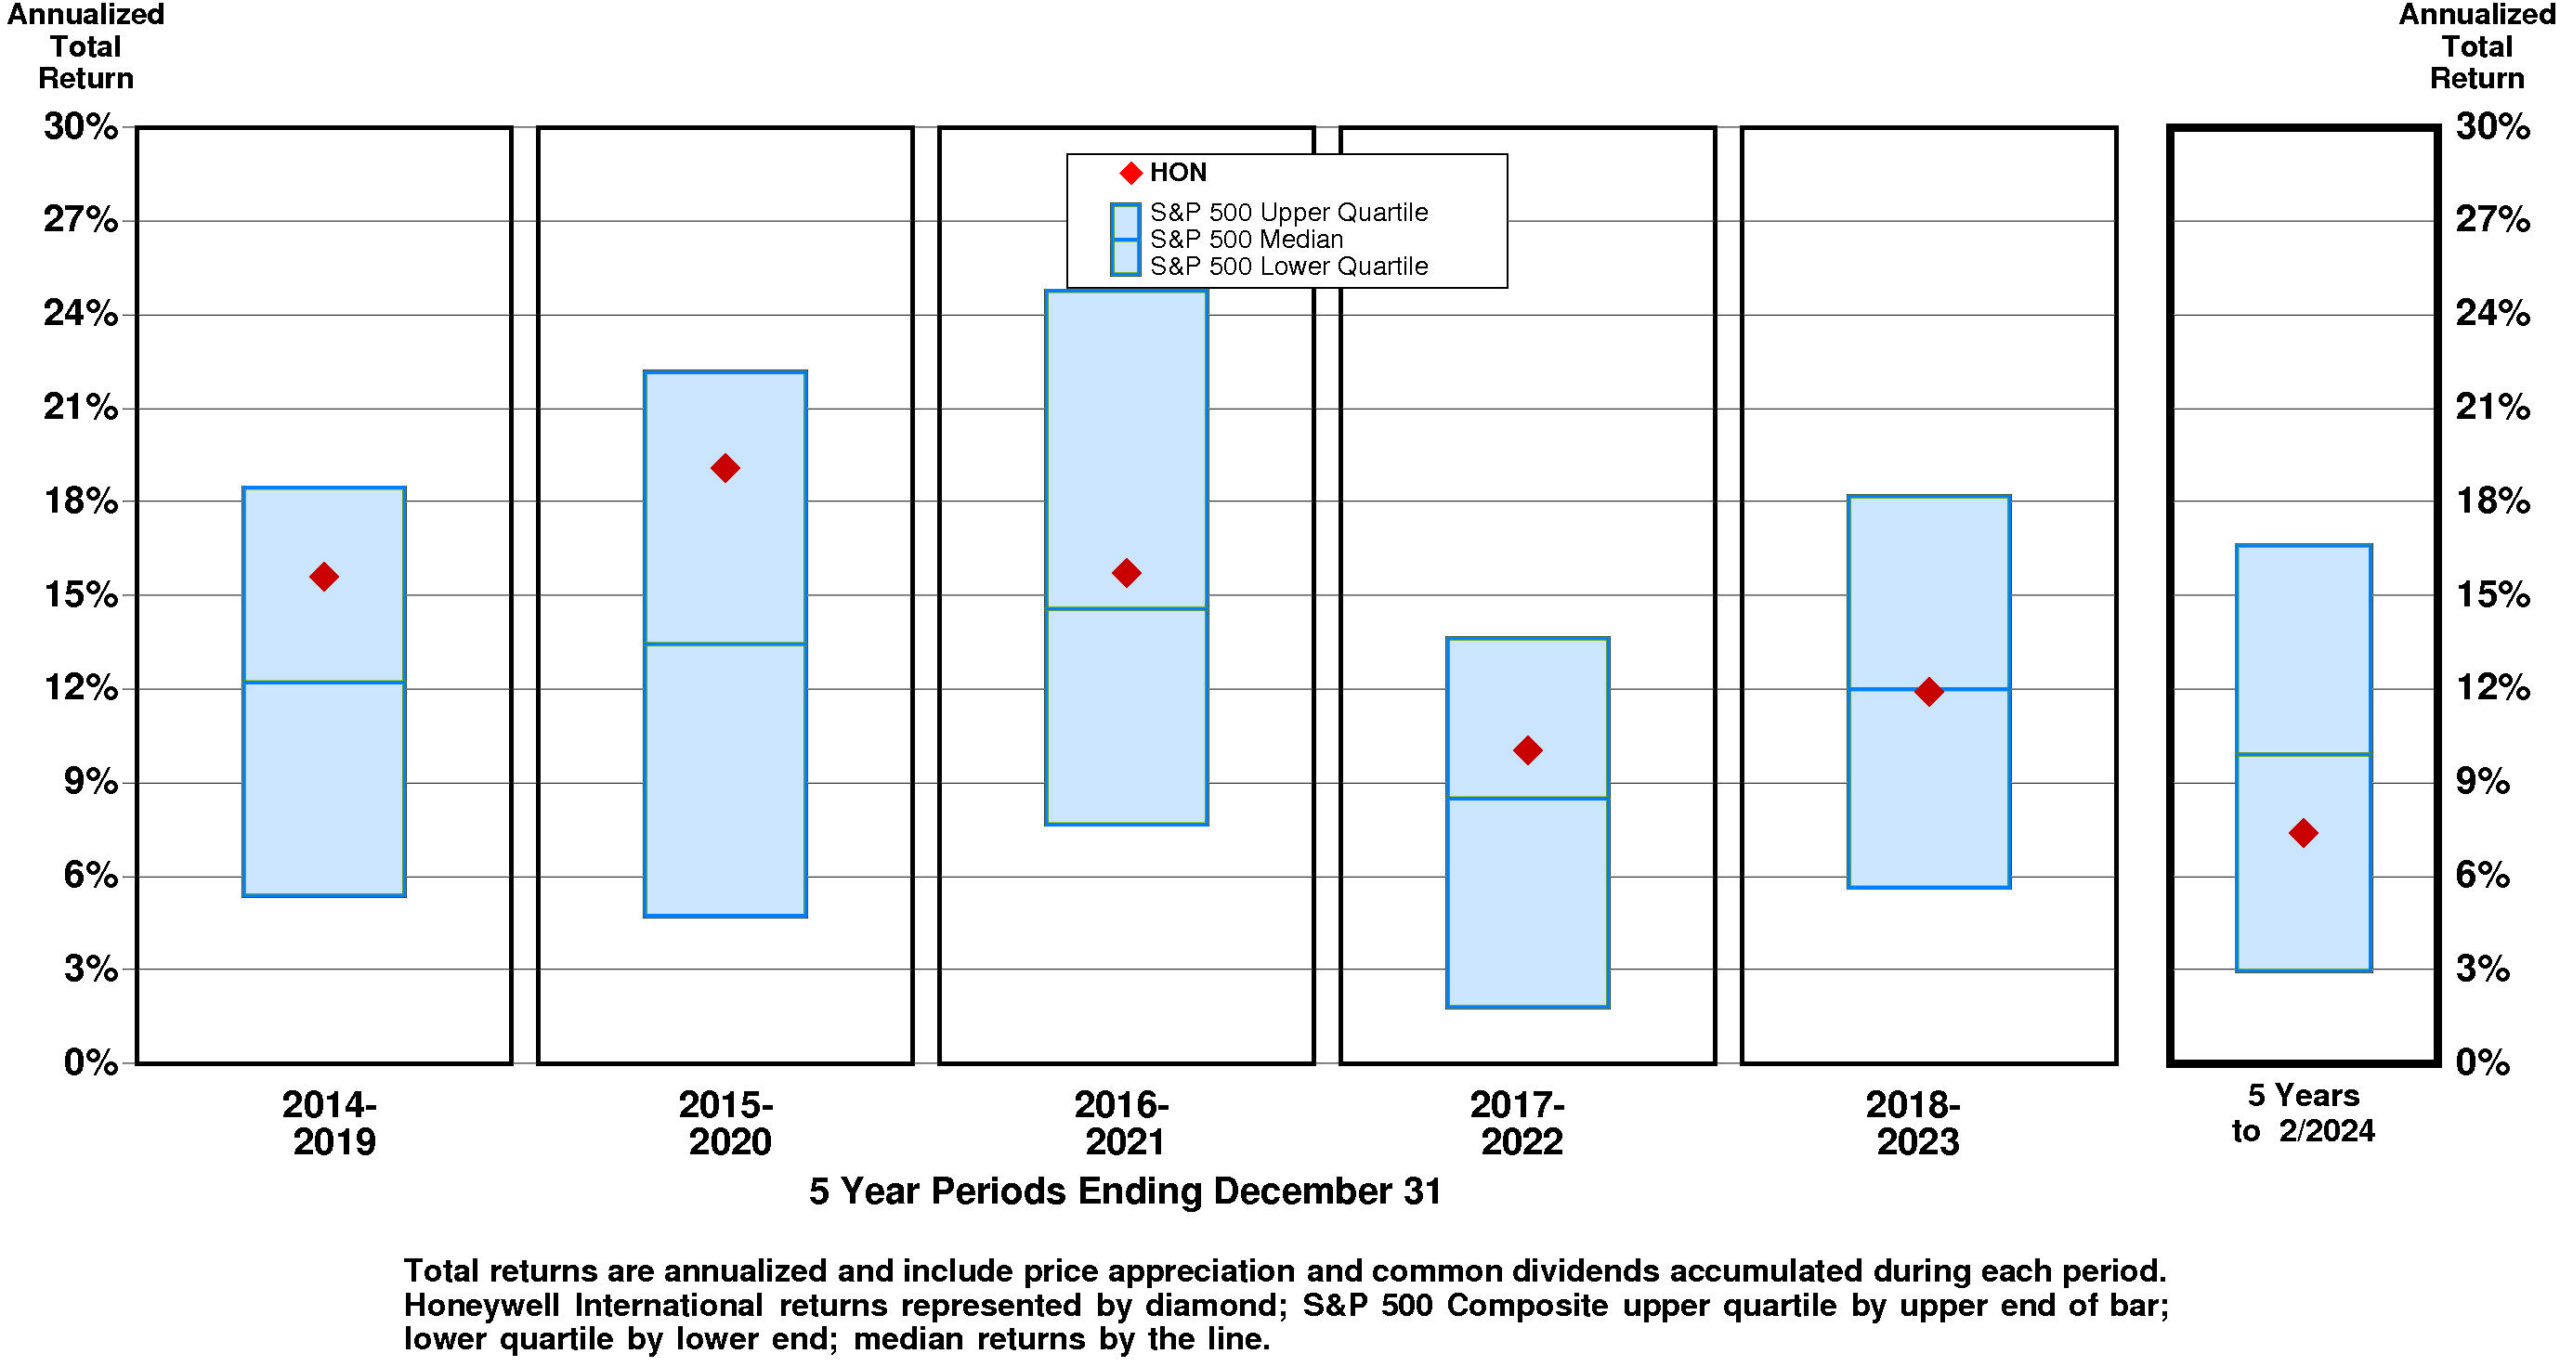
TOTAL INVESTMENT RETURNS
Current annual total return performance of 6.1% is below median relative to the S&P 500 Composite.
In addition to being below median relative to S&P 500 Composite, current annual total return performance through February, 2024 of 6.1% is below median relative to Honeywell International Inc Peer Group.
Current 5-year total return performance of 7.4% is below median relative to the S&P 500 Composite.
Through February, 2024, with below median current 5-year total return of 7.4% relative to S&P 500 Composite, Honeywell International's total return performance is below median relative to Honeywell International Inc Peer Group.
VALUATION BENCHMARKS
Relative to S&P 500 Composite, HON's overall valuation is normal.
The highest factor, the price/equity ratio, is upper quartile. Ratio of enterprise value/assets is above median. Ratio of enterprise value/revenue is slightly above median. Ratio of enterprise value/earnings before interest and taxes is slightly below median. The lowest factor, the price/earnings ratio, is slightly below median.
Relative to Honeywell International Peer Group, HON's overall valuation is normal.
The highest factor, the price/equity ratio, is slightly above median. Ratio of enterprise value/assets is slightly above median. Ratio of enterprise value/earnings before interest and taxes is at the lower quartile. Price/earnings ratio is at the lower quartile. The lowest factor, the ratio of enterprise value/revenue, is below median.
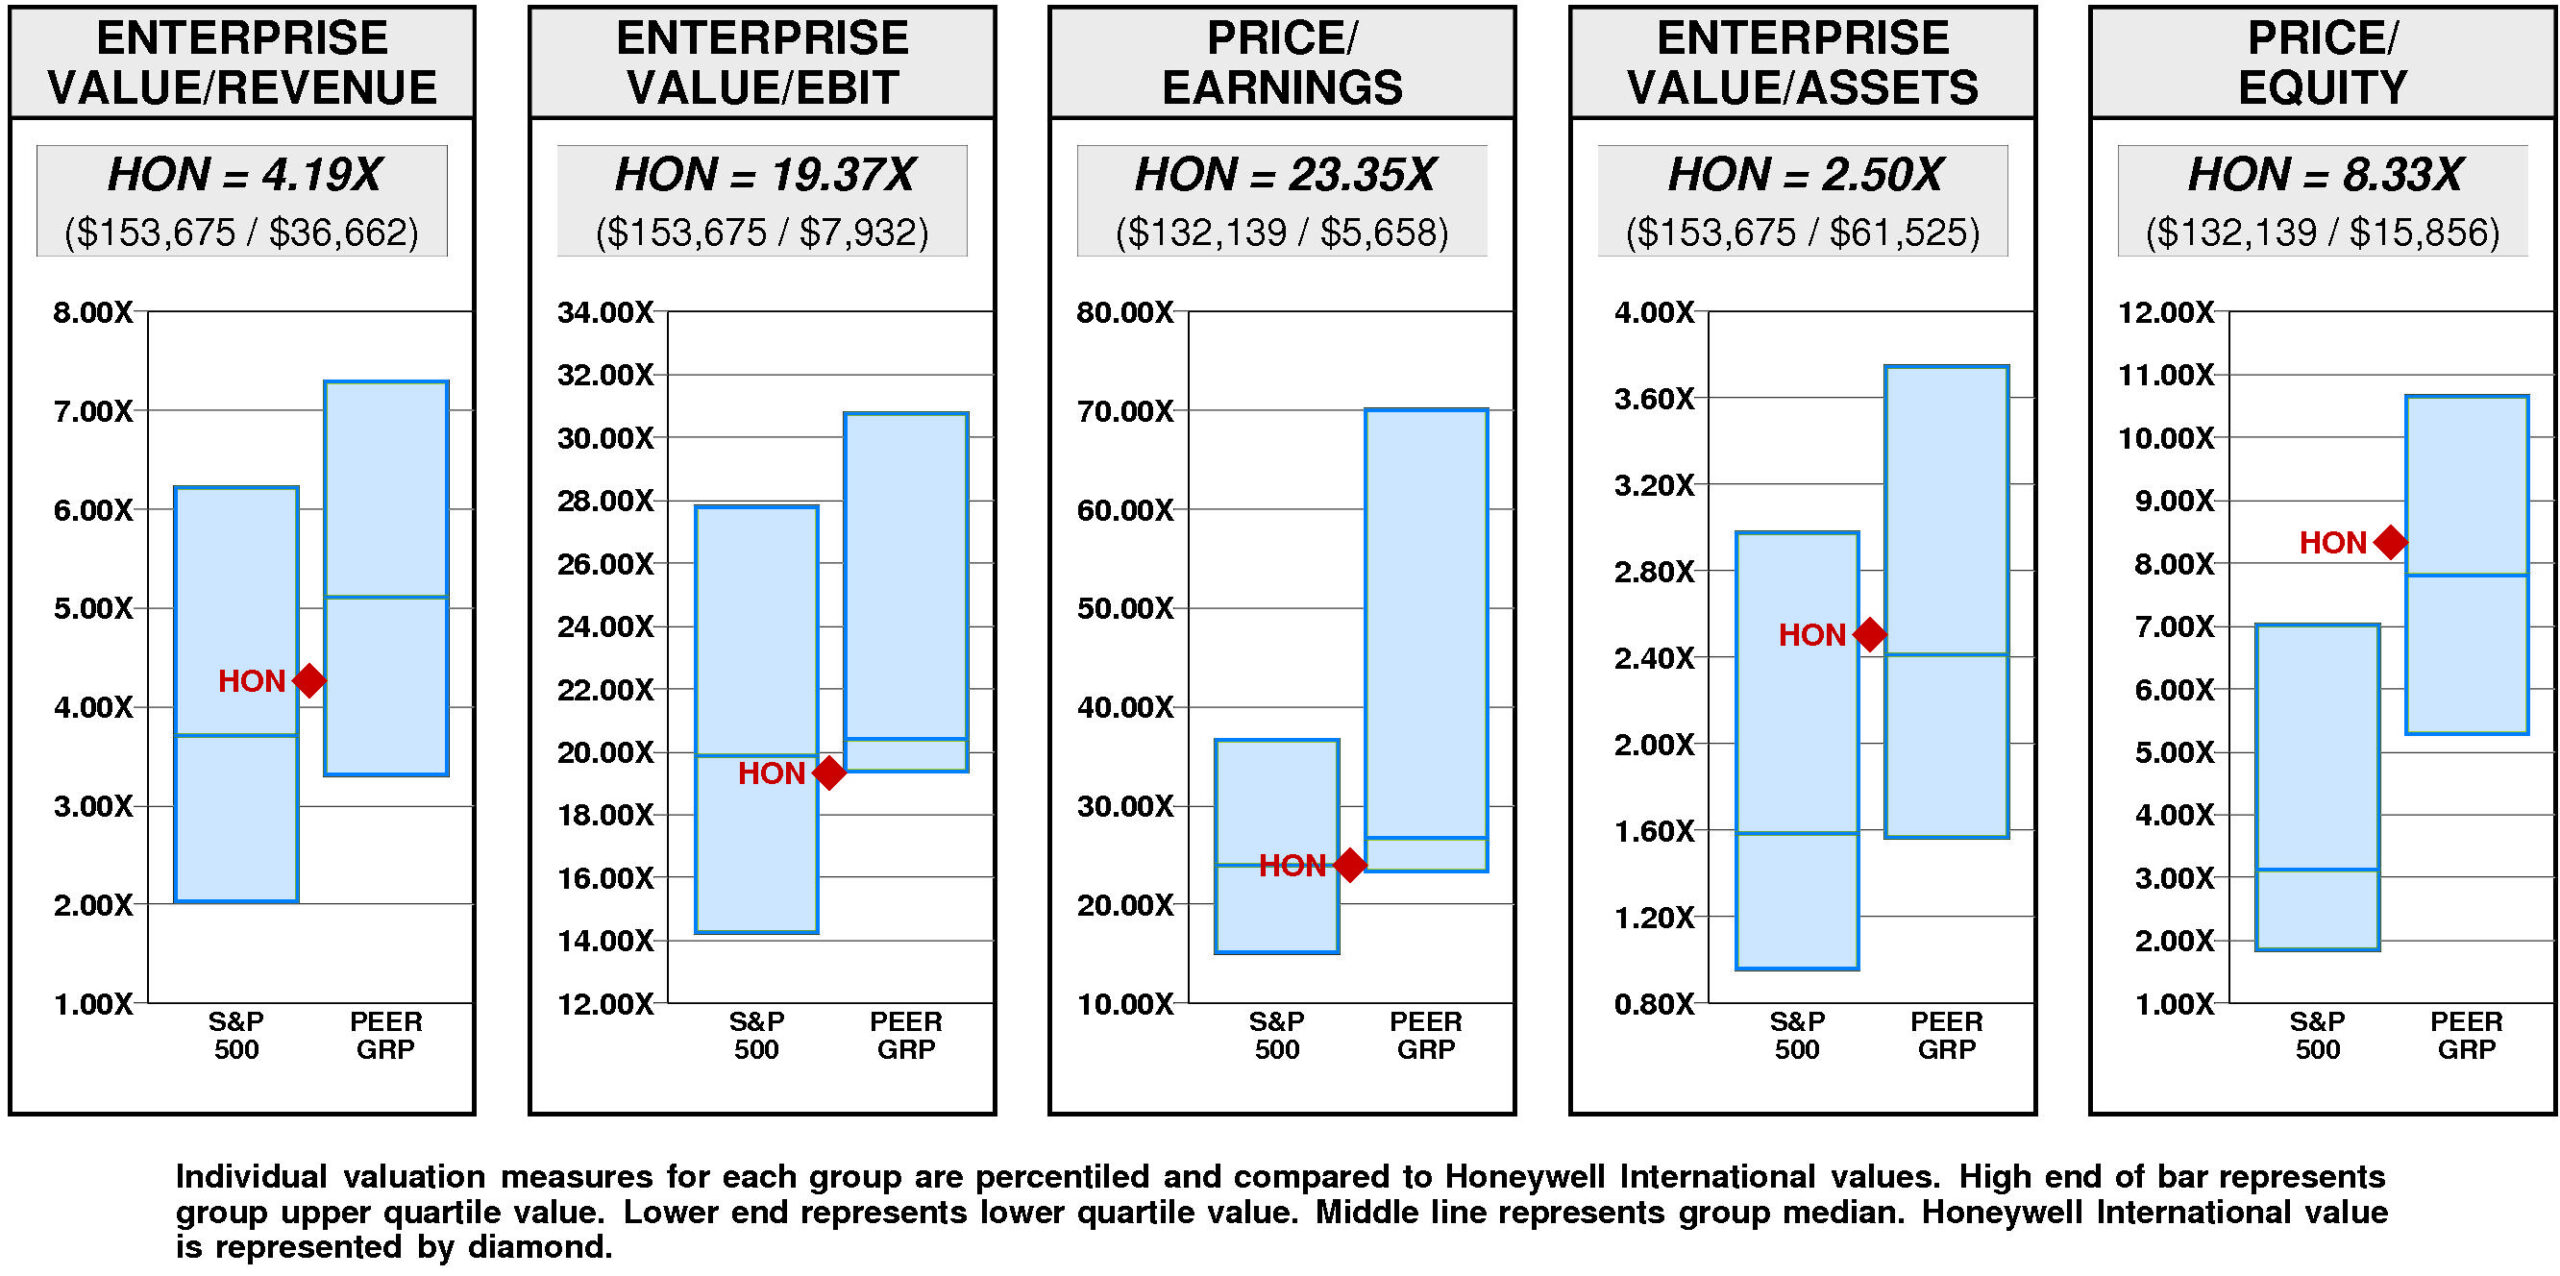
Honeywell International has a very large value gap compared to the median valuation.
For HON to rise to median valuation, its current ratio of enterprise value/revenue would have to rise from the current level of 4.19X to 5.11X. If HON's ratio of enterprise value/revenue were to rise to 5.11X, its stock price would be lower by $52 to $254.
For HON to hit lower quartile valuation relative to the Honeywell International Peer Group, its current ratio of enterprise value/revenue would have to fall from the current level of 4.19X to 3.32X. If HON's ratio of enterprise value/revenue were to fall to 3.32X, its stock price would decline by $-49 from the current level of $203.
VALUE TARGETS
HON's future returns on capital are forecasted to exceed the cost of capital. Accordingly, the company is expected to continue to be a major Value Builder.
Honeywell International's current Price Target of $116 represents a -43% change from the current price of $202.61.
Honeywell International's low appreciation potential results in an appreciation score of 16 (84% of the universe has greater appreciation potential.)
Notwithstanding this low Appreciation Score of 16, the moderately high Power Rating of 63 results in an Value Trend Rating of D.
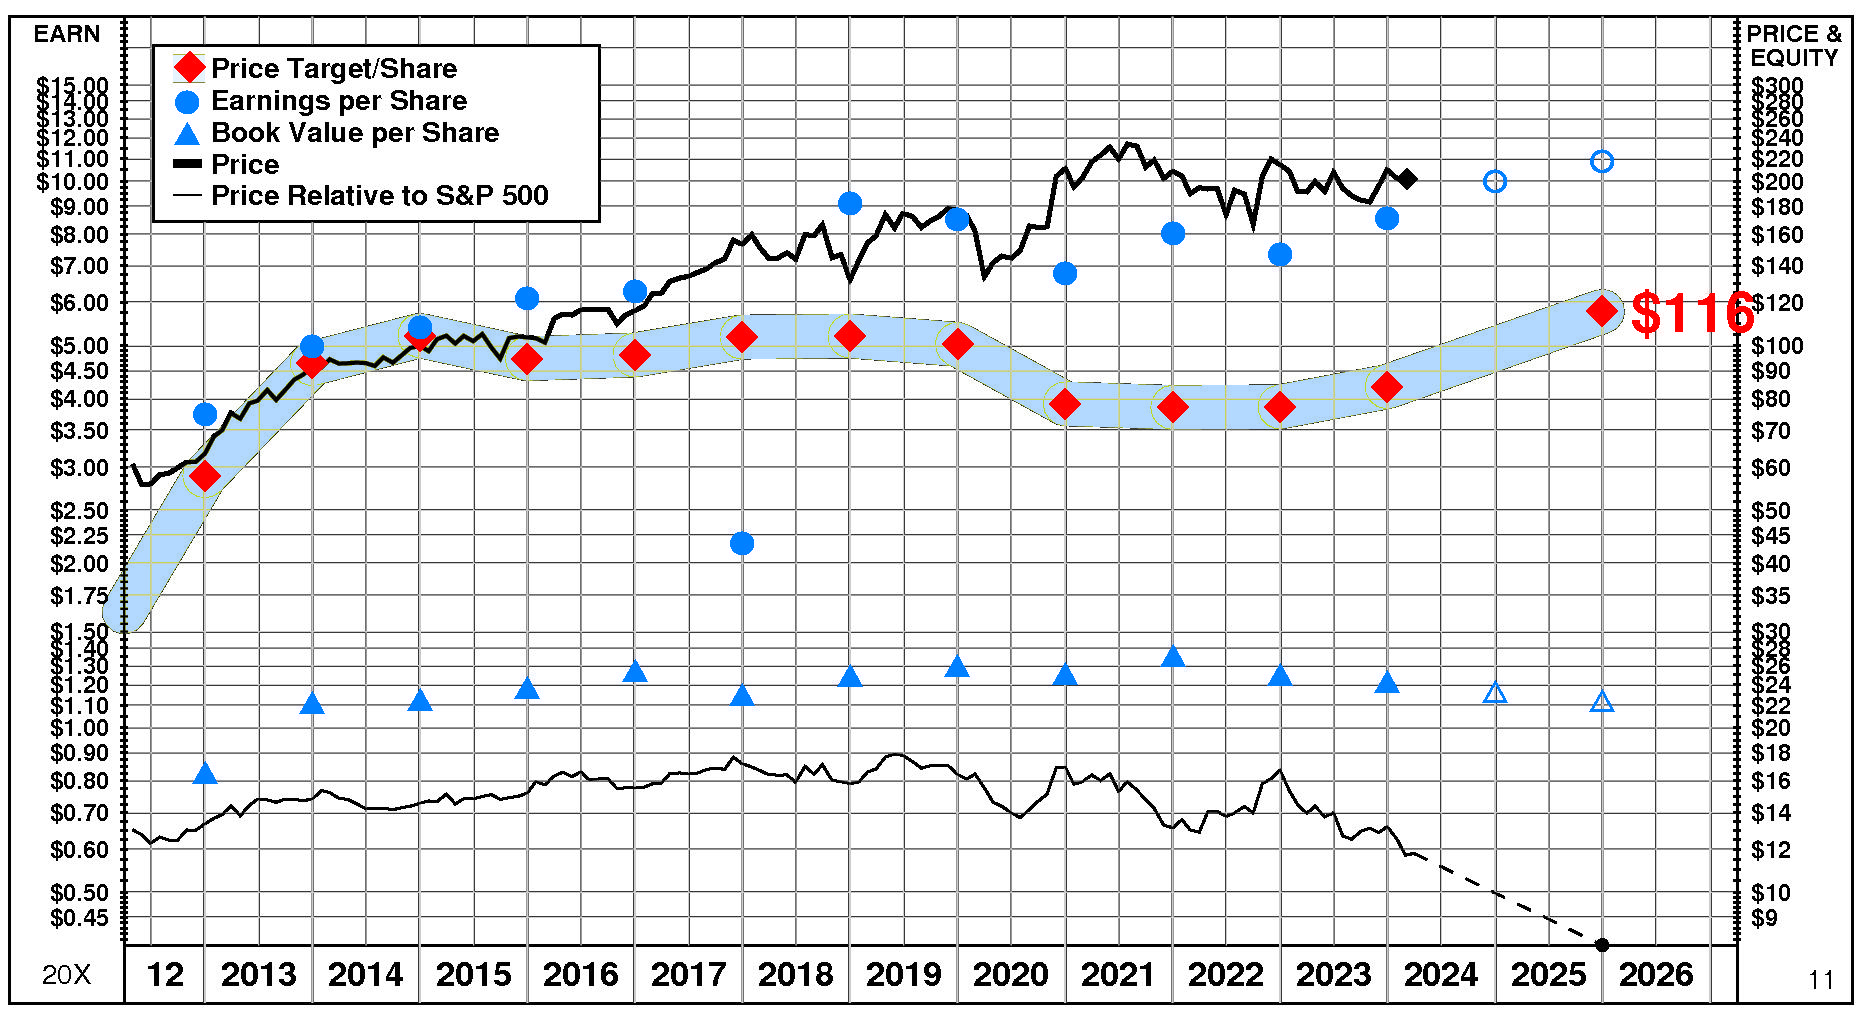
Honeywell International's current Price Target is $116 (+37% from the 2023 Target of $84 but -43% from the 03/07/24 price of $202.61).
This dramatic rise in the Target is the result of a -2% decrease in the equity base and a +41% increase in the price/equity multiple. One Driver has a positive impact on the price/equity multiple, one has a negative impact, and one has no effect. The forecasted increase in return on equity has a very large positive impact on the price/equity multiple. The forecasted growth has no impact. The forecasted increase in cost of equity has no negative impact.
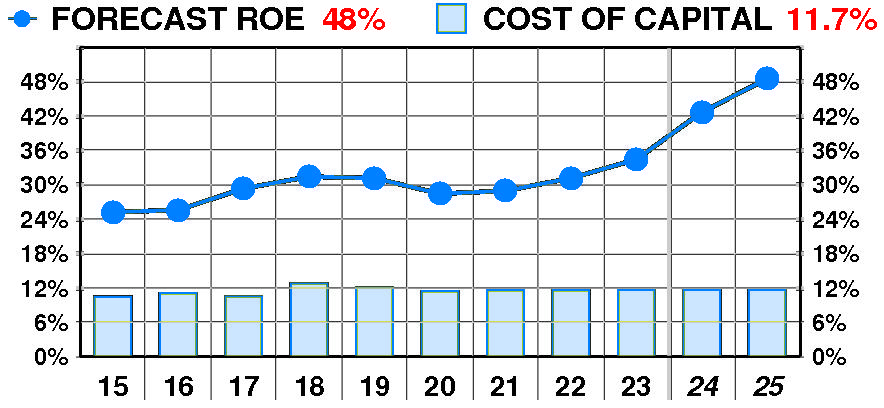
PTR's return on equity forecast is 48.5% — substantially above our recent forecasts.
Forecasted return on equity enjoyed a dramatic, variable increase between 2015 and 2023. The current forecast is significantly above the 2015 low of 25%.
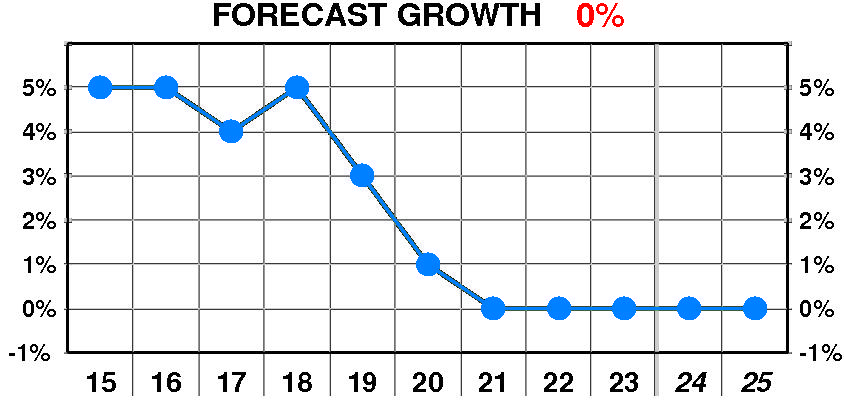
PTR's growth forecast is 0.0% — in line with our recent forecasts.
Forecasted growth suffered a dramatic, variable decline between 2015 and 2023. The current forecast is well below the 2018 peak of 5%.
PTR's cost of equity forecast is 11.7% — in line with recent levels.
Forecasted cost of equity exhibited a modest, erratic increase between 2015 and 2023. The current forecast is steady at the 2015 low of 10.5%.
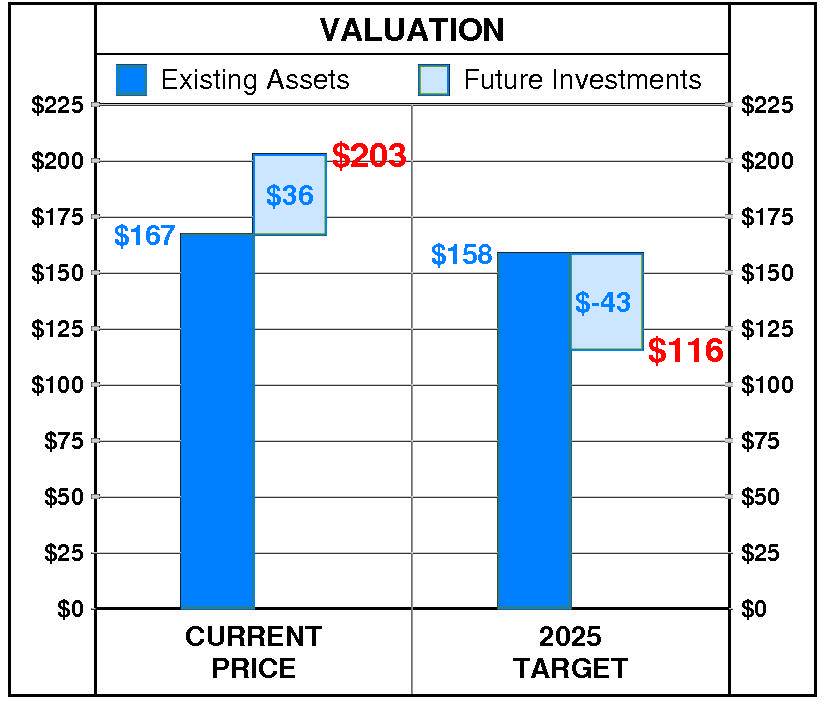
At Honeywell International's current price of $202.61, investors are placing a positive value of $36 on its future investments. This view is consistent with the company's most recent performance that reflected a growth rate of 0.0% per year, and a return on equity of 34.4% versus a cost of equity of 11.7%.
PTR's 2025 Price Target of $116 is based on these forecasts and reflects an estimated value of existing assets of $158 and a value of future investments of $-43.