![]()
BUSINESS
Hancock Whitney Corporation operates as the financial holding company for Hancock Whitney Bank that provides traditional and online banking services to commercial, small business, and retail customers. It accepts various deposit products, including noninterest-bearing demand deposits, interest-bearing transaction accounts, savings accounts, money market deposit accounts, and time deposit accounts. The company also offers loans products comprising commercial and industrial loans; commercial real estate loans; construction and land development loans; residential mortgages; consumer loans comprising second lien mortgage home loans, home equity lines of credit, and nonresidential consumer purpose loans; revolving credit facilities; and letters of credit and financial guarantees.
INVESTMENT RATING
HWC’s future returns on capital are forecasted to exceed the cost of capital. Accordingly, the company is expected to continue to be a Value Builder.
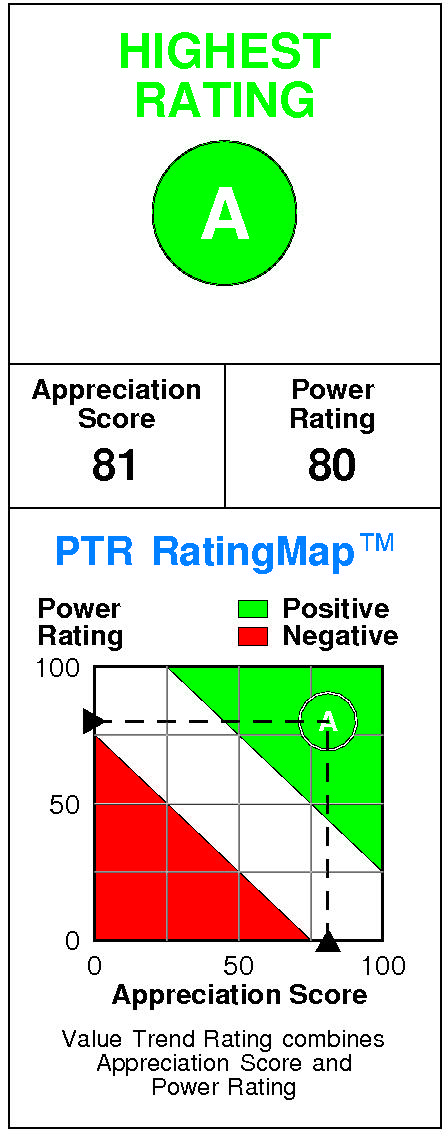
Hancock Whitney has a current Value Trend Rating of A (Highest Rating).
The Value Trend Rating reflects highly consistent signals from PTR’s two proprietary measures of a stock’s attractiveness. Hancock Whitney has a good Power Rating of 80 and a good Appreciation Score of 81, and the Highest Value Trend Rating results.
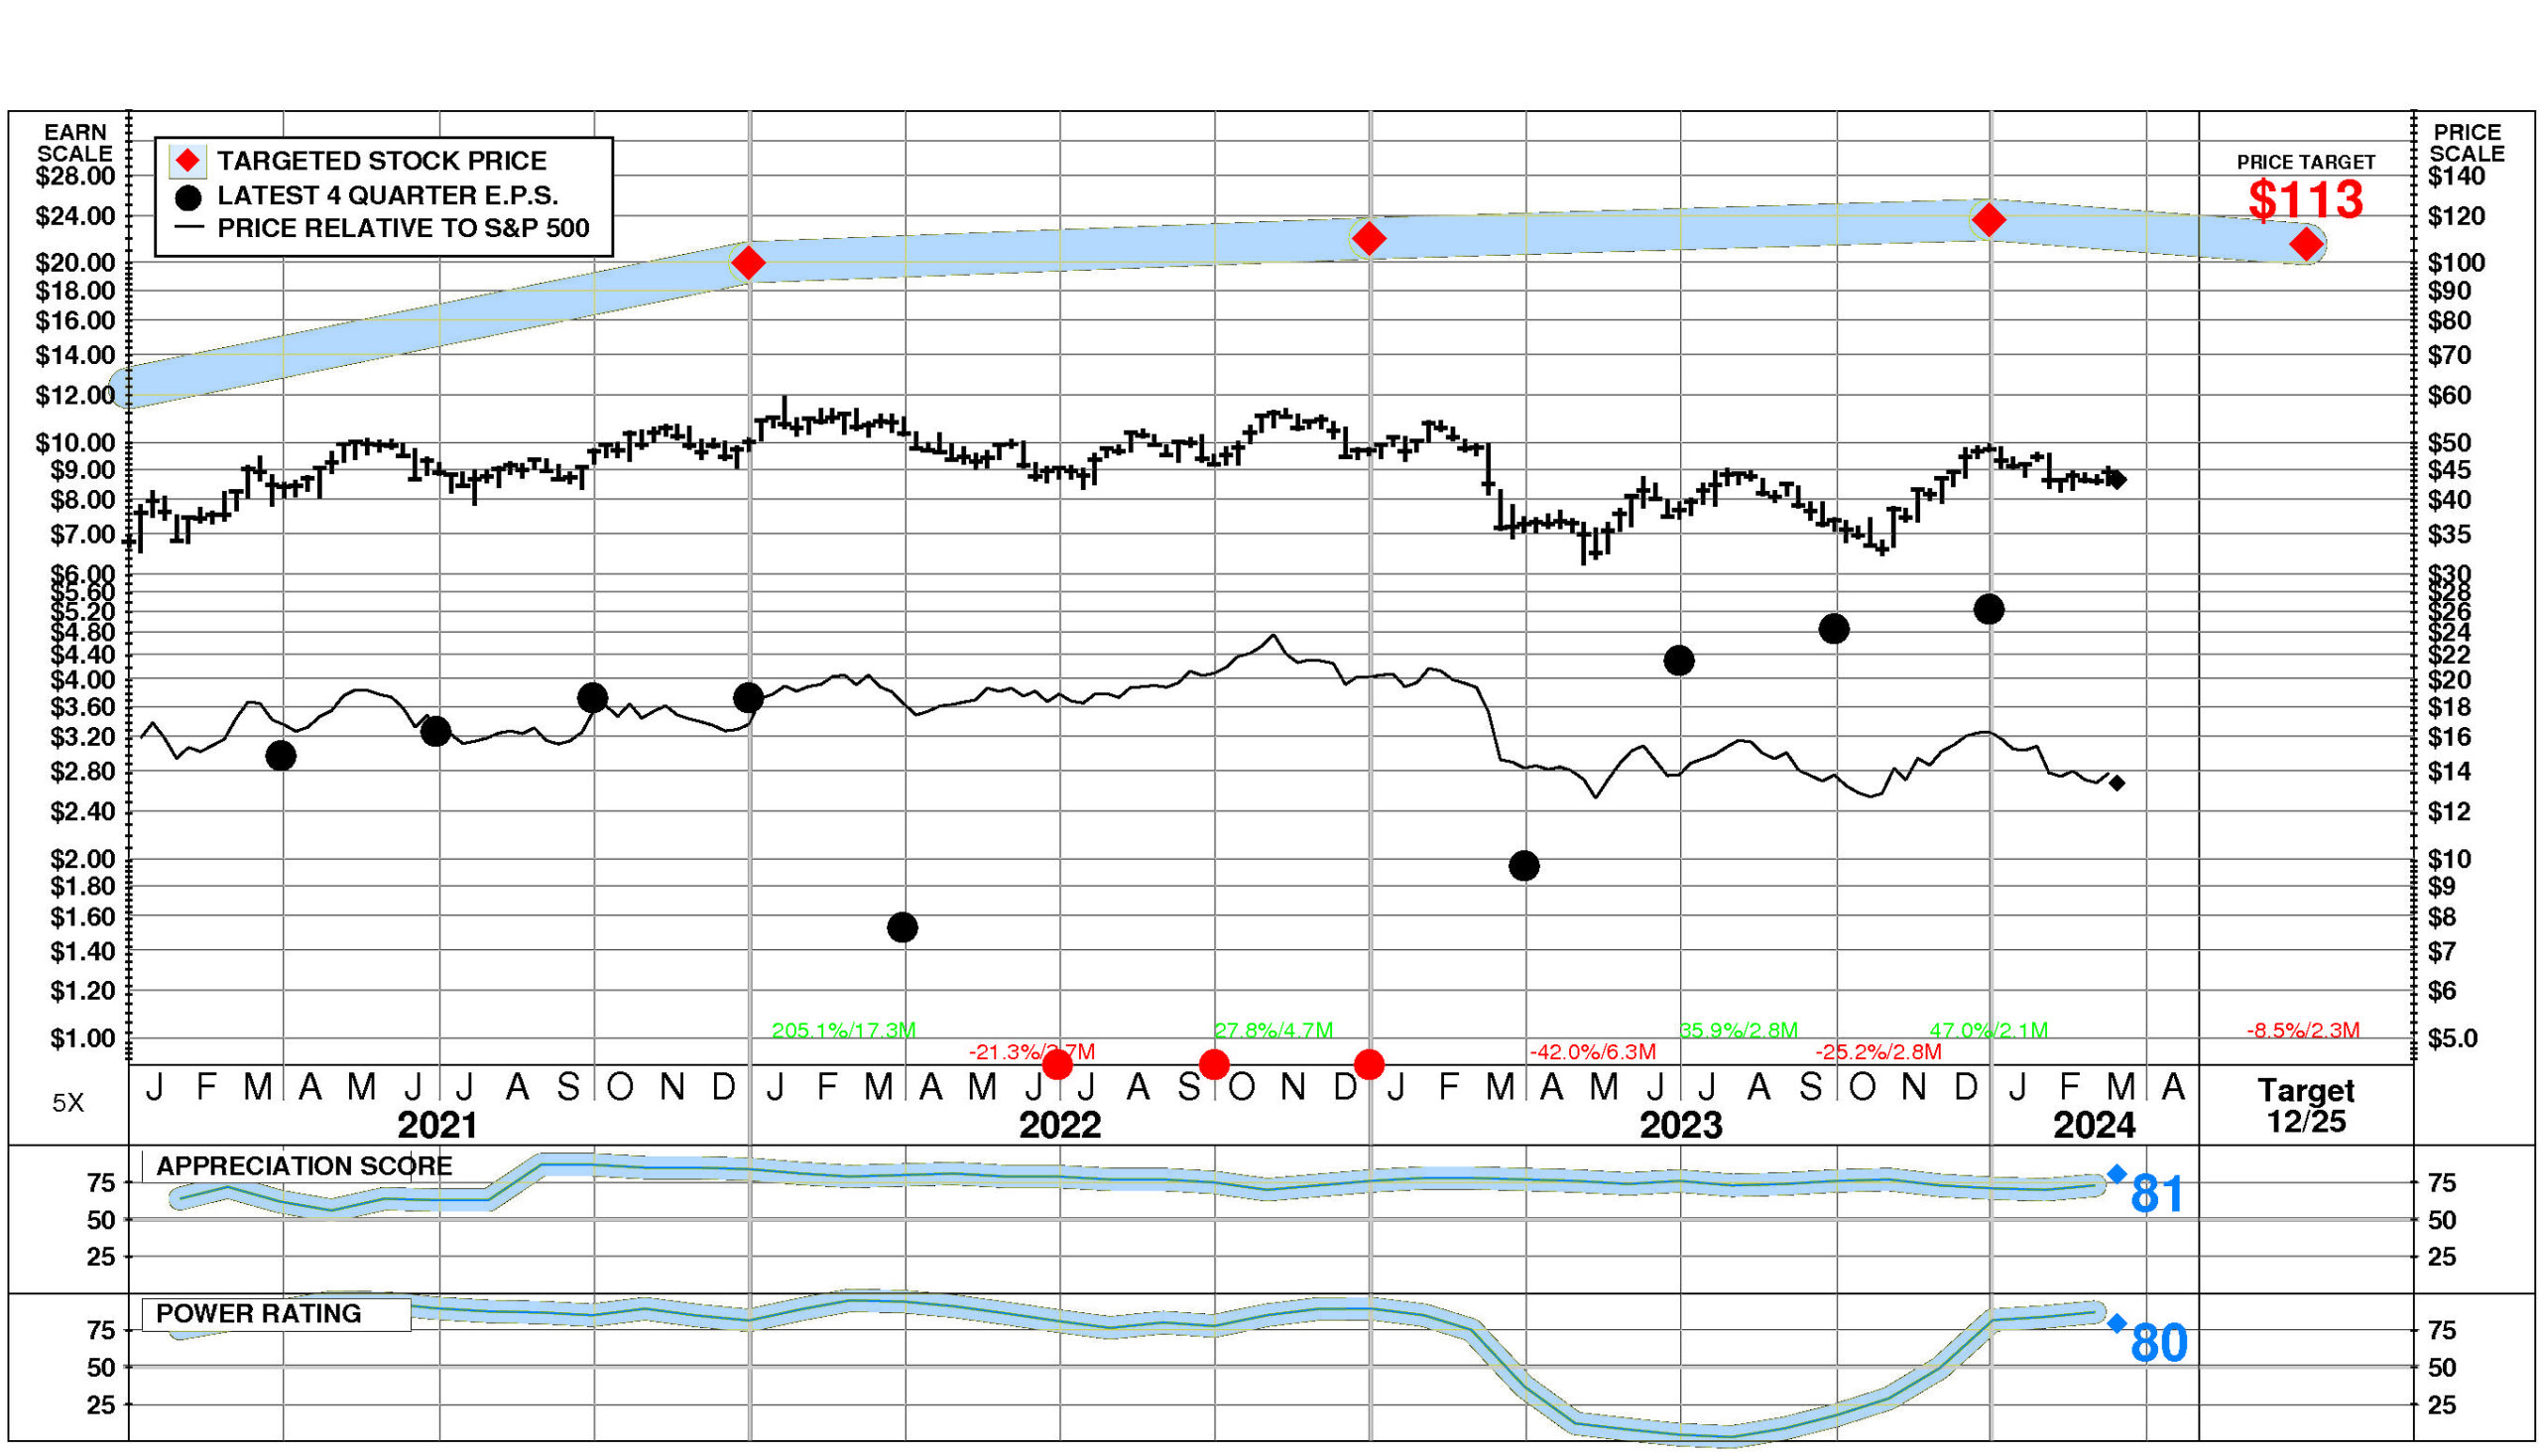
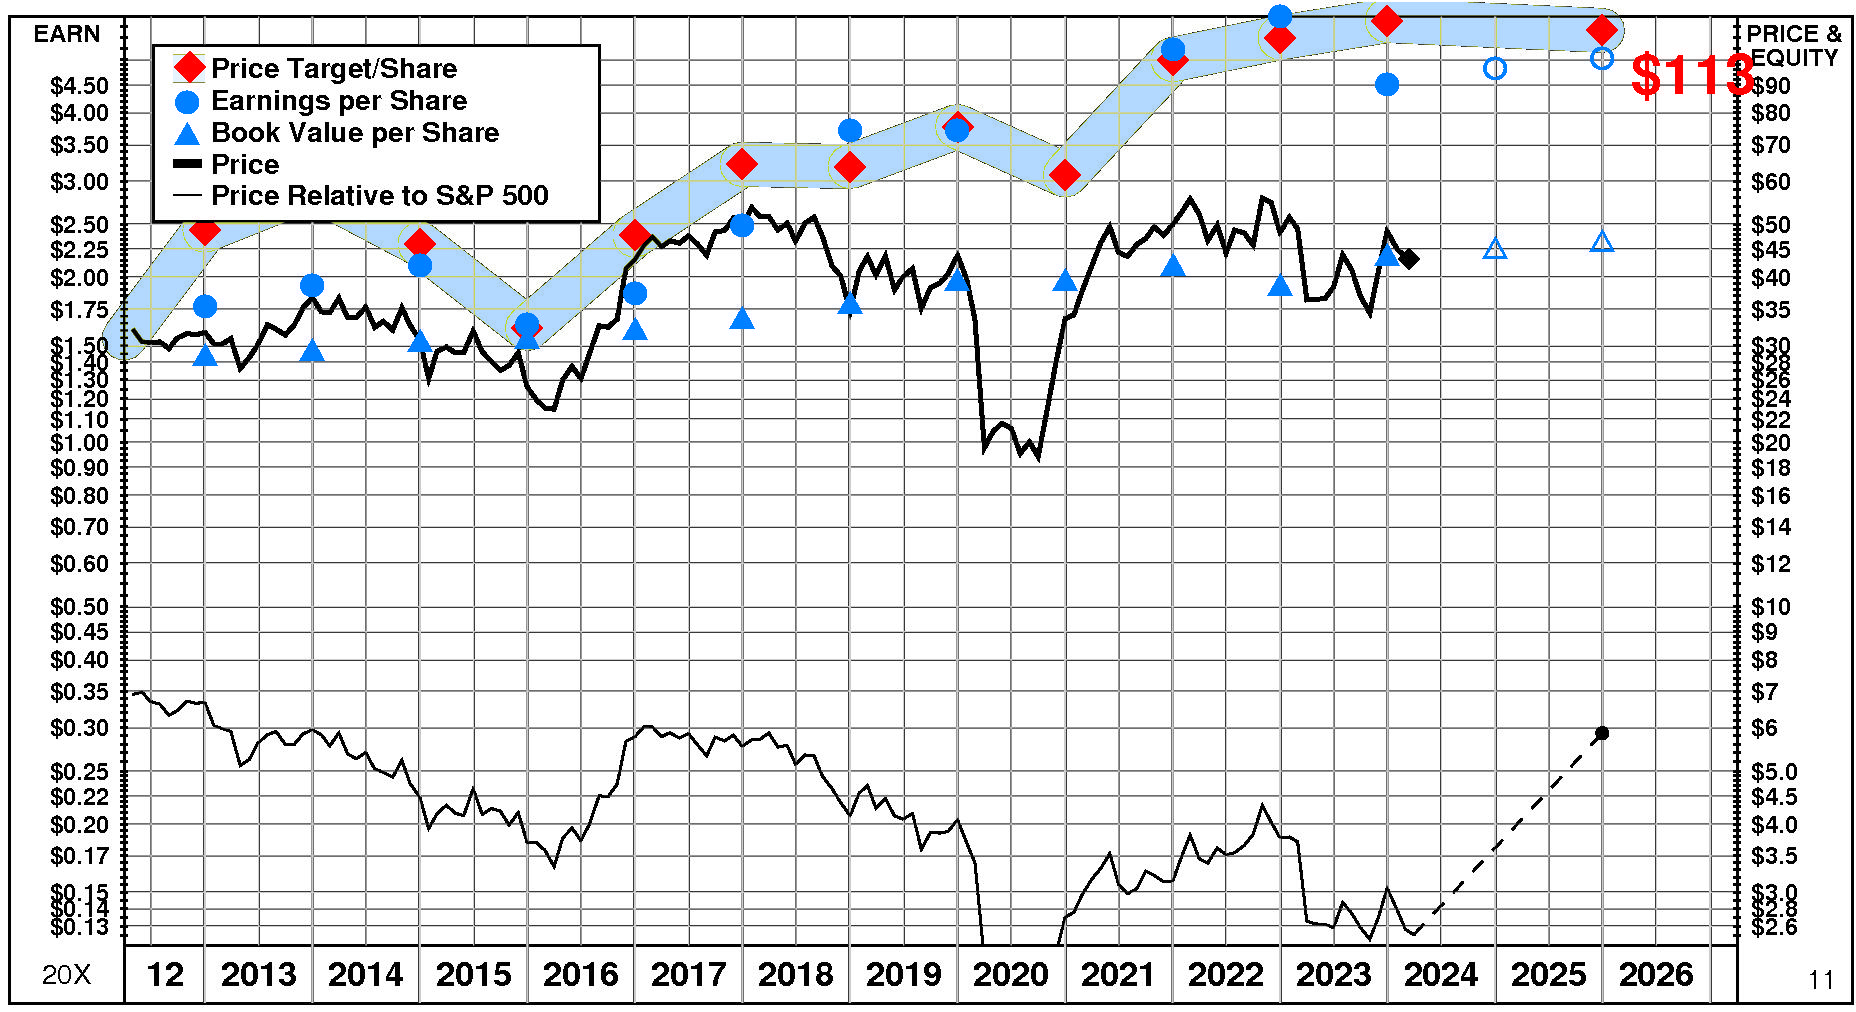
Hancock Whitney’s stock is selling well below targeted value. The current stock price of $43.23 compares to targeted value 12 months forward of $107.
Hancock Whitney’s high appreciation potential results in an appreciation score of 81 (only 19% of the universe has greater appreciation potential.)
Hancock Whitney has a Power Rating of 80. (HWC’s good Power Rating indicates that it has a higher likelihood of achieving favorable investment performance over the near to intermediate term than all but 20% of companies in the universe.)
Factors contributing to this good Power Rating include: the Commercial Banks comparison group is in a strong phase currently; recent price action has been favorable; and earnings estimate behavior for HWC has been slightly favorable recently.
INVESTMENT PROFILE
HWC’s financial strength is exceptional. Financial strength rating is 93.
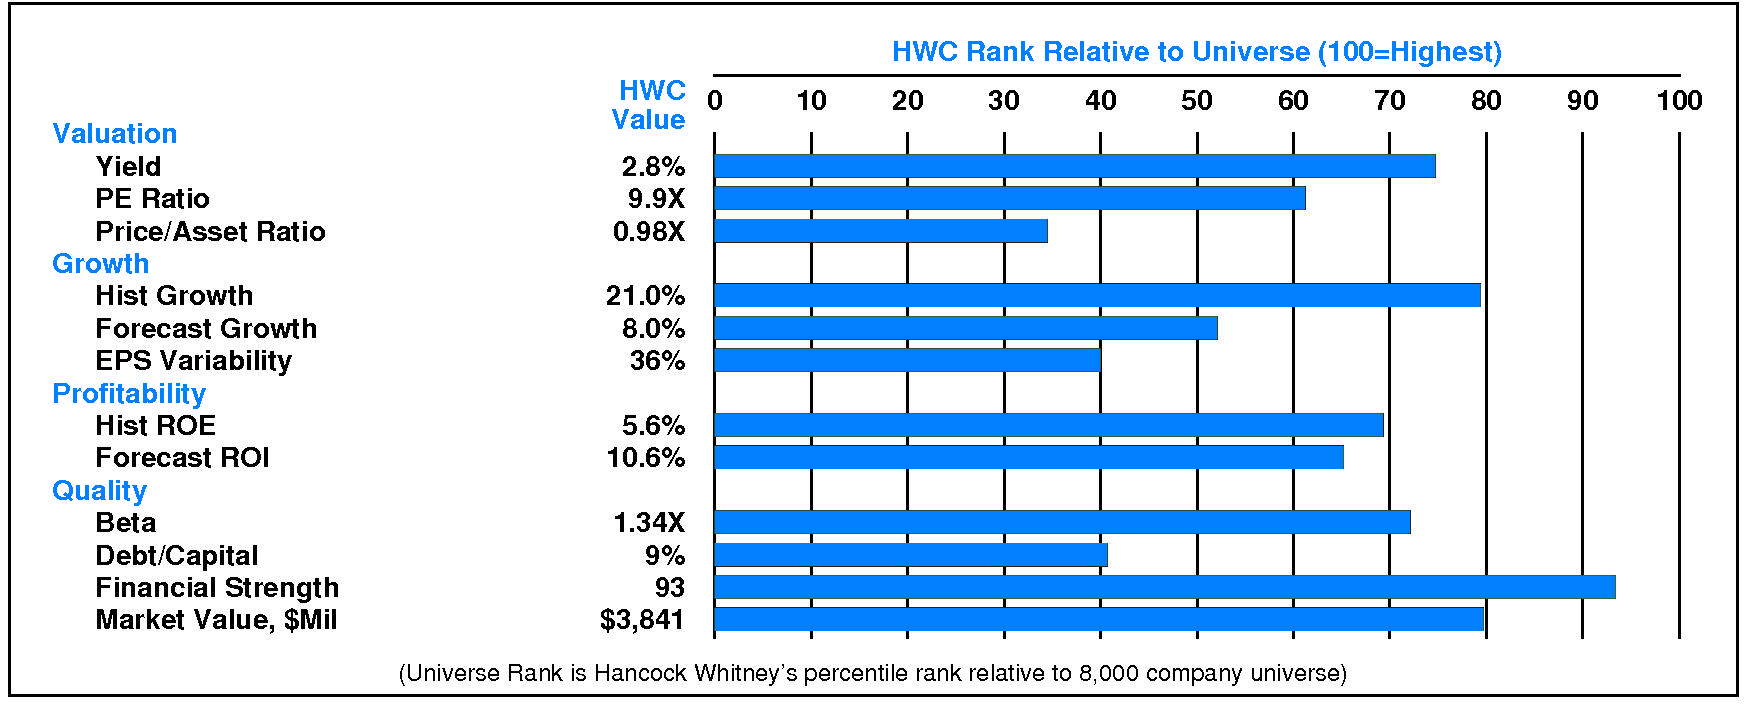
Relative to the S&P 500 Composite, Hancock Whitney Corp has moderate Value characteristics; its appeal is likely to be to investors heavily oriented toward Income; the perception is that HWC is lower risk. Low financial leverage is a positive for HWC. Relative weaknesses include: low forecasted profitability, low historical profitability, and high stock price volatility. HWC’s valuation is low: moderate dividend yield, low P/E ratio, and low price/book ratio. HWC has unusually low market capitalization.
CURRENT SIGNALS
Hancock Whitney’s current operations are eroding. Return on equity is falling, reflecting: declining pretax margin; falling tax keep rate; and falling leverage.
Hancock Whitney’s current technical position is very strong. The stock price is in a 2.1 month up move. The stock has appreciated 47.0% from its prior low. The stock price is above its 200 day moving average which is in an uptrend.
ALERTS
Significant negative changes in Hancock Whitney Corp (NASDAQ: HWC) investment behavior have recently occurred: negative upside/downside volume developed.
Significant positive changes in fundamentals have recently occurred for Hancock Whitney Corp (NASDAQ: HWC): significant quarterly earnings acceleration occurred, and significant quarterly sales acceleration occurred.
The stock is currently rated A.
Hancock Whitney Corp (NASDAQ: HWC) stock declined slightly by -0.6% on 3/13/24. The stock closed at $43.23. However, trading volume in this decline was unusually low at 61% of normal. The stock has been strong relative to the market over the last nine months but has declined -3.3% during the last week.
CASH FLOW
In 2023, Hancock Whitney generated a very significant increase in cash of +$299.8 million (+34%). Sources of cash were much larger than uses. Cash generated from 2023 EBITDA totaled +$779.6 million. Non-operating uses consumed -$243.2 million (-31% of EBITDA). Cash taxes consumed -$97.5 million (-13% of EBITDA). Withdrawal of investment from the business totaled +$505.5 million (+65% of EBITDA). On a net basis, debt investors removed -$713.0 million (-91% of EBITDA) while equity investors provided +$68.4 million (+9% of EBITDA).
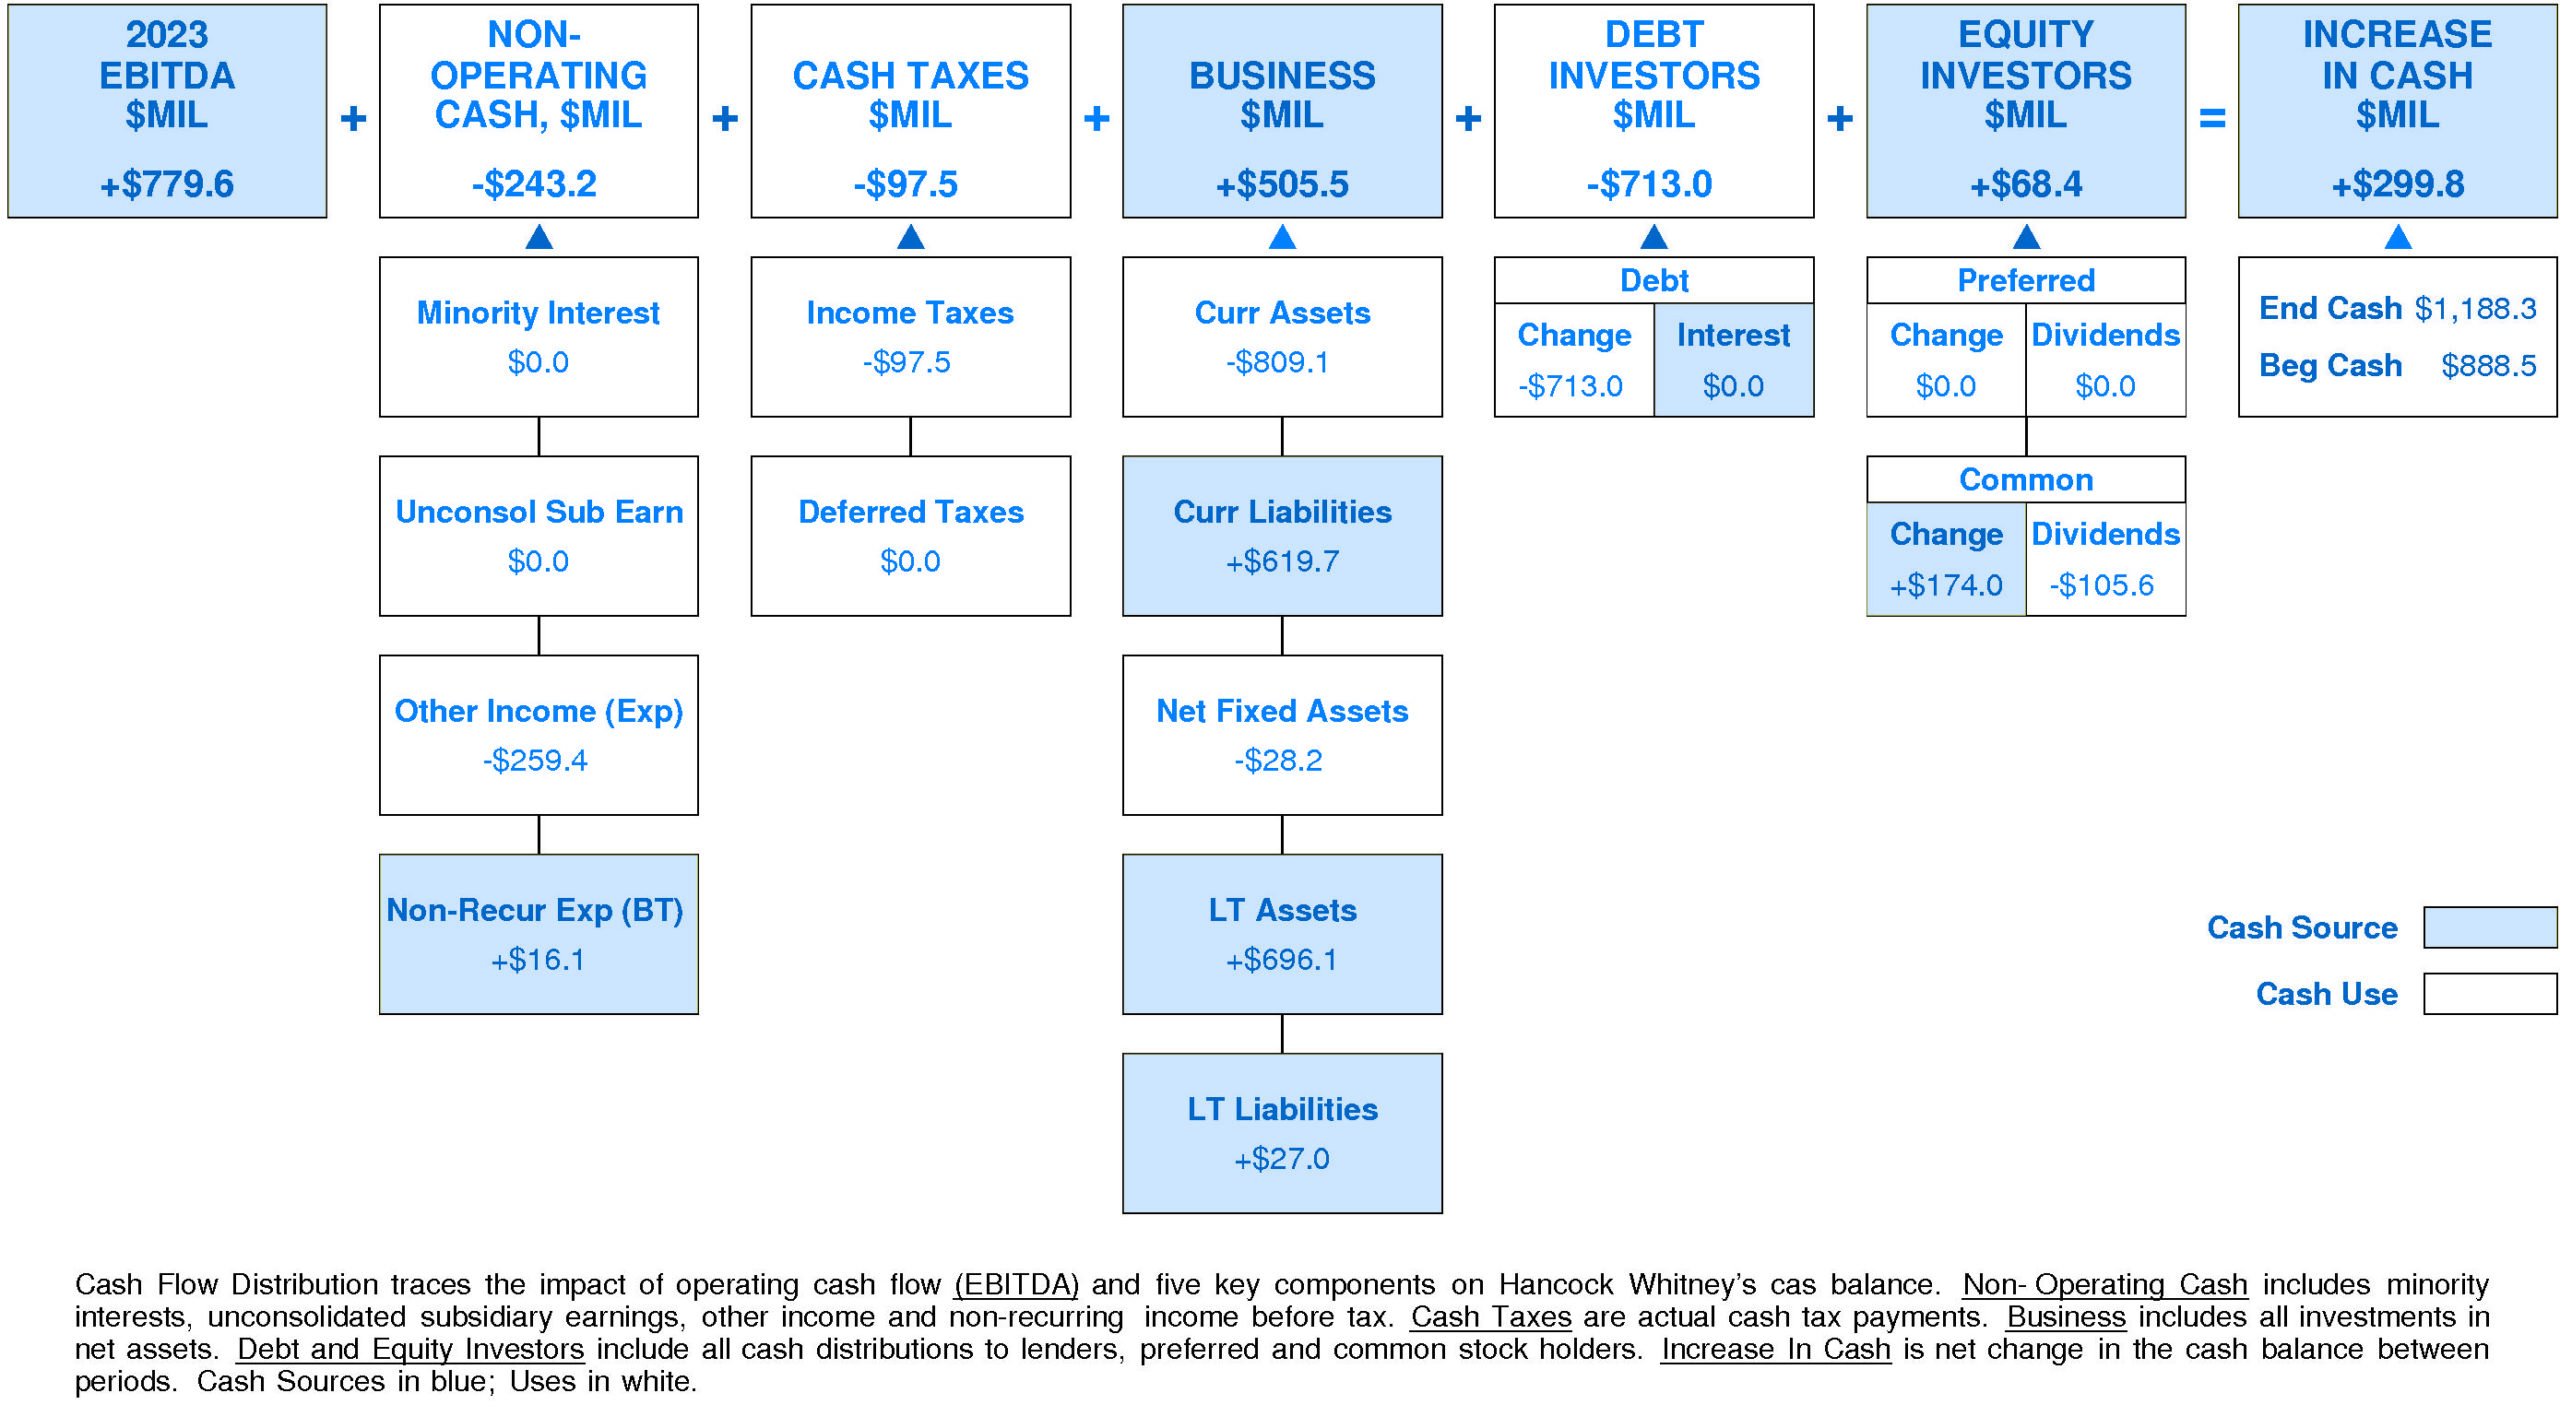
Hancock Whitney’s Non-operating Income, %EBITDA has experienced a downtrend over the period. This downtrend was accompanied by stability for the Hancock Whitney Peer Group. In most years, Hancock Whitney was in the lower quartile and top quartile. Currently, Hancock Whitney is at median at -31% of EBITDA (-$243.2 million).
Hancock Whitney’s Cash Taxes, %EBITDA has exhibited a volatile overall uptrend over the period. This improvement was accompanied by a similar trend for the Hancock Whitney Peer Group. In most years, Hancock Whitney was in the top quartile. Currently, Hancock Whitney is at the upper quartile at -13% of EBITDA (-$97.5 million).
Hancock Whitney’s Business Re-investment, %EBITDA has enjoyed a volatile overall uptrend over the period. This improvement was accompanied by a similar trend for the Hancock Whitney Peer Group. In most years, Hancock Whitney was in the top quartile and lower quartile. Currently, Hancock Whitney is at the upper quartile at +65% of EBITDA (+$505.5 million).
Hancock Whitney’s Debt Investors, %EBITDA has experienced a volatile overall downtrend over the period. This downtrend was accompanied by a similar trend for the Hancock Whitney Peer Group. In most years, Hancock Whitney was in the top quartile and lower quartile. Currently, Hancock Whitney is substantially below median at -91% of EBITDA (-$713.0 million).
Hancock Whitney’s Equity Investors, %EBITDA has experienced a downtrend over the period. This downtrend was accompanied by a similar trend for the Hancock Whitney Peer Group. In most years, Hancock Whitney was in the top quartile and third quartile. Currently, Hancock Whitney is upper quartile at +9% of EBITDA (+$68.4 million).
Hancock Whitney’s Change in Cash, %EBITDA has experienced a volatile overall uptrend over the period. This improvement was accompanied by an opposite trend for the Hancock Whitney Peer Group. In most years, Hancock Whitney was in the top quartile and lower quartile. Currently, Hancock Whitney is substantially above median at +38% of EBITDA (+$299.8 million).
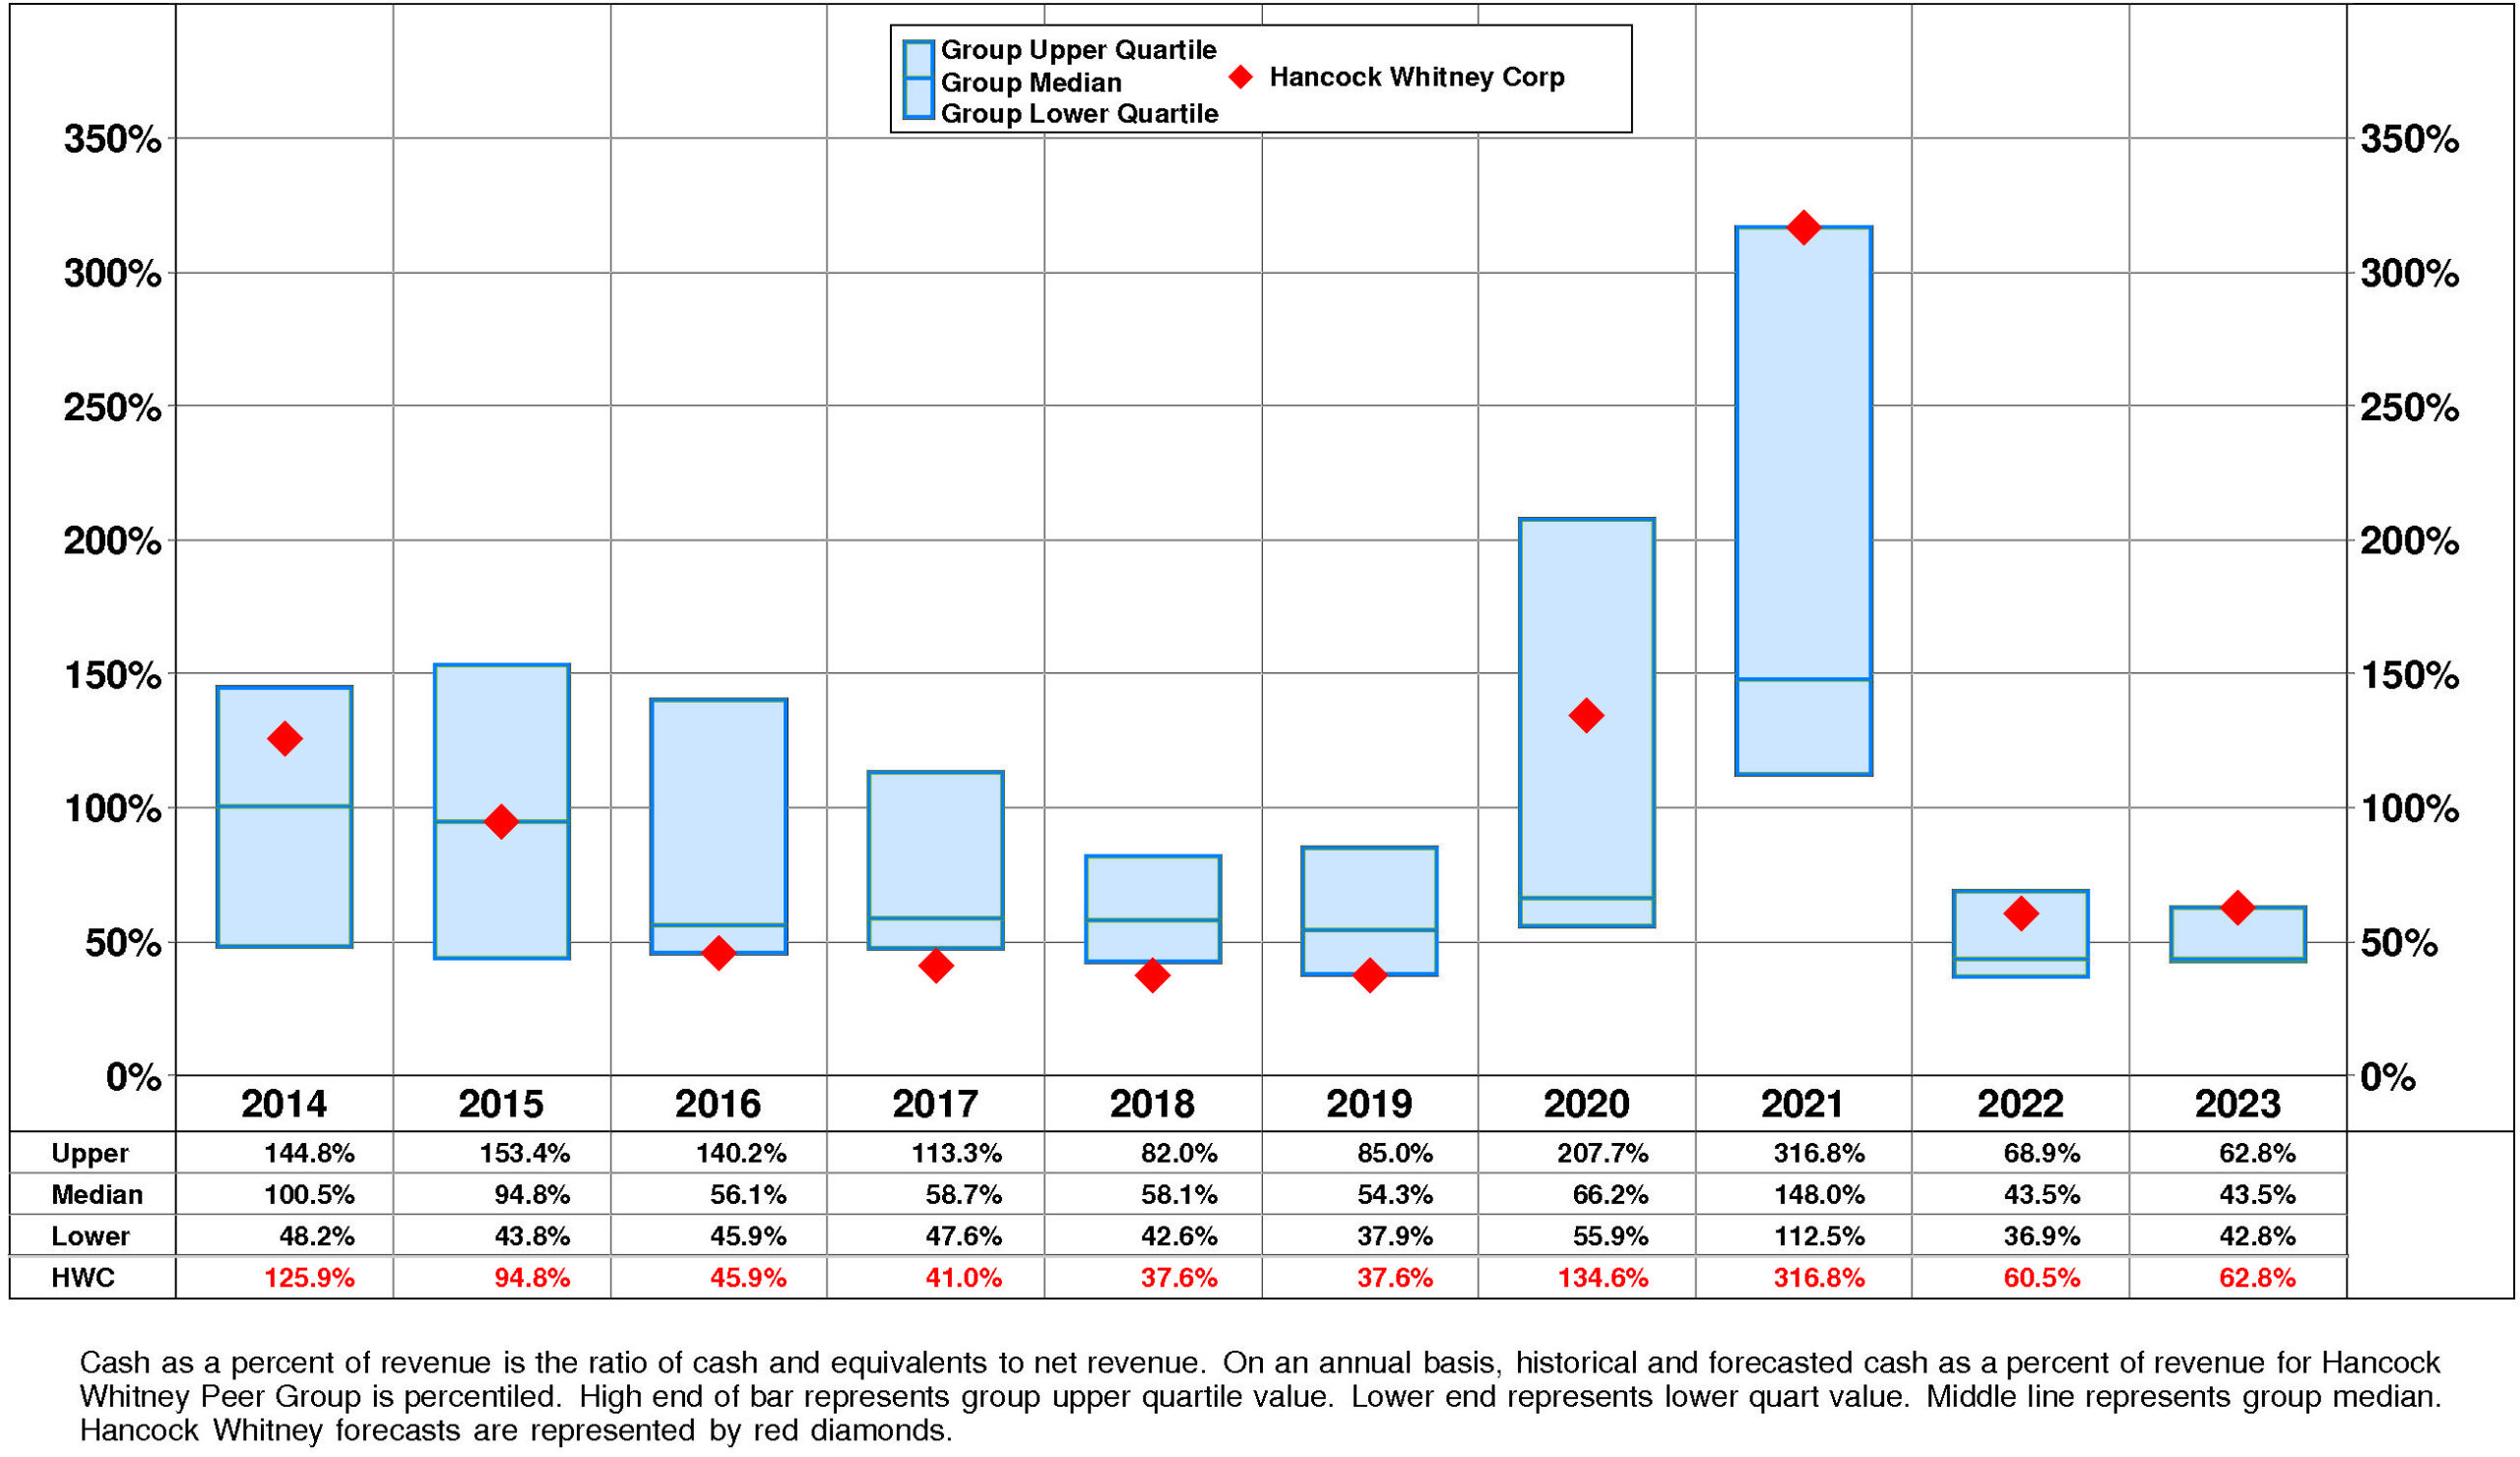
Hancock Whitney’s Cash, %Revenue has enjoyed a volatile overall uptrend over the period. This improvement was accompanied by an opposite trend for the Hancock Whitney Peer Group. (Since 2021 Cash, %Revenue has experienced a very sharp decline.) In most years, Hancock Whitney was in the second quartile and lower quartile. Currently, Hancock Whitney is at the upper quartile at +63%.
PROFITABILITY
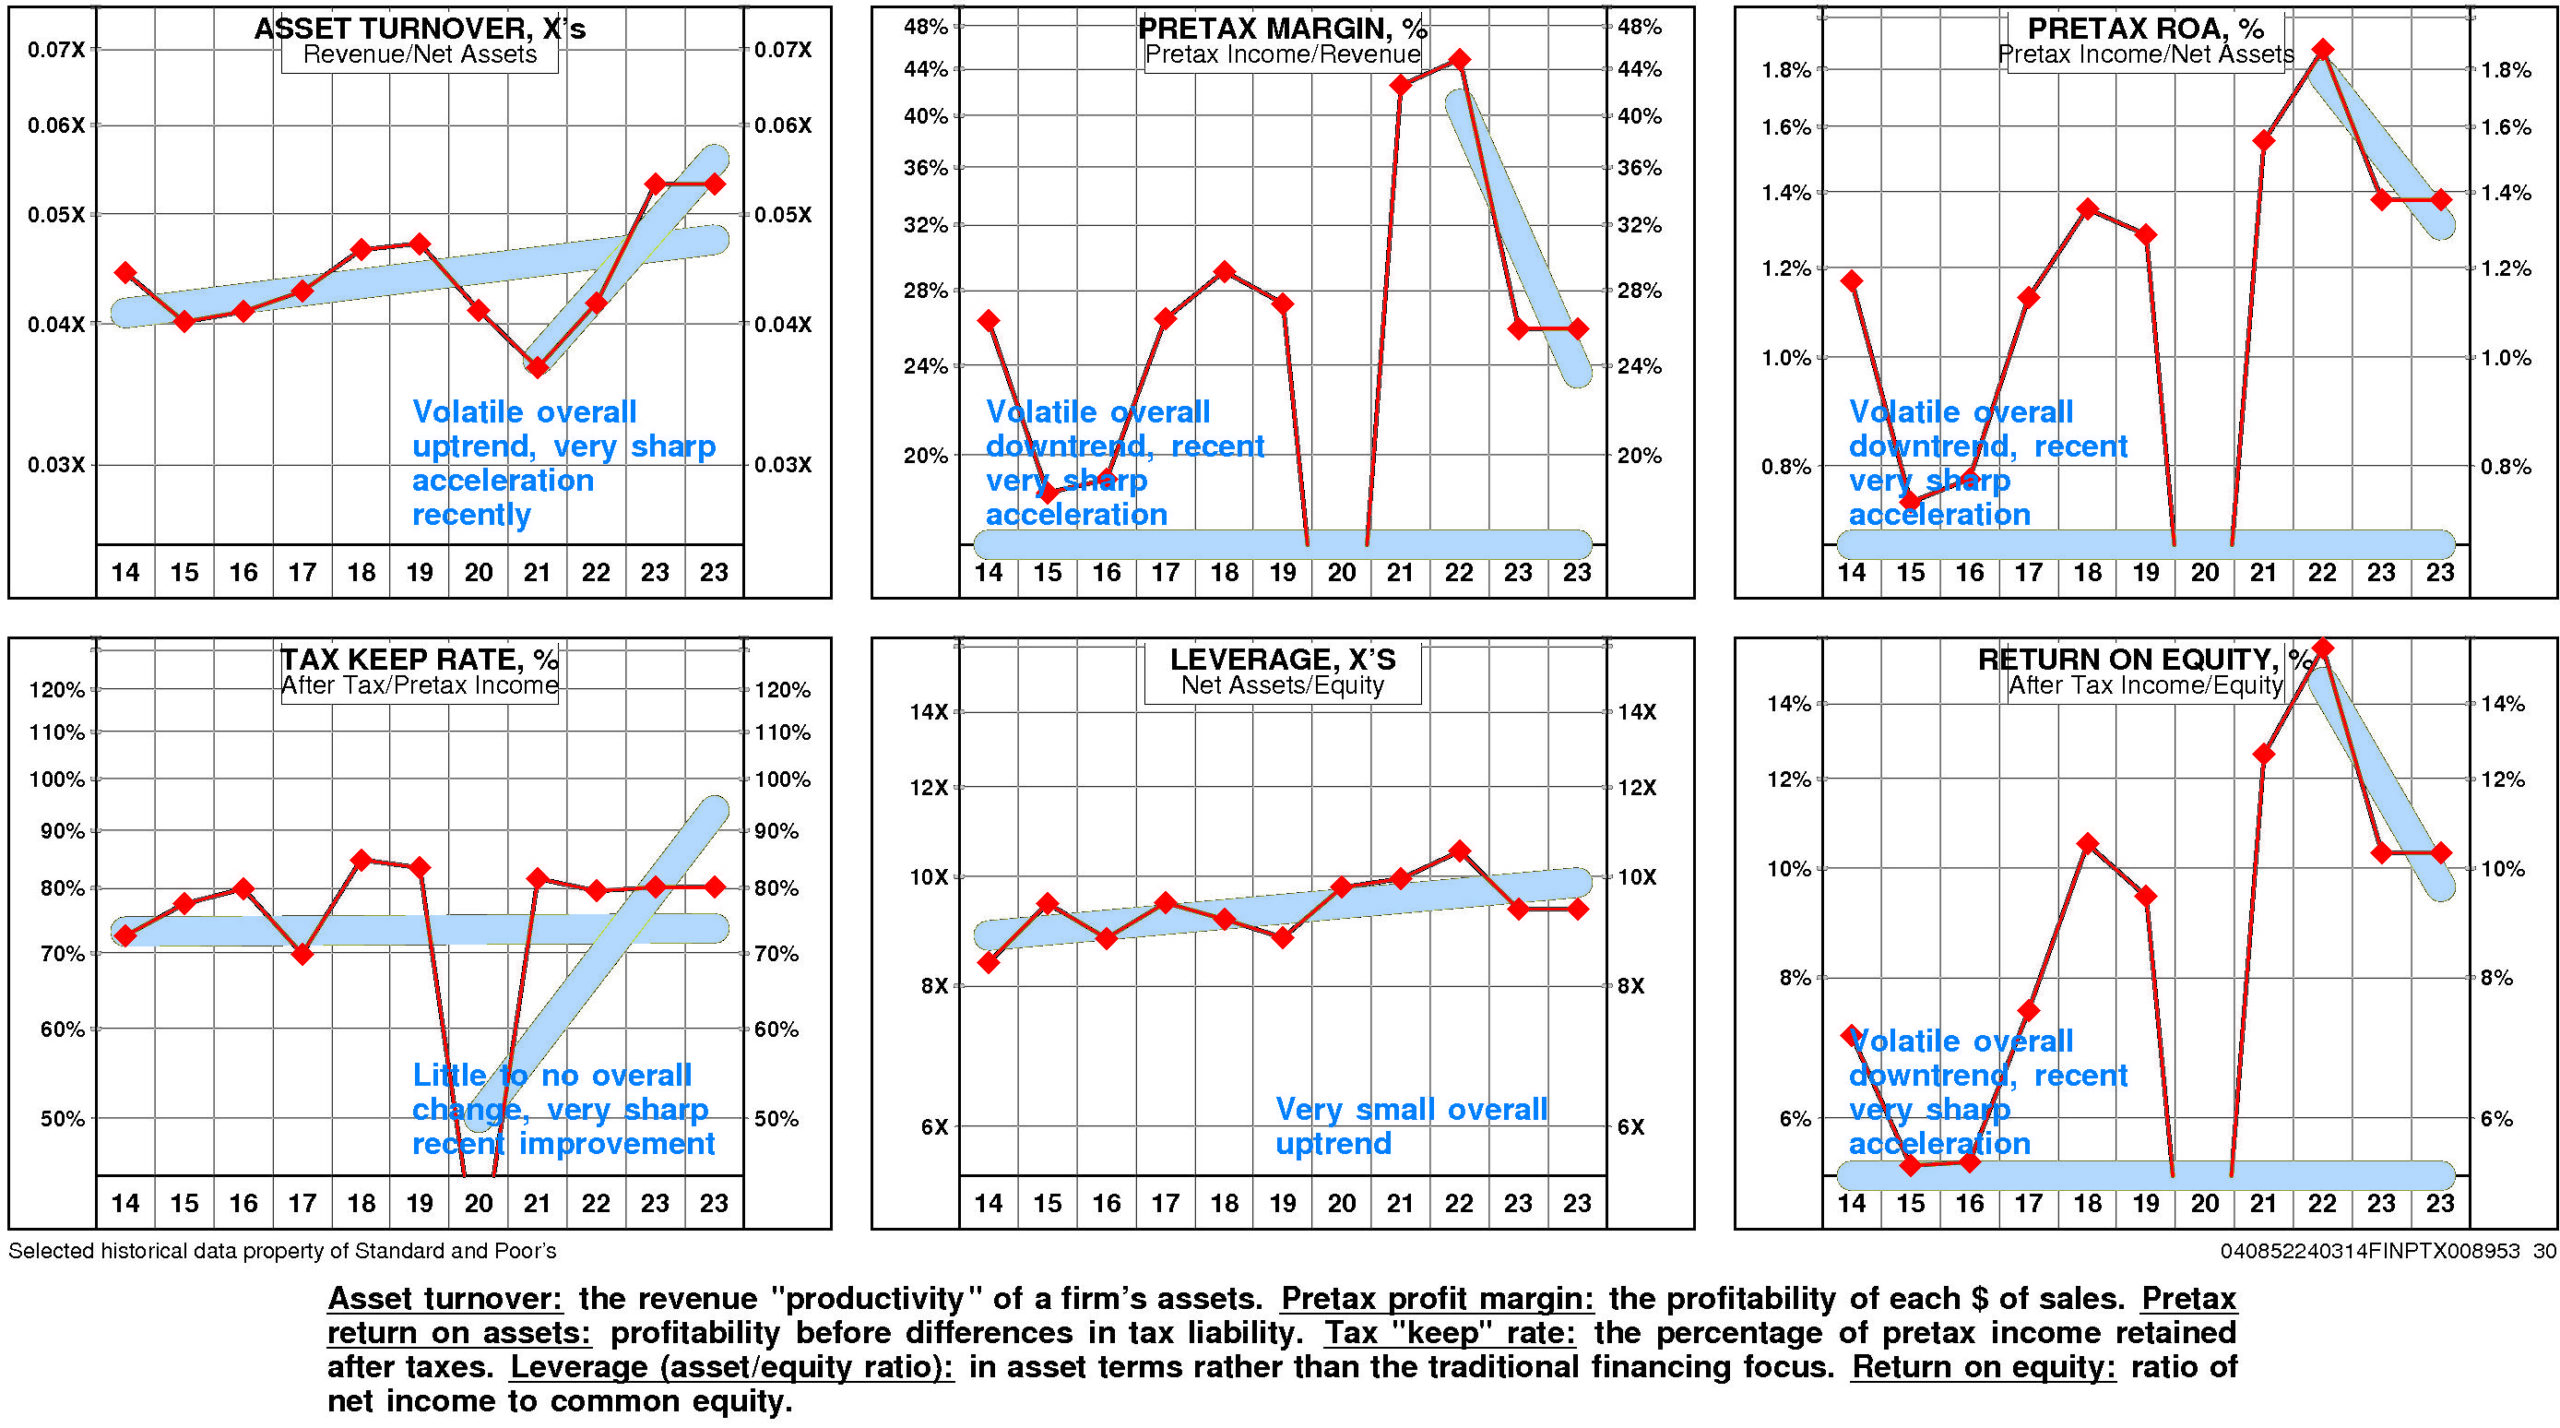
Hancock Whitney’s return on equity has eroded slightly since 2014. The current level of 10.3% is 1.45X the low for the period and is -1.8% from the high.
This slight erosion was due to small negative trend in pretax operating return and little change in non-operating factors.
The productivity of Hancock Whitney’s assets rose over the full period 2014-2023: asset turnover has exhibited a volatile overall uptrend that accelerated very sharply after the 2021 level.
More than offsetting this trend, however, pretax margin experienced a strong overall downtrend that accelerated very sharply from the 2022 level.
Non-operating factors (income taxes and financial leverage) had little influence on return on equity.
Hancock Whitney’s return on equity is at median (10.3%) for the four quarters ended December, 2023.
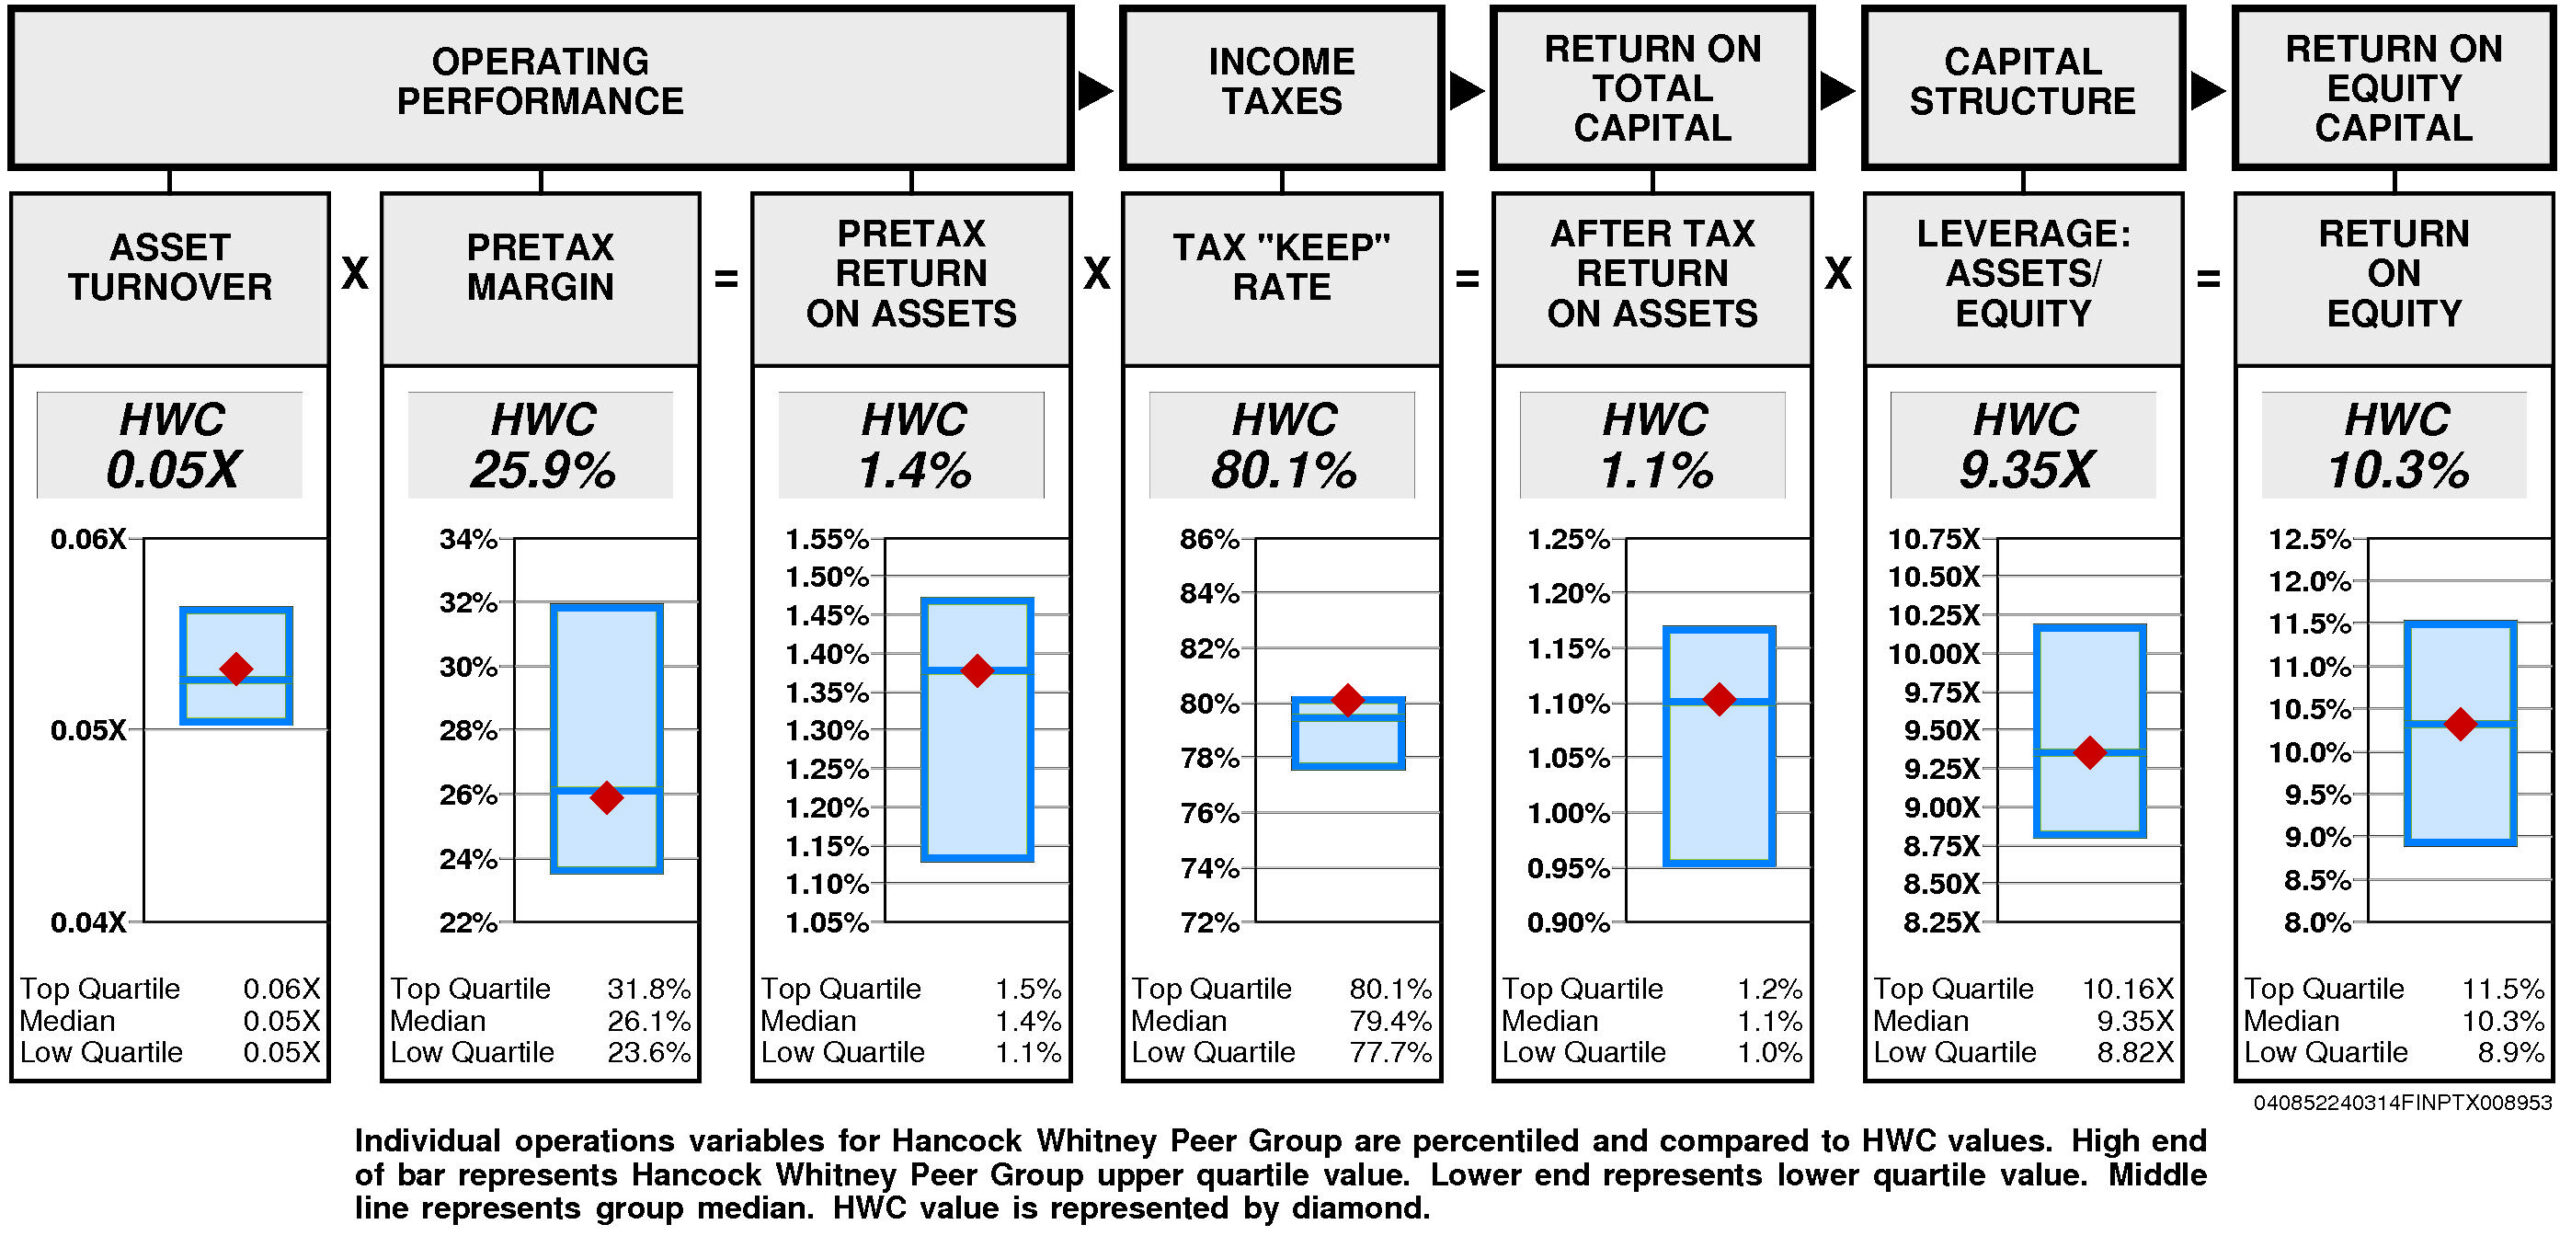
Operating performance (pretax return on assets) is at median (1.4%) reflecting asset turnover that is at median (0.05X) and at median pretax margin (25.9%).
Tax “keep” rate (income tax management) is at the upper quartile (80.1%) resulting in after tax return on assets that is at median.
Financial leverage (leverage) is at median (9.35X).
GROWTH RATES
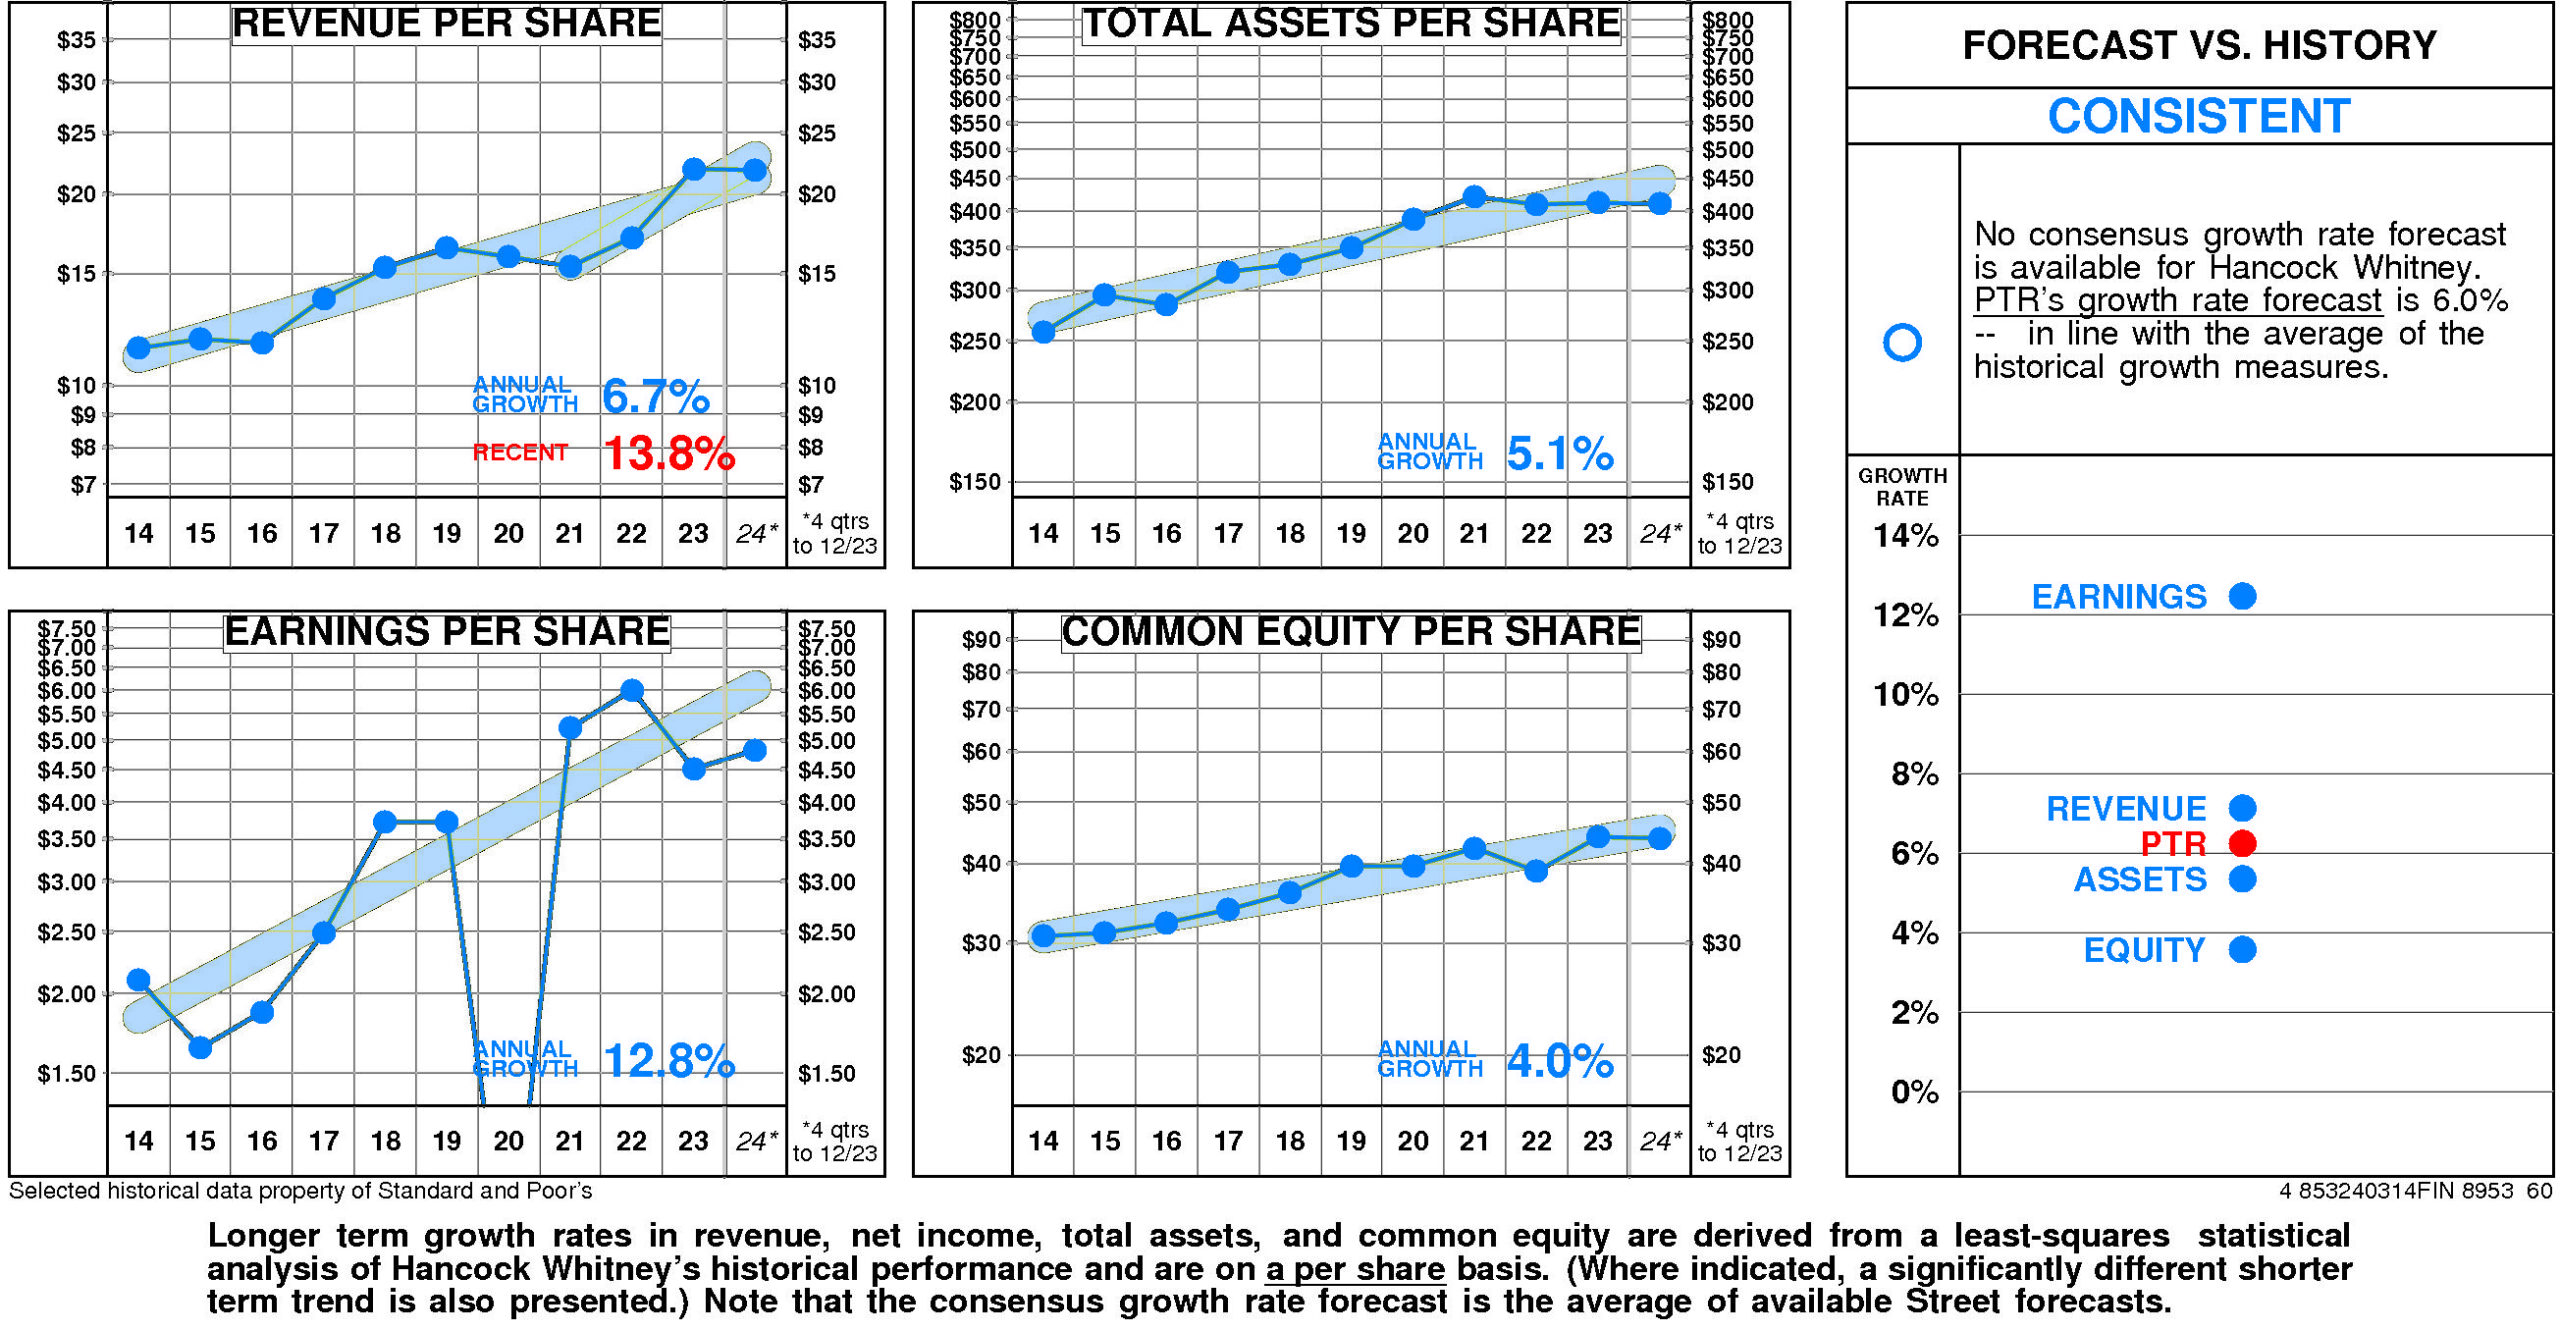
There are no significant differences between Hancock Whitney’s longer term growth and growth in recent years.
Hancock Whitney’s historical income statement growth and balance sheet growth have diverged. Revenue growth has paralleled asset growth; earnings growth has exceeded equity growth.
Annual revenue growth has been 6.7% per year. (More recently it has been 13.8%.)
Total asset growth has been 5.1% per year.
Annual E.P.S. growth has been 12.8% per year.
Equity growth has been 4.0% per year.
No consensus growth rate forecast is available for Hancock Whitney.
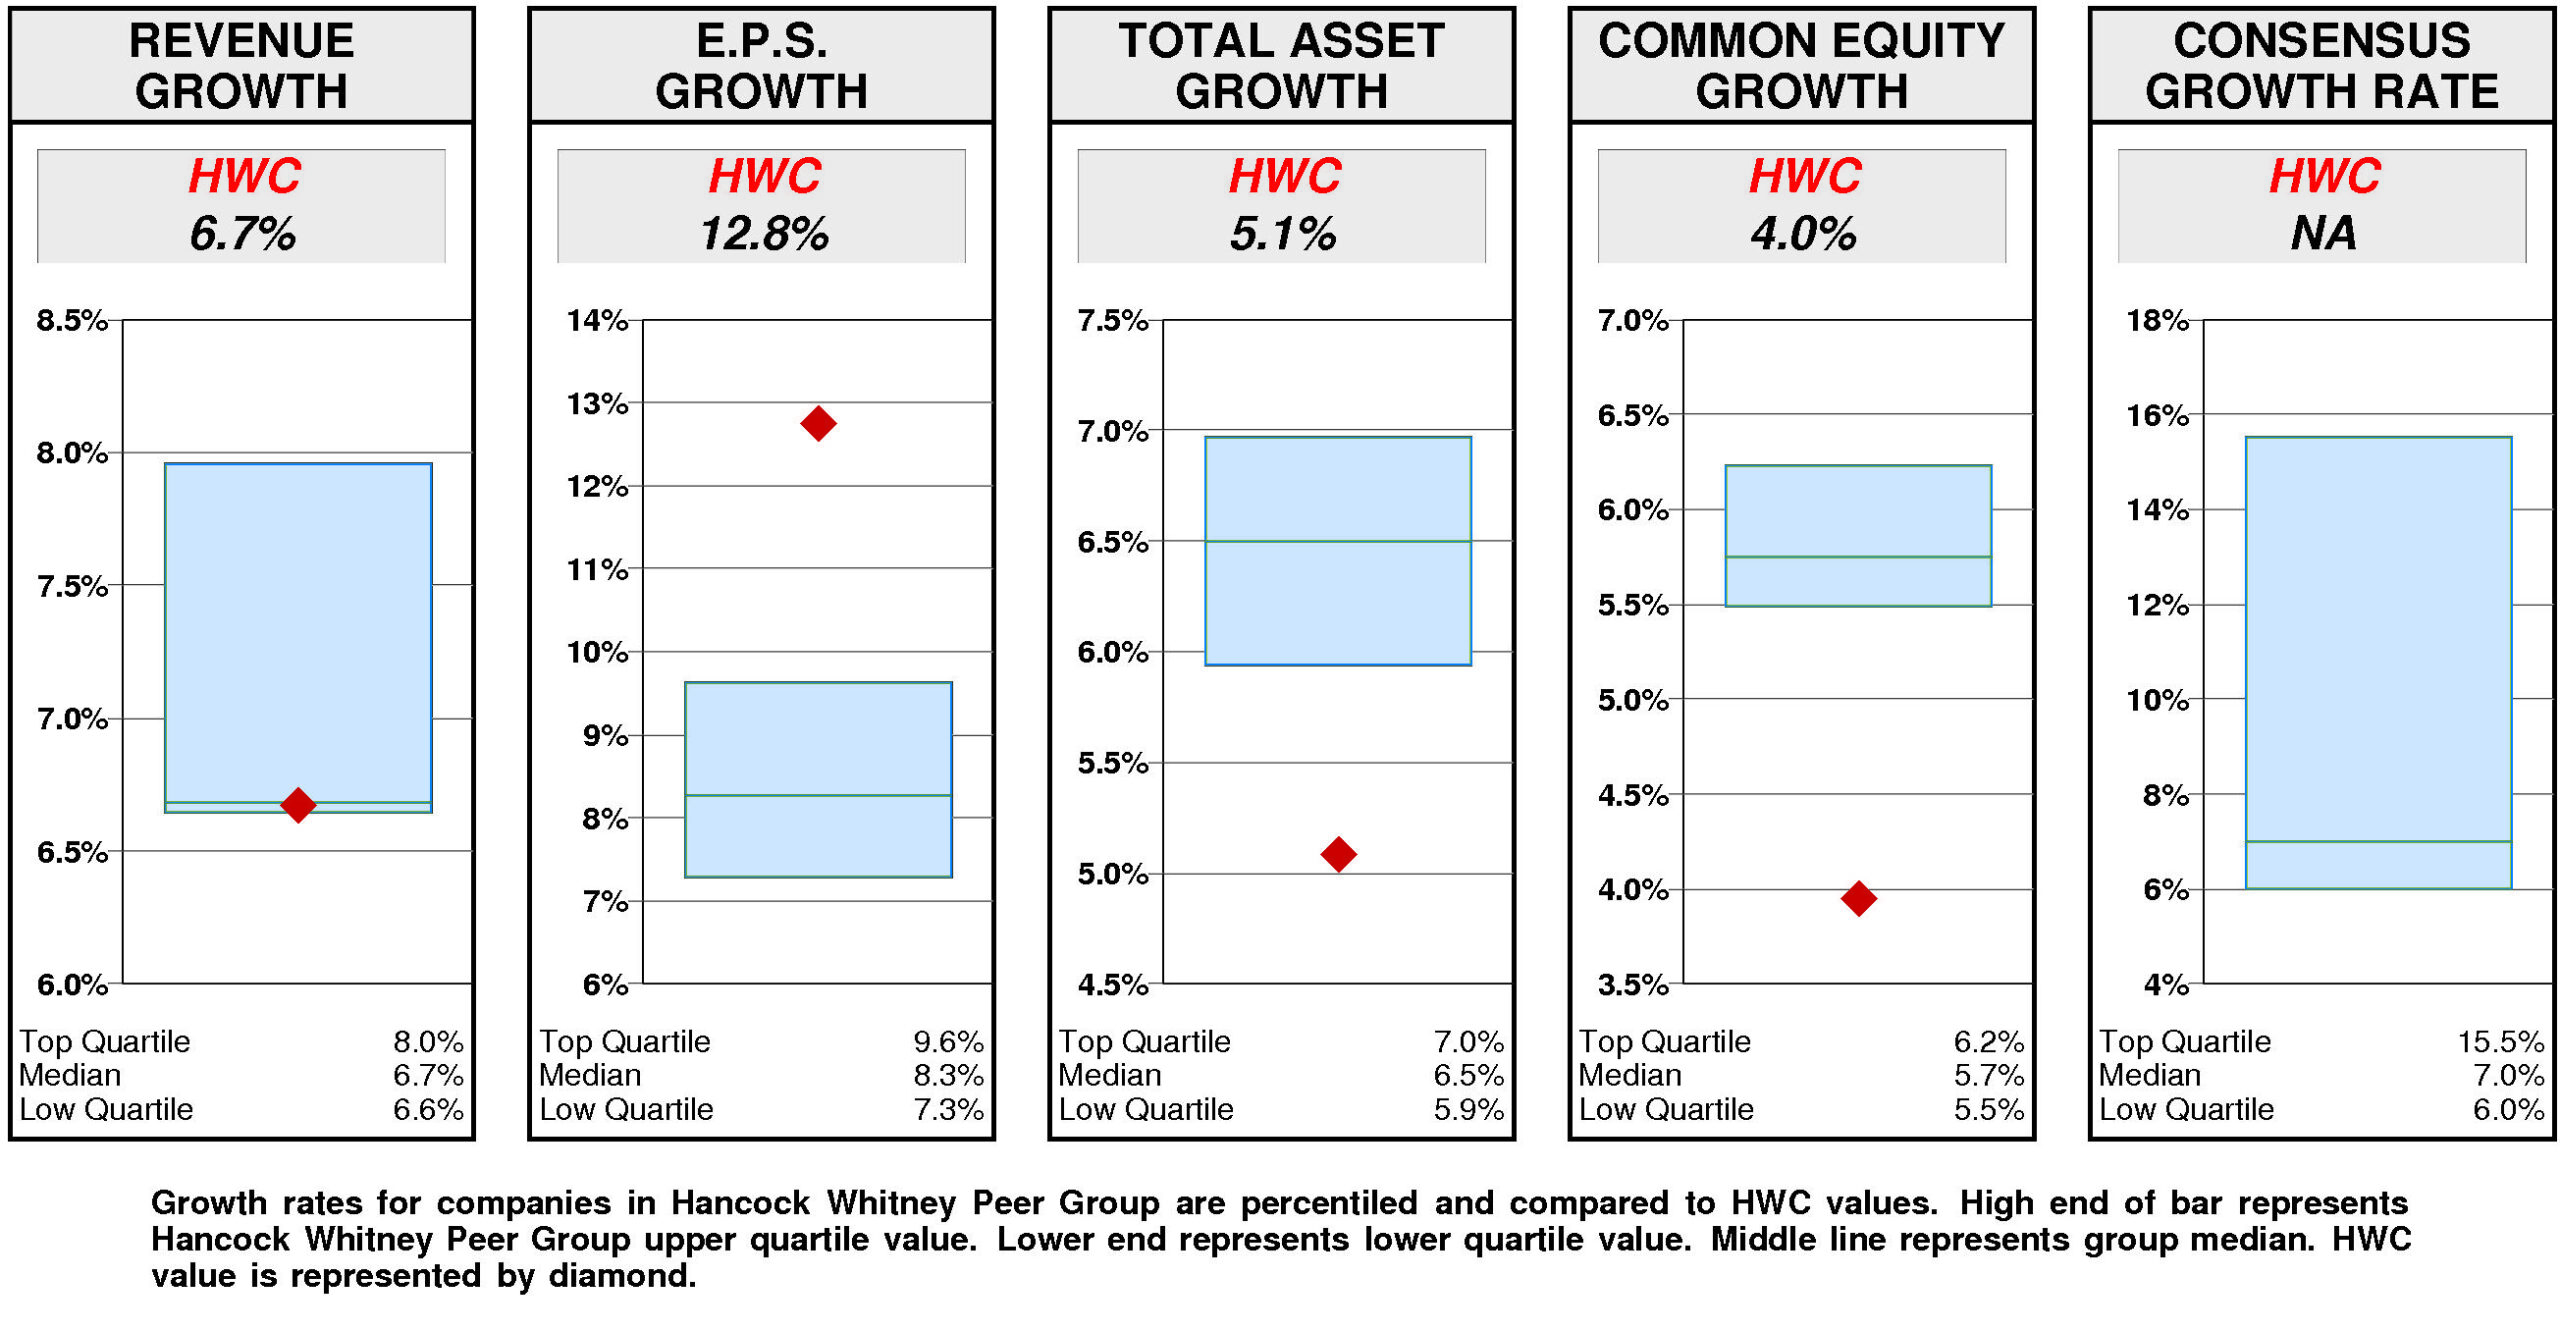
Relative to the Hancock Whitney Peer Group, Hancock Whitney’s historical growth measures are erratic. E.P.S. growth (12.8%) has been upper quartile. Revenue growth (6.7%) has been at median. Equity growth (4.0%) has been lower quartile. Total asset growth (5.1%) has been lower quartile.
Consensus growth forecast is unavailable.
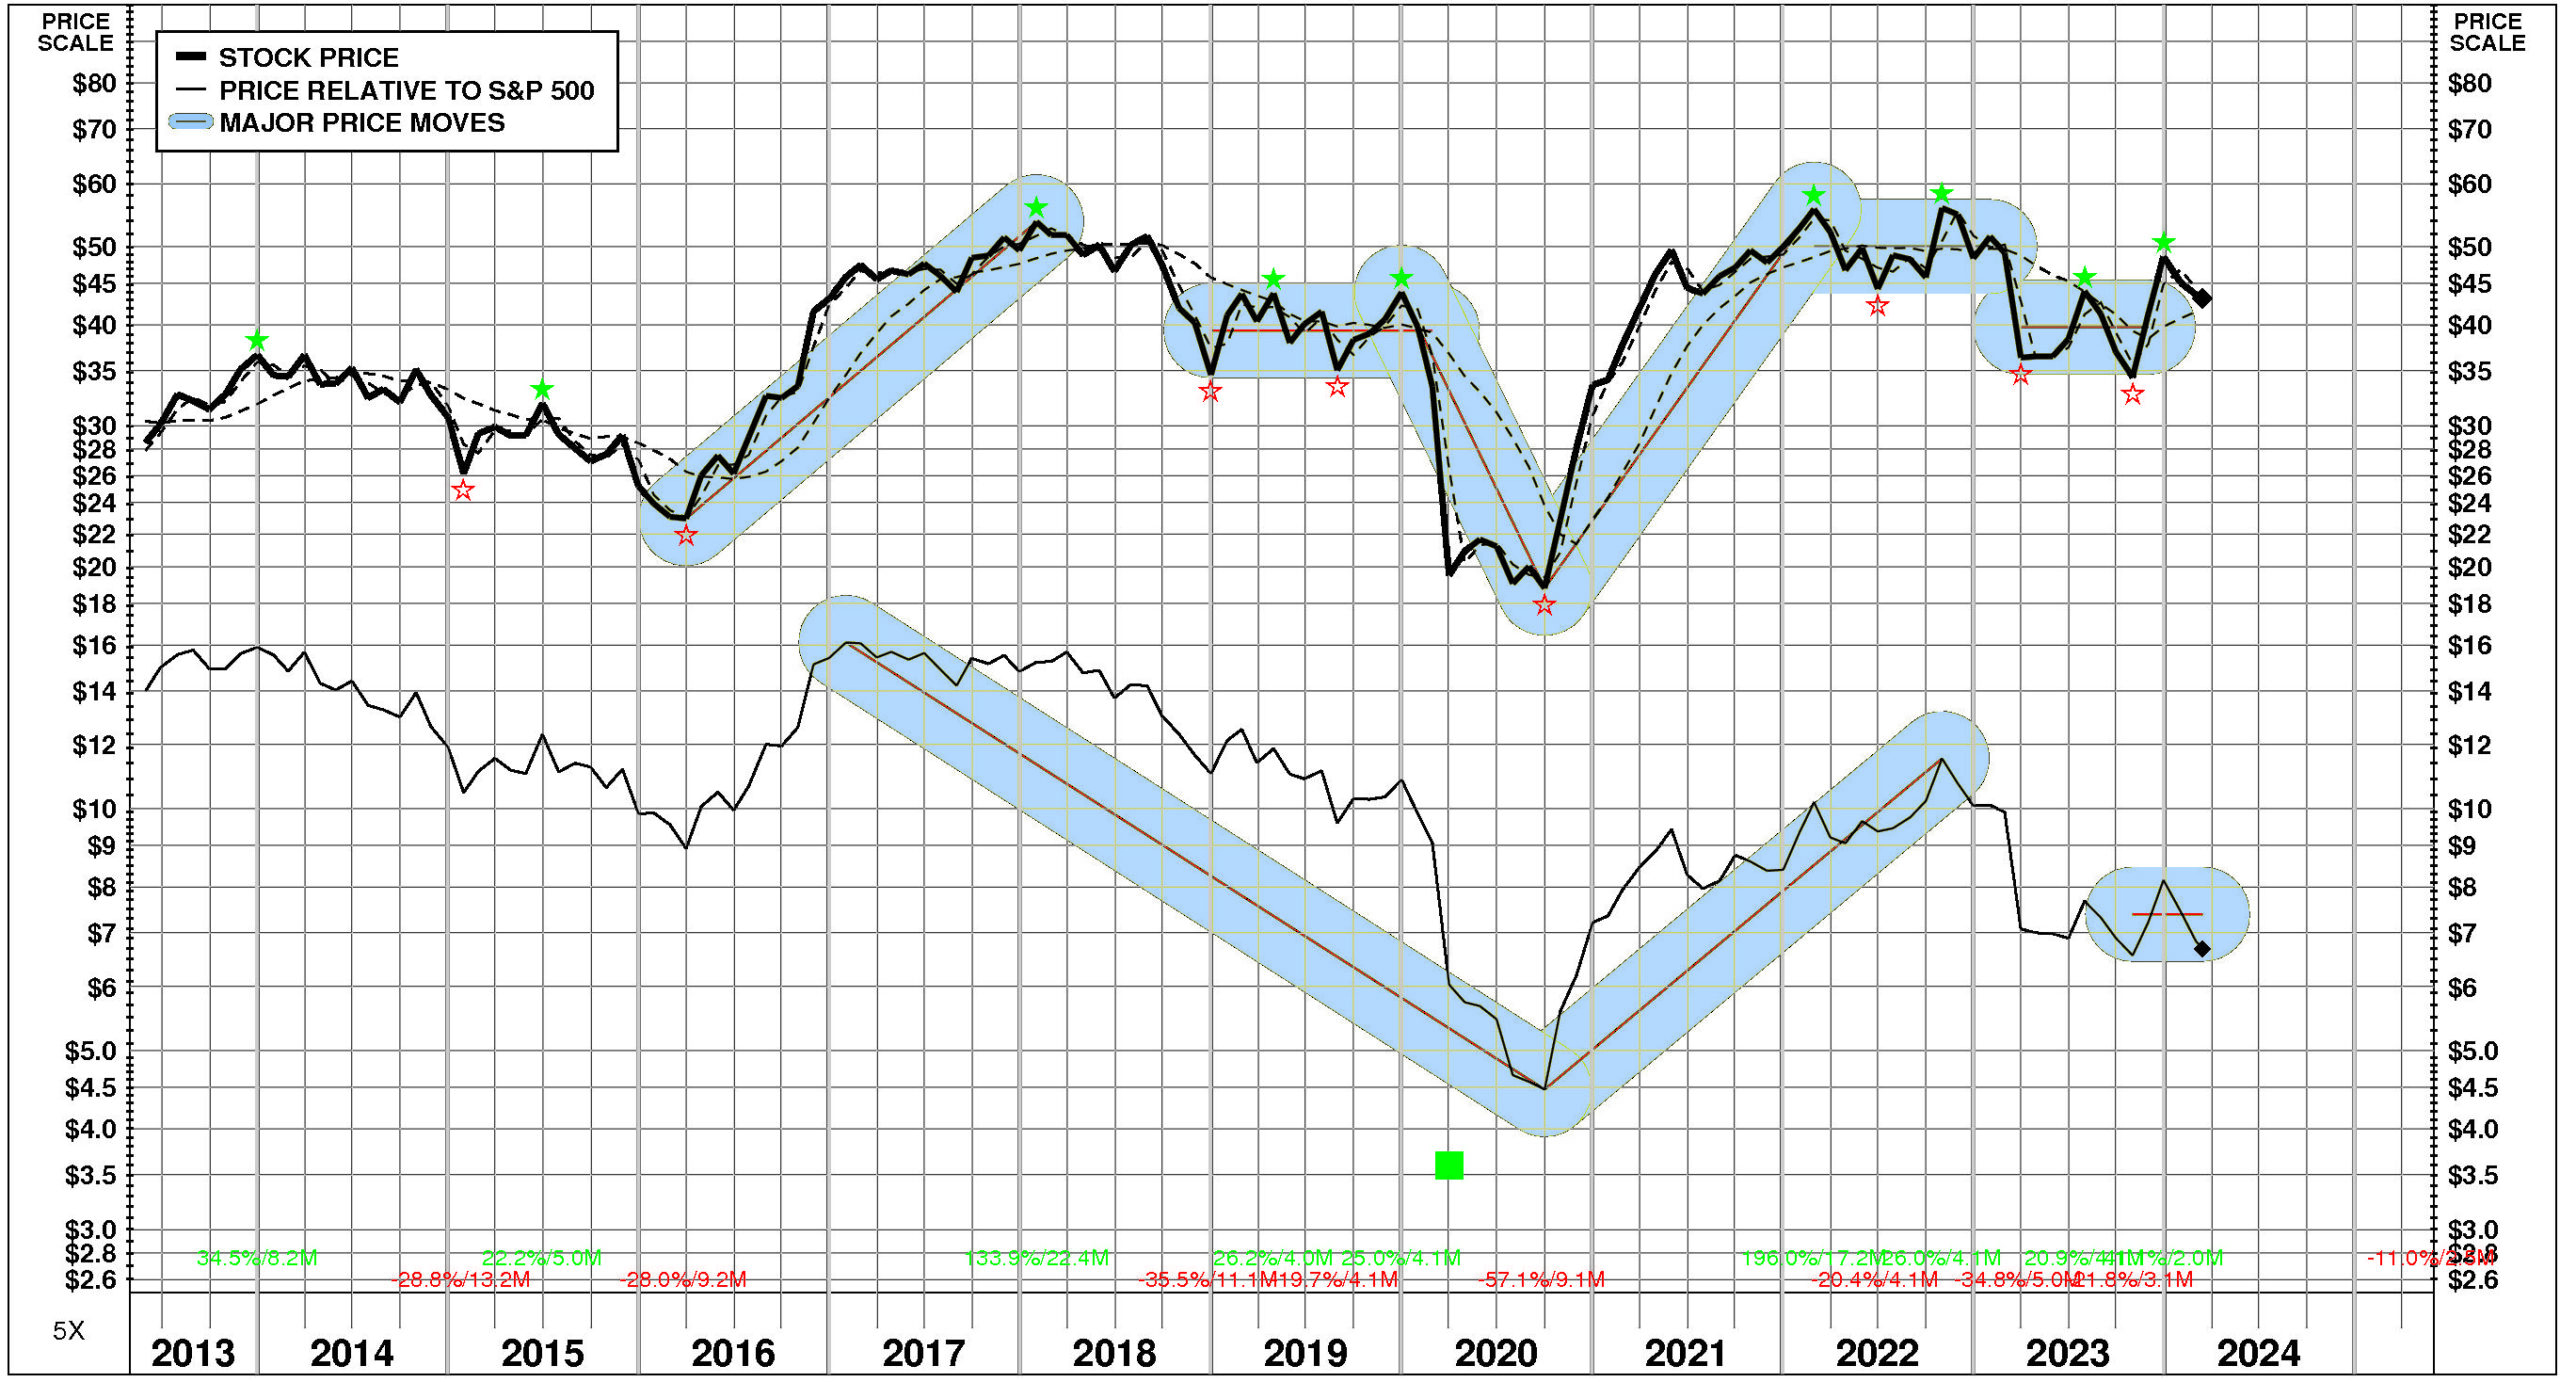
PRICE HISTORY
Over the full time period, Hancock Whitney’s stock price performance has been variable and significantly below market. Between May, 2013 and March, 2024, Hancock Whitney’s stock price rose +51%; relative to the market, this was a -52% loss. Significant price moves during the period: 1) September, 2020 – February, 2022: +196%; 2) December, 2019 – September, 2020: -57%; and 3) March, 2016 – January, 2018: +134%.
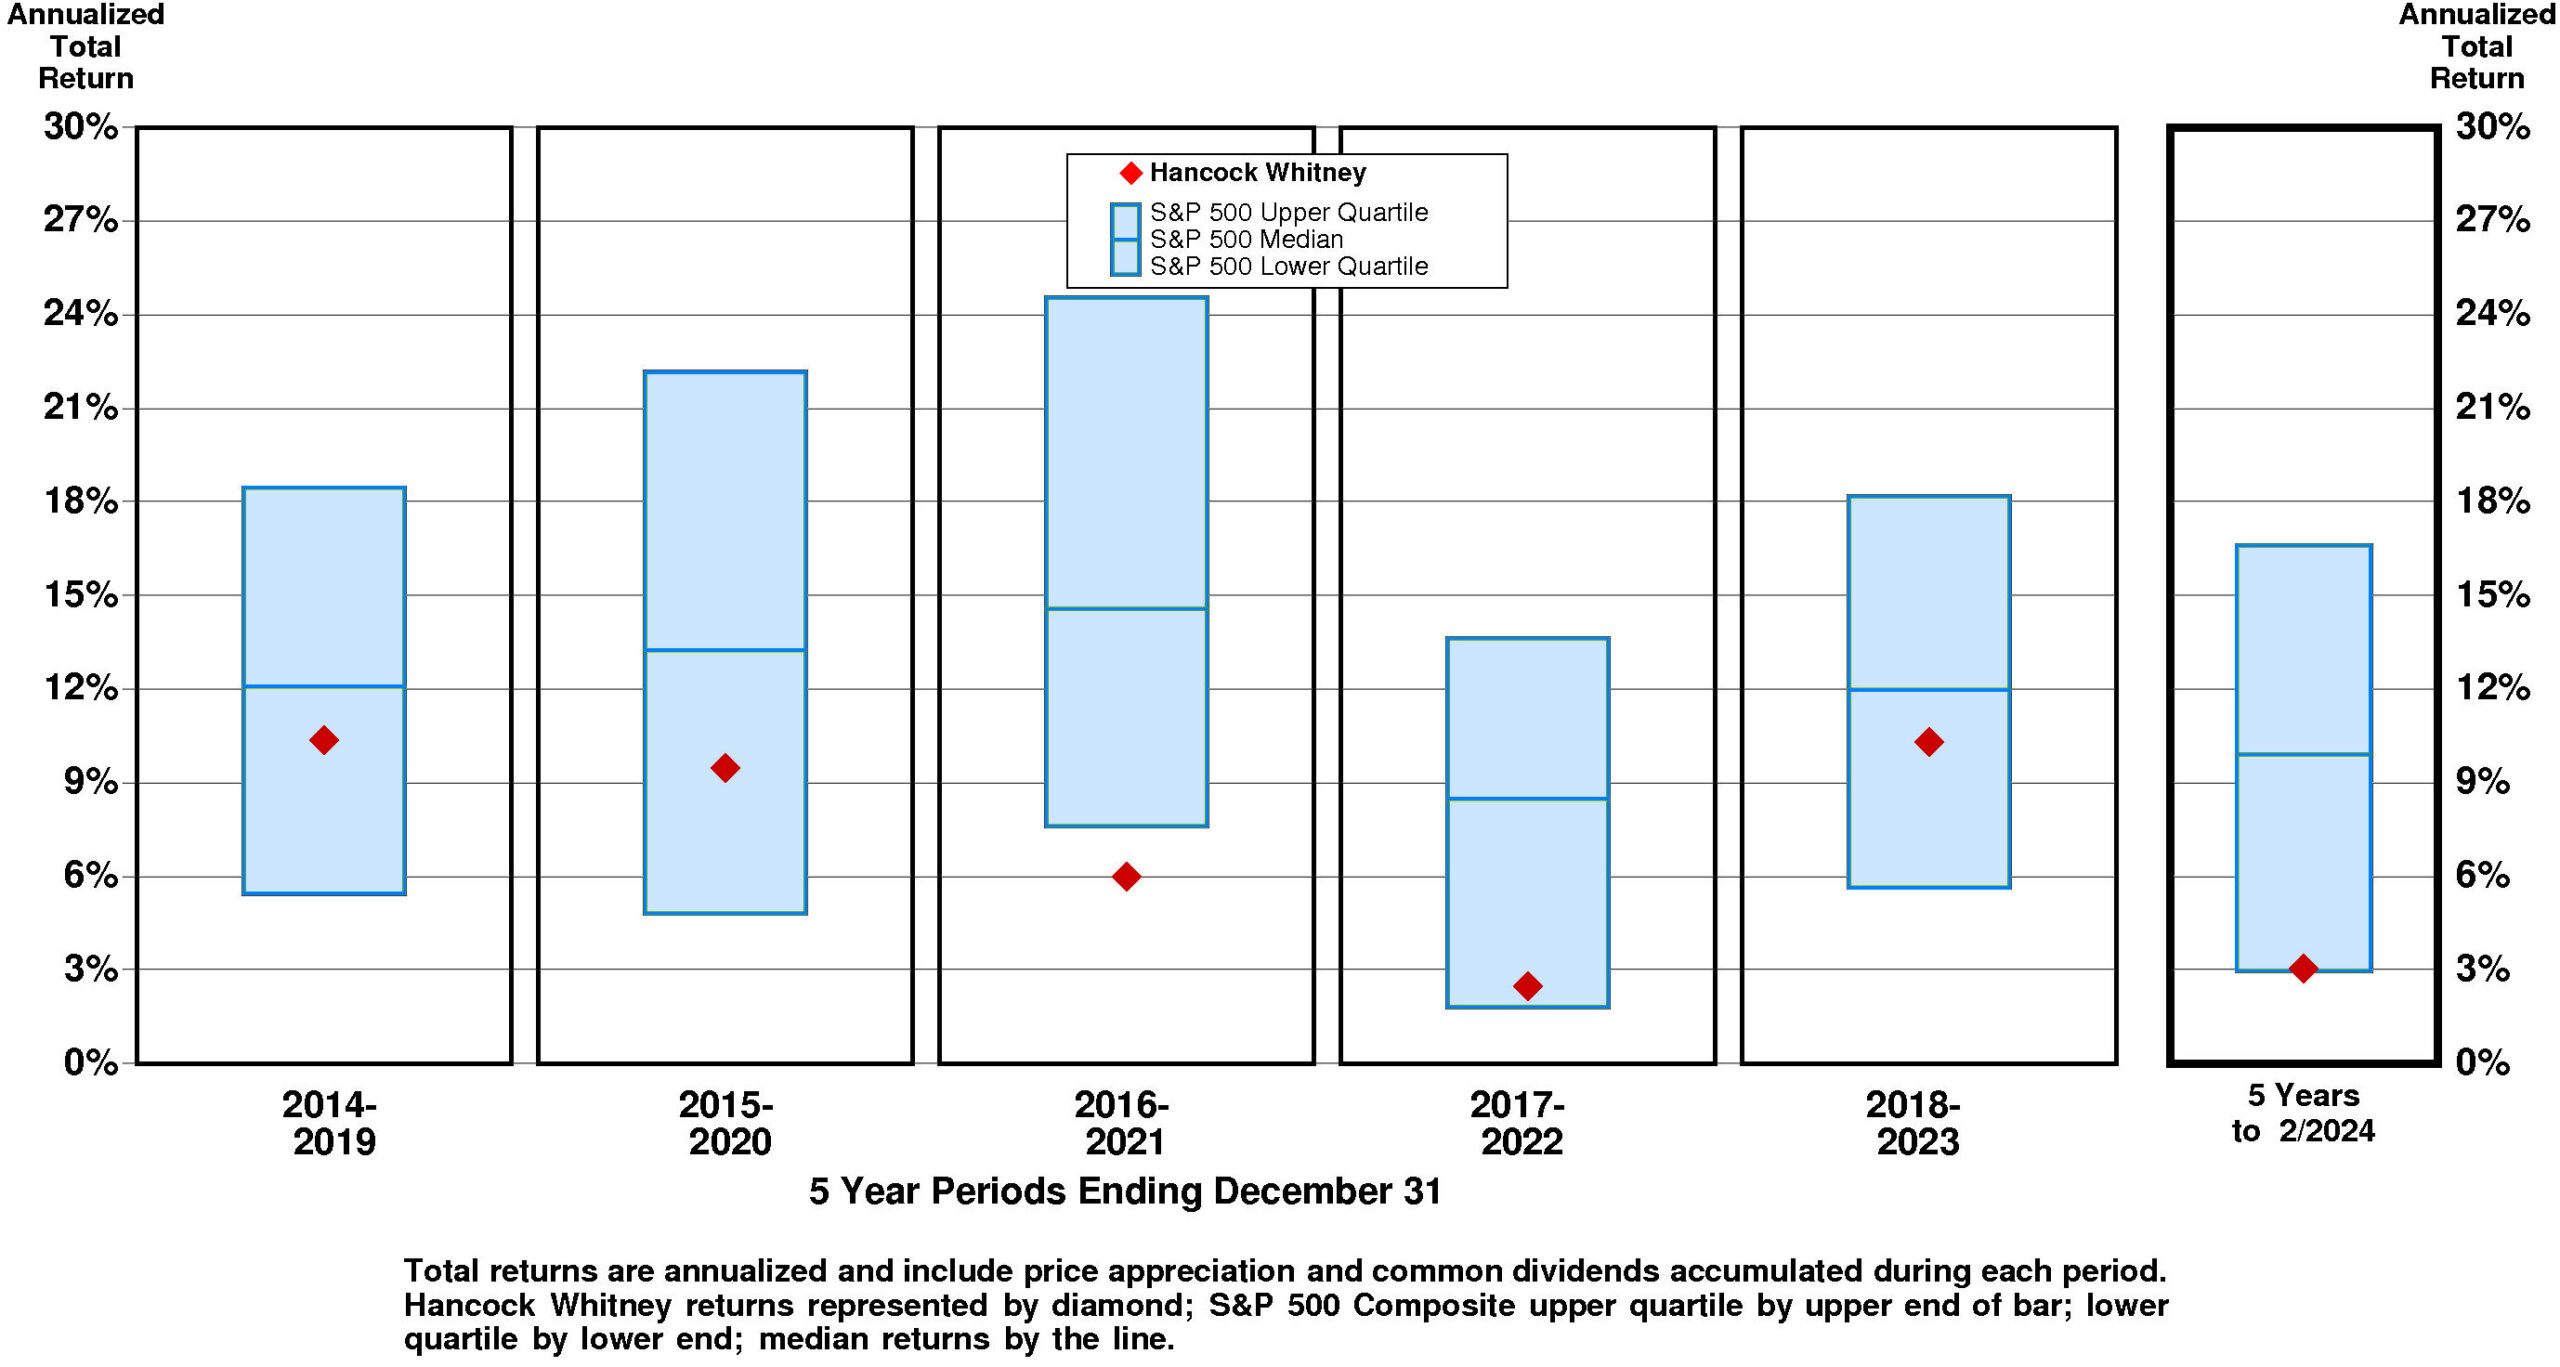
TOTAL INVESTMENT RETURNS
Current annual total return performance of -8.5% is lower quartile relative to the S&P 500 Composite.
In addition to being lower quartile relative to S&P 500 Composite, current annual total return performance through February, 2024 of -8.5% is slightly below median relative to Hancock Whitney Corp Peer Group.
Current 5-year total return performance of 3.0% is substantially below median relative to the S&P 500 Composite.
Through February, 2024, with substantially below median current 5-year total return of 3.0% relative to S&P 500 Composite, Hancock Whitney’s total return performance is at the upper quartile relative to Hancock Whitney Corp Peer Group.
VALUATION BENCHMARKS
Relative to S&P 500 Composite, HWC’s overall valuation is quite low. Four of five factors are lower quartile. The highest factor is the ratio of enterprise value/revenue, followed by the ratio of enterprise value/earnings before interest and taxes, then by the price/earnings ratio, then by the price/equity ratio. The lowest factor, ratio of enterprise value/assets, is lower quartile.
Relative to Hancock Whitney Peer Group, HWC’s overall valuation is low. The highest factor, the ratio of enterprise value/earnings before interest and taxes, is at median. Price/equity ratio is at the lower quartile. Price/earnings ratio is at the lower quartile. Ratio of enterprise value/revenue is at the lower quartile. The lowest factor, the ratio of enterprise value/assets, is at the lower quartile.
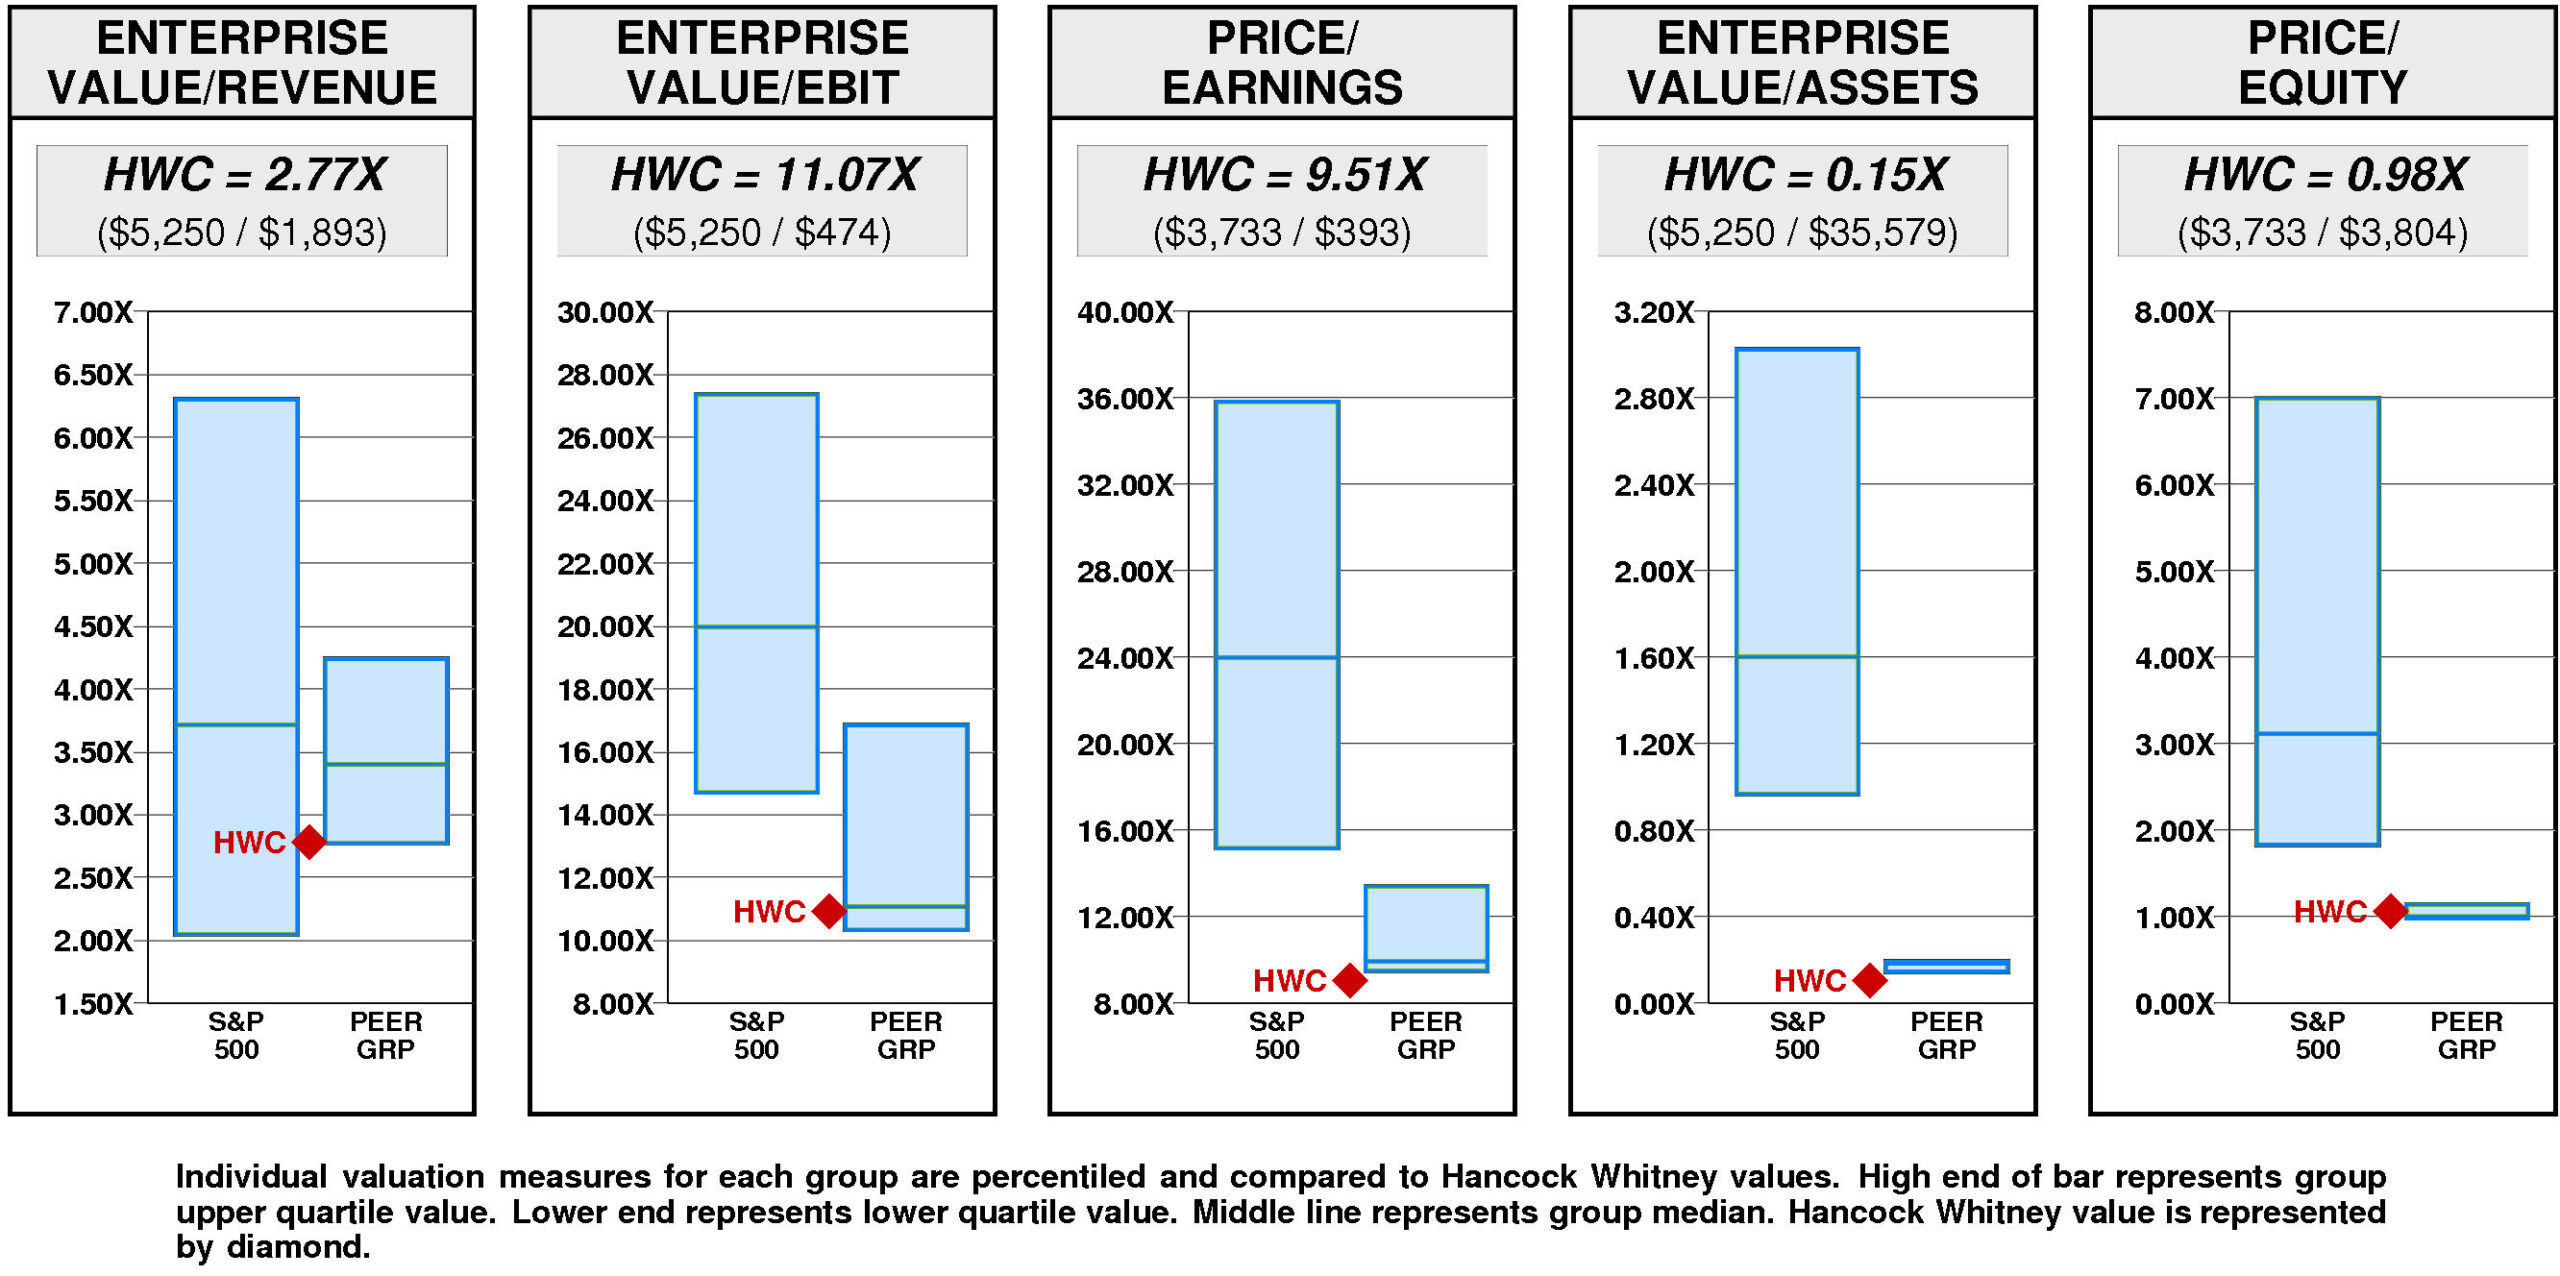
Hancock Whitney has a very large value gap compared to the median. For HWC to hit median valuation, its current ratio of enterprise value/revenue would have to rise from the current level of 2.77X to 3.40X. If HWC’s ratio of enterprise value/revenue were to rise to 3.40X, its stock price would be higher by $14 to $57.
For HWC to achieve upper quartile valuation relative to the Hancock Whitney Peer Group, its current ratio of enterprise value/revenue would have to rise from the current level of 2.77X to 4.24X. If HWC’s ratio of enterprise value/revenue were to rise to 4.24X, its stock price would increase by $32 from the current level of $43.
VALUE TARGETS
HWC’s future returns on capital are forecasted to exceed the cost of capital. Accordingly, the company is expected to continue to be a Value Builder.
Hancock Whitney’s current Price Target of $113 represents a +162% change from the current price of $43.23.
This high appreciation potential results in an appreciation score of 81 (only 19% of the universe has greater appreciation potential.)
Reinforcing this high Appreciation Score of 81, the high Power Rating of 80 contributes to an Value Trend Rating of A.
Hancock Whitney’s current Price Target is $113 (-4% from the 2023 Target of $118 but +162% from the 03/13/24 price of $43.23). This plateau in the Target is the result of a +3% increase in the equity base and a -7% decrease in the price/equity multiple. The forecasted increase in return on equity has a slight positive impact on the price/equity multiple and the forecasted decline in cost of equity has a very slight positive impact as well. More than offsetting these Drivers, the forecasted decline in growth has a large negative impact.
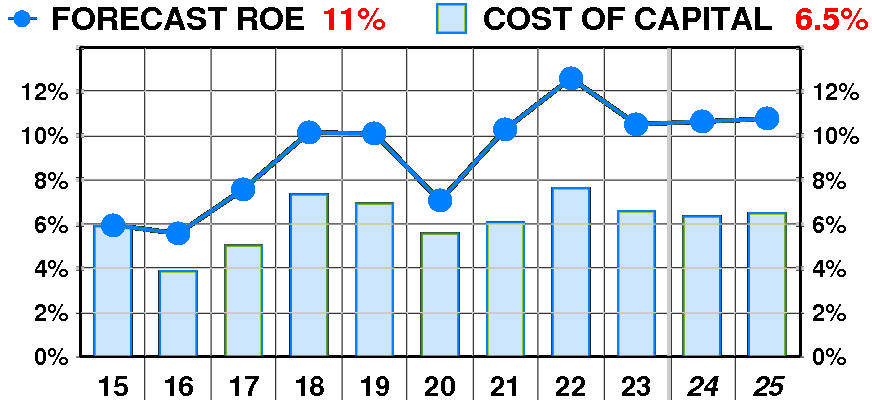
PTR’s return on equity forecast is 10.8% — in line with our recent forecasts. Forecasted return on equity enjoyed a dramatic, variable increase between 2015 and 2023. The current forecast is well above the 2016 low of 6%.
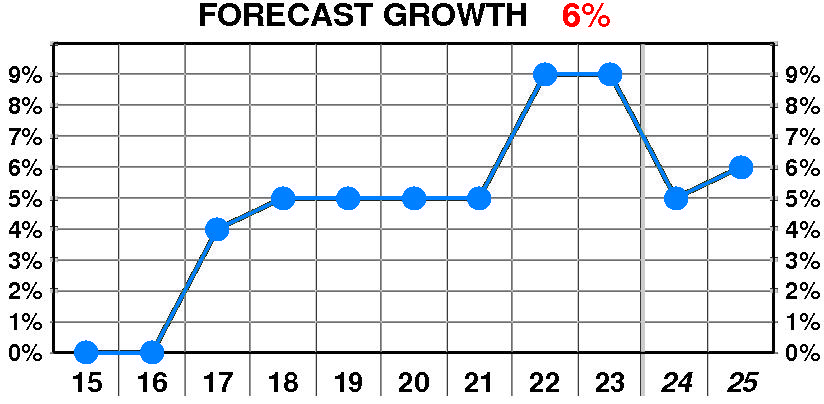
PTR’s growth forecast is 6.0% — slightly below our recent forecasts. Forecasted growth enjoyed a dramatic, variable increase between 2017 and 2023. The current forecast is steady at the 2017 low of 4%.
PTR’s cost of equity forecast is 6.5% — in line with recent levels. Forecasted cost of equity suffered a dramatic, erratic increase between 2015 and 2023. The current forecast is above the 2016 low of 3.9%.
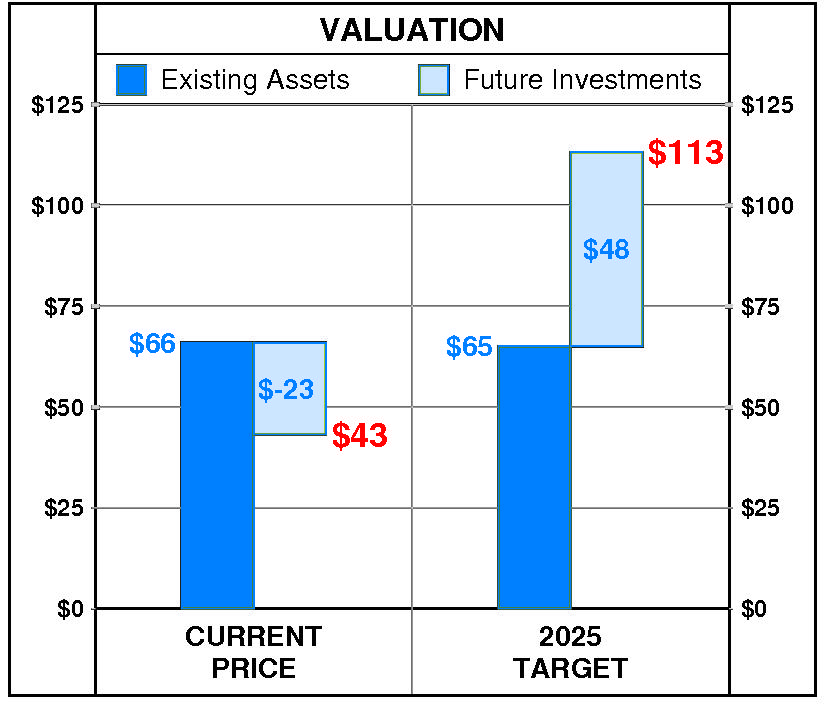
At Hancock Whitney’s current price of $43.23, investors are placing a negative value of $-23 on its future investments. This view is not supported by the company’s most recent performance that reflected a growth rate of 9.0% per year, and a return on equity of 10.5% versus a cost of equity of 6.6%.
PTR’s 2025 Price Target of $113 is based on these forecasts and reflects an estimated value of existing assets of $65 and a value of future investments of $48.
Be the first to comment