
BUSINESS
Helen of Troy Limited provides various consumer products in the United States, Canada, Europe, the Middle East, Africa, the Asia Pacific, and Latin America. The company operates through three segments: Home & Outdoor, Health & Wellness, and Beauty. The Home & Outdoor segment offers food preparation tools and gadgets, storage containers, and organization products; coffee makers, grinders, manual pour overs, and tea kettles; household cleaning products, shower organization, and bathroom accessories; feeding and drinking products, child seating products, cleaning tools, and nursery accessories; insulated water bottles, hydration packs, drinkware, mugs, food containers, lunch containers, insulated totes, soft coolers, and accessories; and technical and outdoor sports packs, travel packs, luggage, daypacks, and everyday packs.
INVESTMENT RATING
HELE is expected to continue to be a Value Builder reflecting capital returns that are forecasted to exceed the cost of capital.
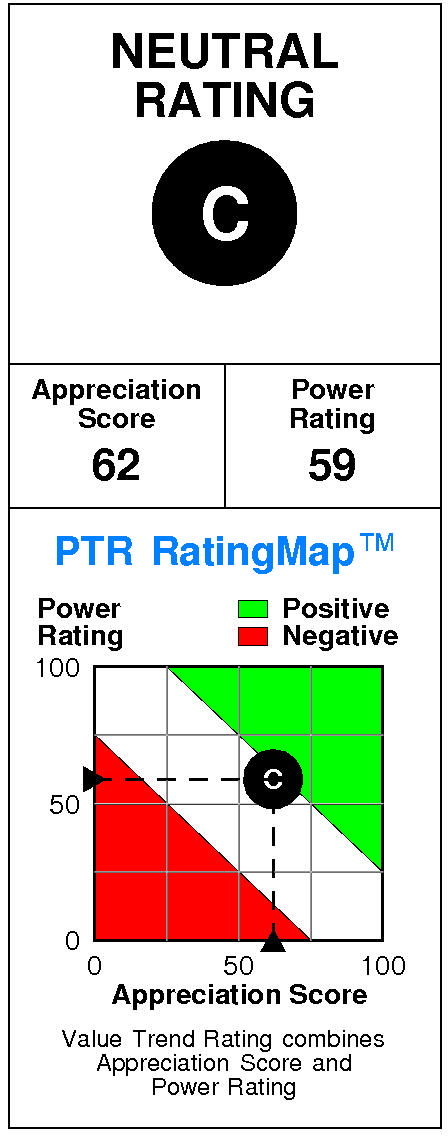
Helen of Troy has a current Value Trend Rating of C (High Neutral).
The Value Trend Rating reflects highly consistent signals from PTR's two proprietary measures of a stock's attractiveness. Helen of Troy has a neutral Power Rating of 59 and a slightly positive Appreciation Score of 62, triggering the High Neutral Value Trend Rating.
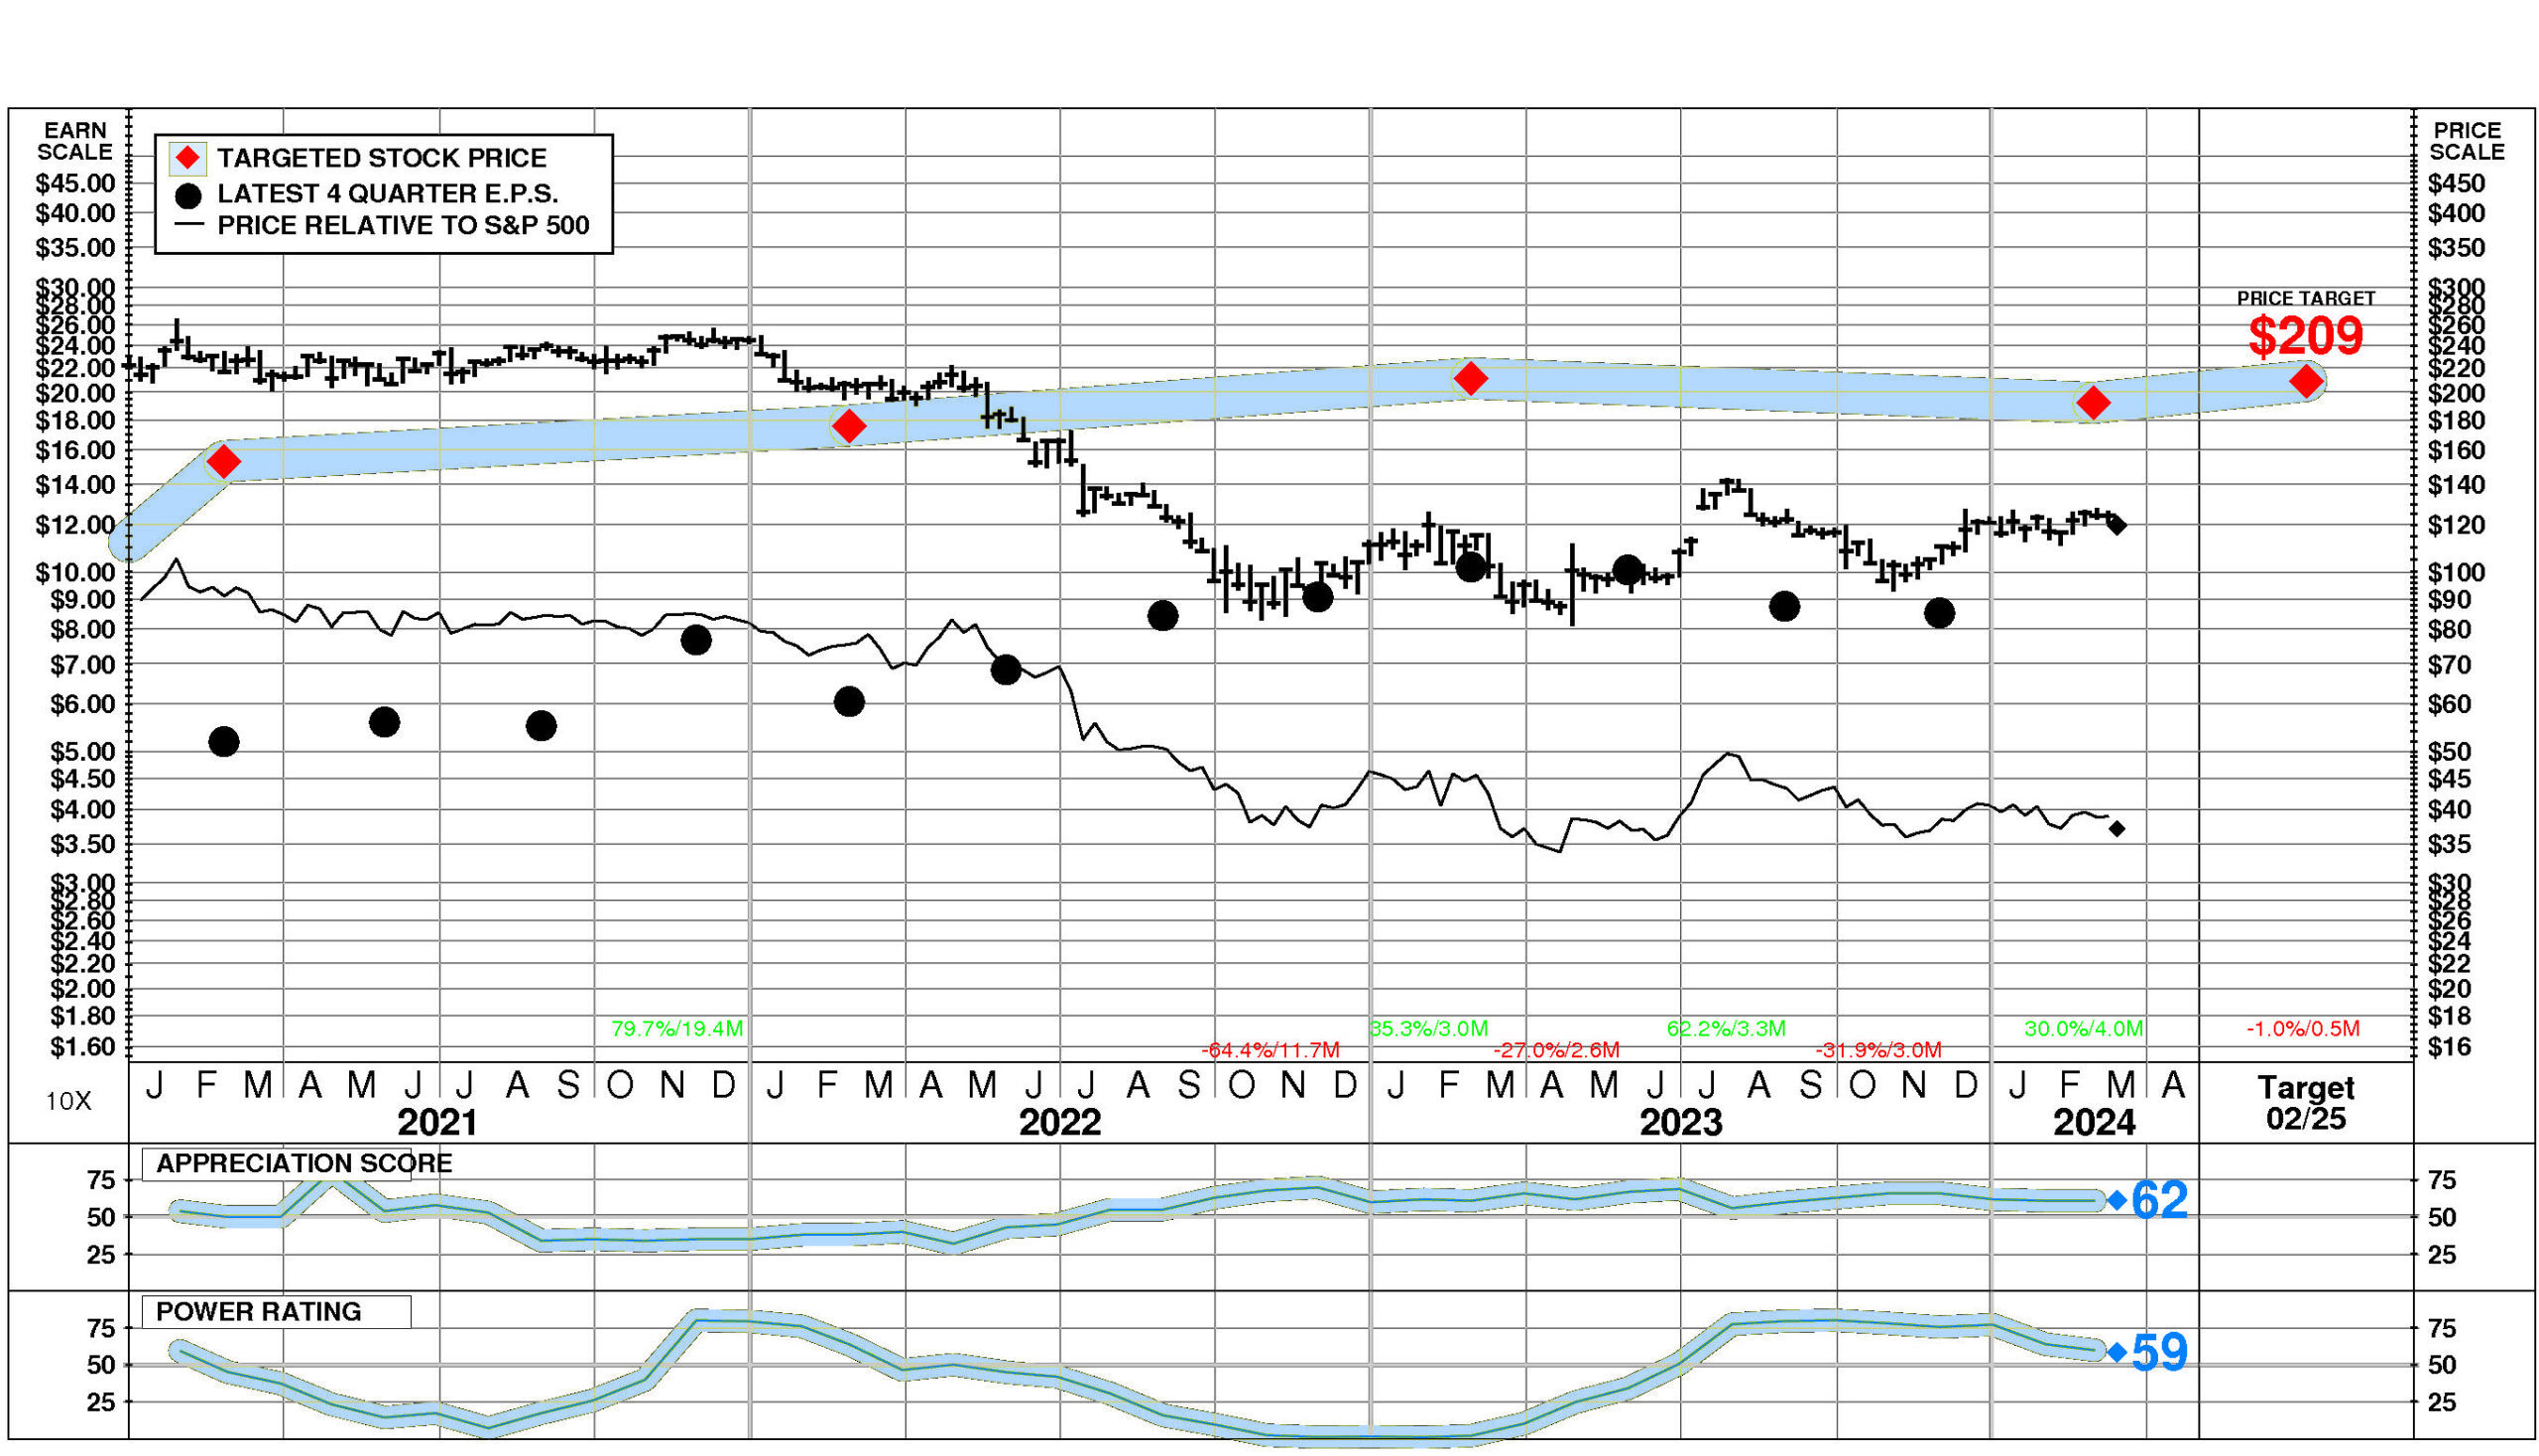
Helen of Troy's stock is selling well below targeted value.
The current stock price of $119.62 compares to targeted value 12 months forward of $210.
This moderately high appreciation potential results in an appreciation score of 62 (only 38% of the universe has greater appreciation potential.)
Helen of Troy has a Power Rating of 59.
(This neutral Power Rating indicates that HELE's chances of enjoying attractive investment performance over the near to intermediate term are only average.)
Factors contributing to this neutral Power Rating include: the recent trend in HELE's earnings estimates has been favorable; and recent price action has been neutral. An offsetting factor is the Electric Housewares and Fans comparison group is in a slightly weakened position currently.
INVESTMENT PROFILE
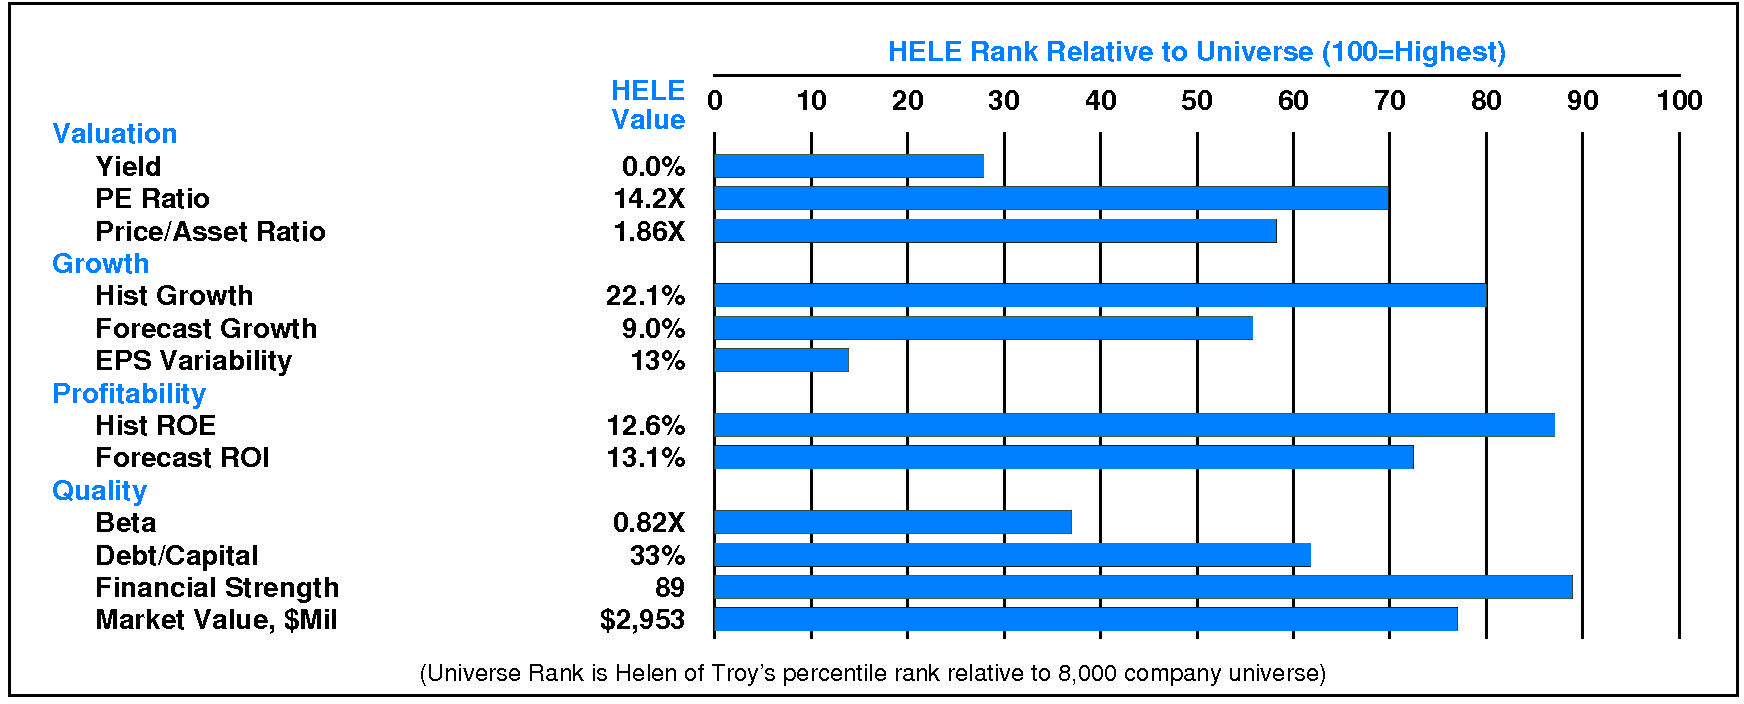
HELE's financial strength is high. Financial strength rating is 89.
Relative to the S&P 500 Composite, Helen of Troy Ltd has neutral Growth/Value characteristics; its appeal is likely to be to Capital Gain-oriented investors; the perception is that HELE is lower risk.
All factors are relative strengths. HELE's valuation is low: low dividend yield, low P/E ratio, and low price/book ratio. HELE has unusually low market capitalization.
CURRENT SIGNALS
Helen of Troy's current operations are eroding.
Return on equity is falling, reflecting: falling asset utilization; declining pretax margin; falling tax keep rate; and falling leverage.
Helen of Troy's current technical position is very strong.
The stock price is in a 4.0 month up move. The stock has appreciated 30.0% from its prior low. The stock price is above its 200 day moving average which is in an uptrend.
ALERTS
The stock is currently rated C.
On 3/13/24, Helen of Troy Ltd (NASDAQ: HELE) stock rose slightly by 0.2%, closing at $119.62. However, this advance was accompanied by unusually low trading volume at 63% of normal. The stock has performed in line with the market over the last nine months and has declined -1.5% during the last week.
CASH FLOW
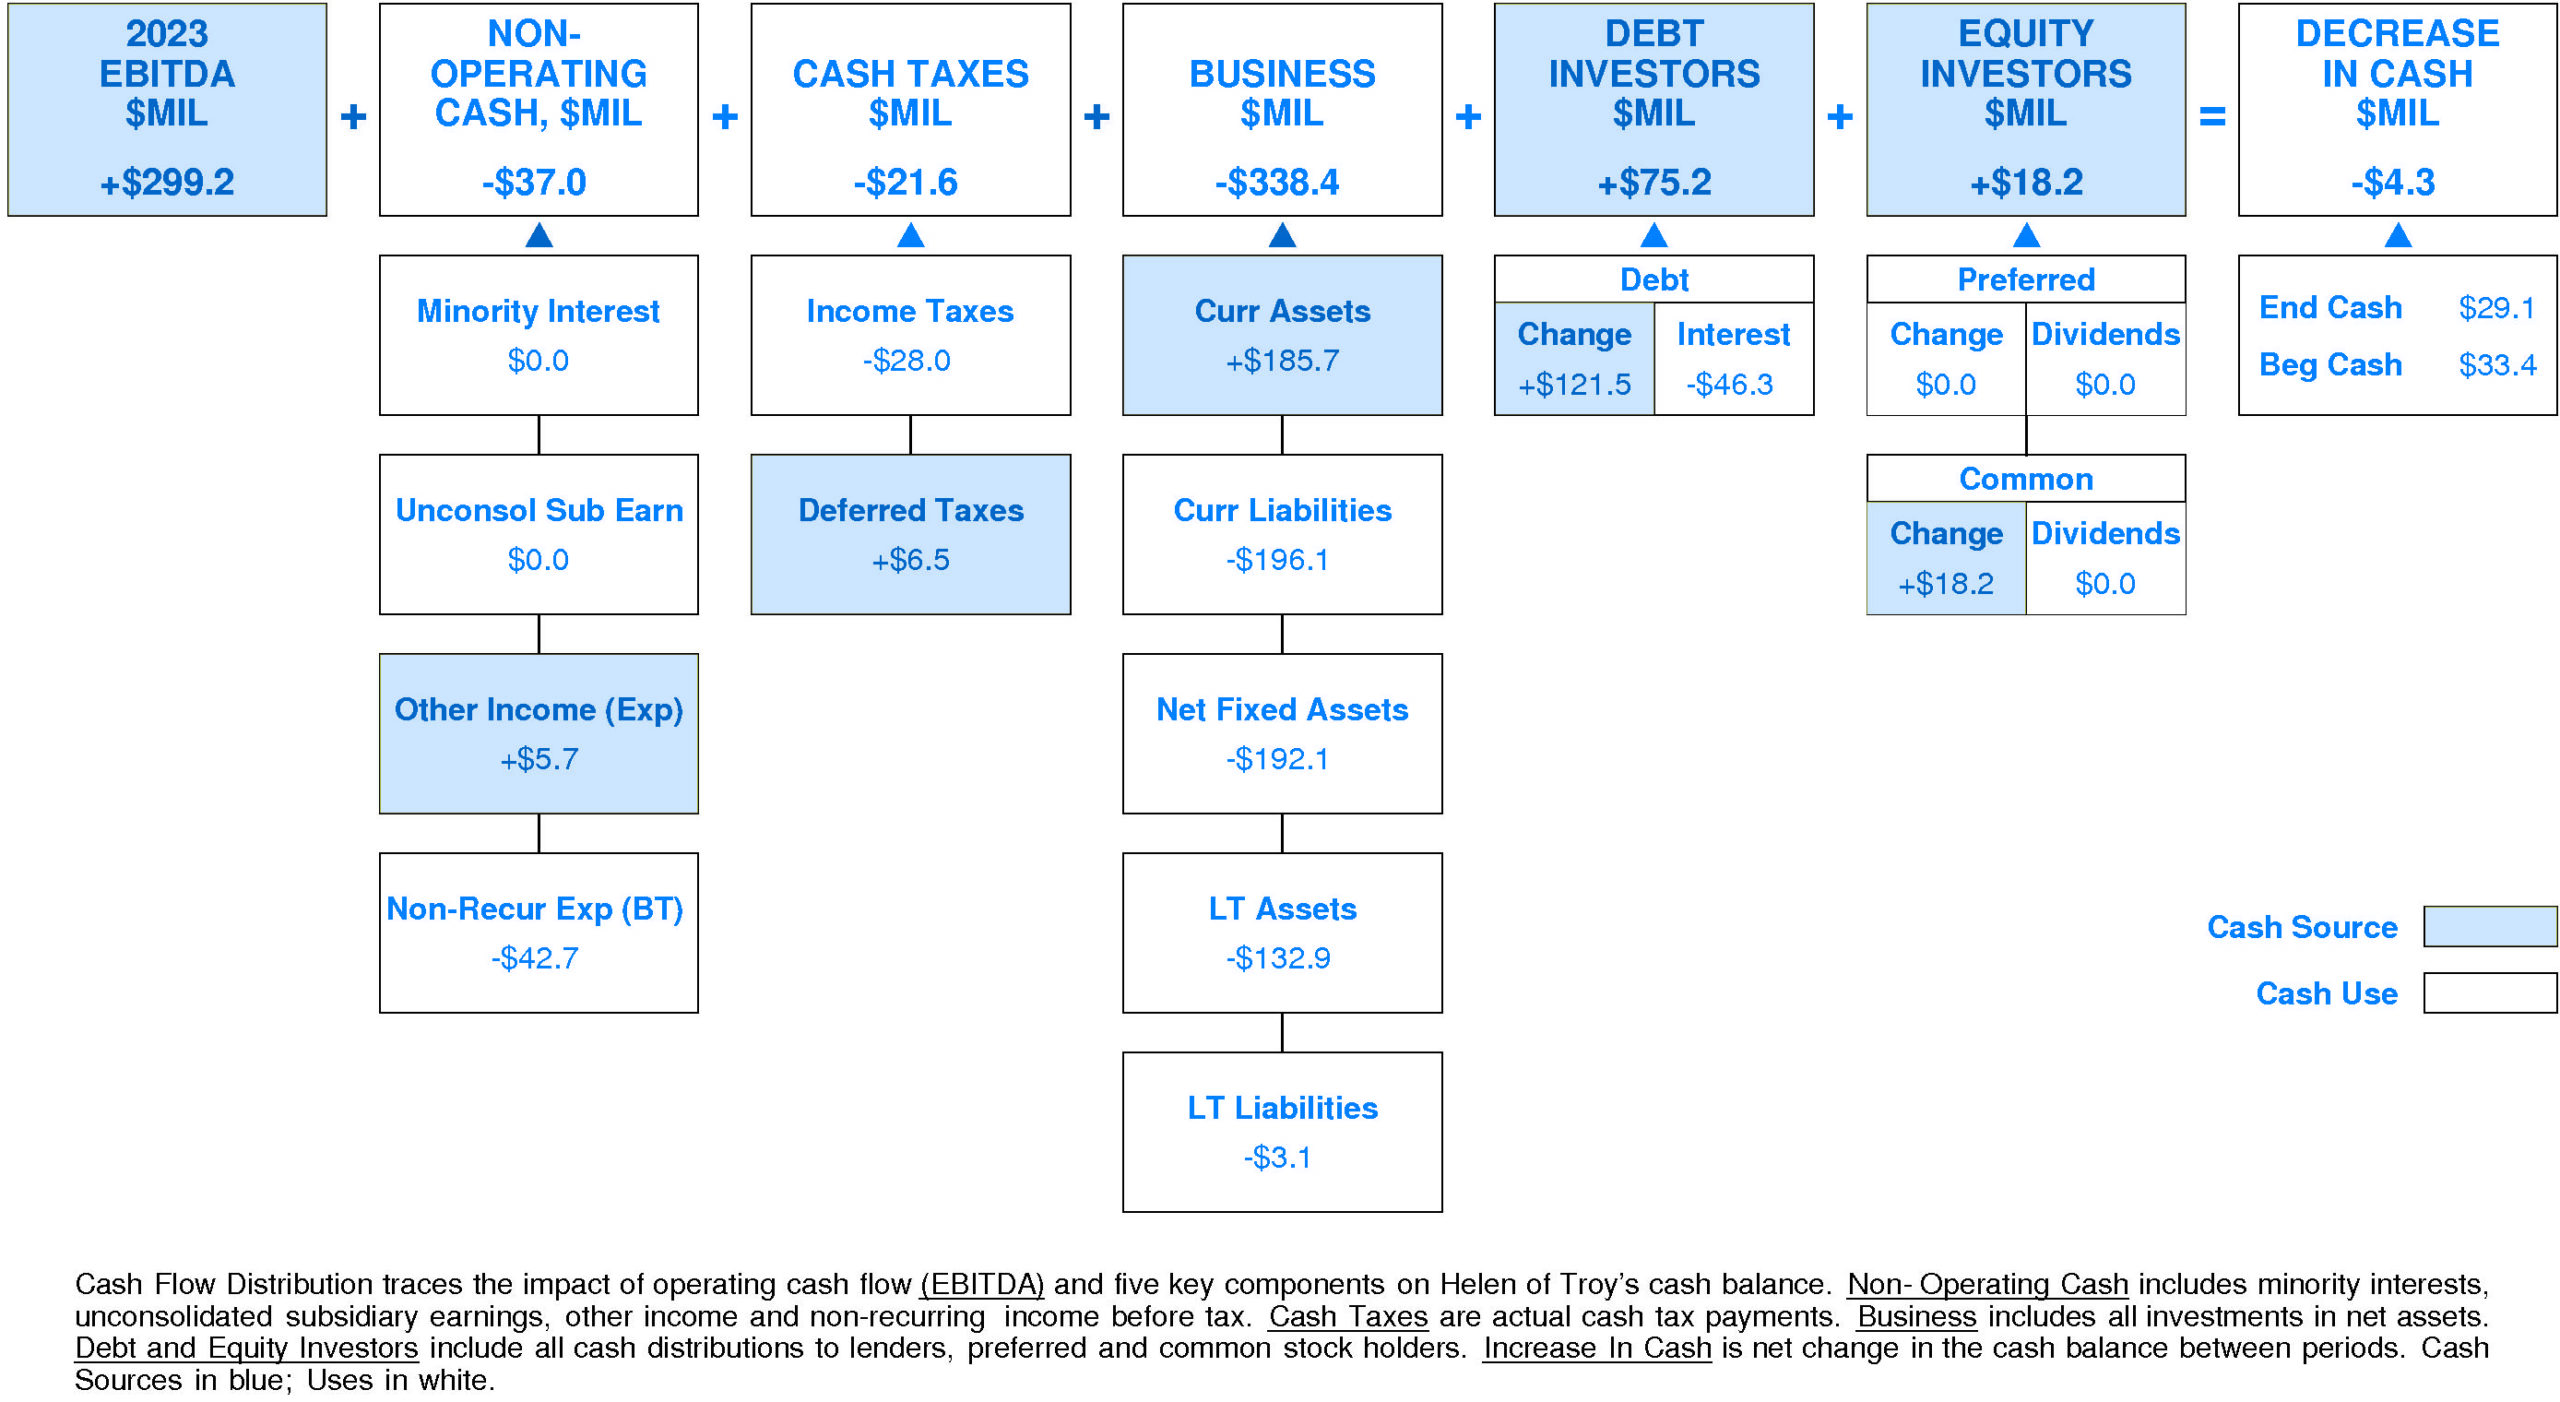
In 2023, Helen of Troy experienced a significant decline in cash of -$4.3 million (-13%). Sources of cash were lower than uses.
Cash generated from 2023 EBITDA totaled +$299.2 million. Non-operating uses consumed -$37.0 million (-12% of EBITDA). Cash taxes consumed -$21.6 million (-7% of EBITDA). Re-investment in the business amounted to -$338.4 million (-113% of EBITDA). On a net basis, debt investors contributed +$75.2 million (+25% of EBITDA) while equity investors contributed +$18.2 million (+6% of EBITDA).
Helen of Troy's Non-operating Income, %EBITDA has exhibited little to no overall change over the period.
This stability was accompanied by stability for the Helen Of Troy Peer Group as well. (Since 2021 Non-operating Income, %EBITDA has experienced a very sharp decline.) In most years, Helen of Troy was in the third quartile and lower quartile. Currently, Helen of Troy is lower quartile at -12% of EBITDA (-$37.0 million).
Helen of Troy's Cash Taxes, %EBITDA has exhibited a very small overall uptrend over the period.
This improvement was accompanied by a similar trend for the Helen Of Troy Peer Group. In most years, Helen of Troy was in the top quartile. Currently, Helen of Troy is upper quartile at -7% of EBITDA (-$21.6 million).
Helen of Troy's Business Re-investment, %EBITDA has suffered a volatile overall downtrend over the period.
This downtrend was accompanied by an opposite trend for the Helen Of Troy Peer Group. In most years, Helen of Troy was in the top quartile and lower quartile. Currently, Helen of Troy is lower quartile at -113% of EBITDA (-$338.4 million).
Helen of Troy's Debt Investors, %EBITDA has experienced a volatile overall uptrend over the period.
This improvement was accompanied by stability for the Helen Of Troy Peer Group. In most years, Helen of Troy was in the top quartile and lower quartile. Currently, Helen of Troy is upper quartile at +25% of EBITDA (+$75.2 million).
Helen of Troy's Equity Investors, %EBITDA has enjoyed a volatile overall uptrend over the period.
This improvement was accompanied by an opposite trend for the Helen Of Troy Peer Group. (Since 2021 Equity Investors, %EBITDA has accelerated very sharply.) In most years, Helen of Troy was in the lower quartile and top quartile. Currently, Helen of Troy is upper quartile at +6% of EBITDA (+$18.2 million).
Helen of Troy's Change in Cash, %EBITDA has experienced a downtrend over the period.
This downtrend was accompanied by an opposite trend for the Helen Of Troy Peer Group. In most years, Helen of Troy was in the third quartile and top quartile. Currently, Helen of Troy is substantially below median at -1% of EBITDA (-$4.3 million).
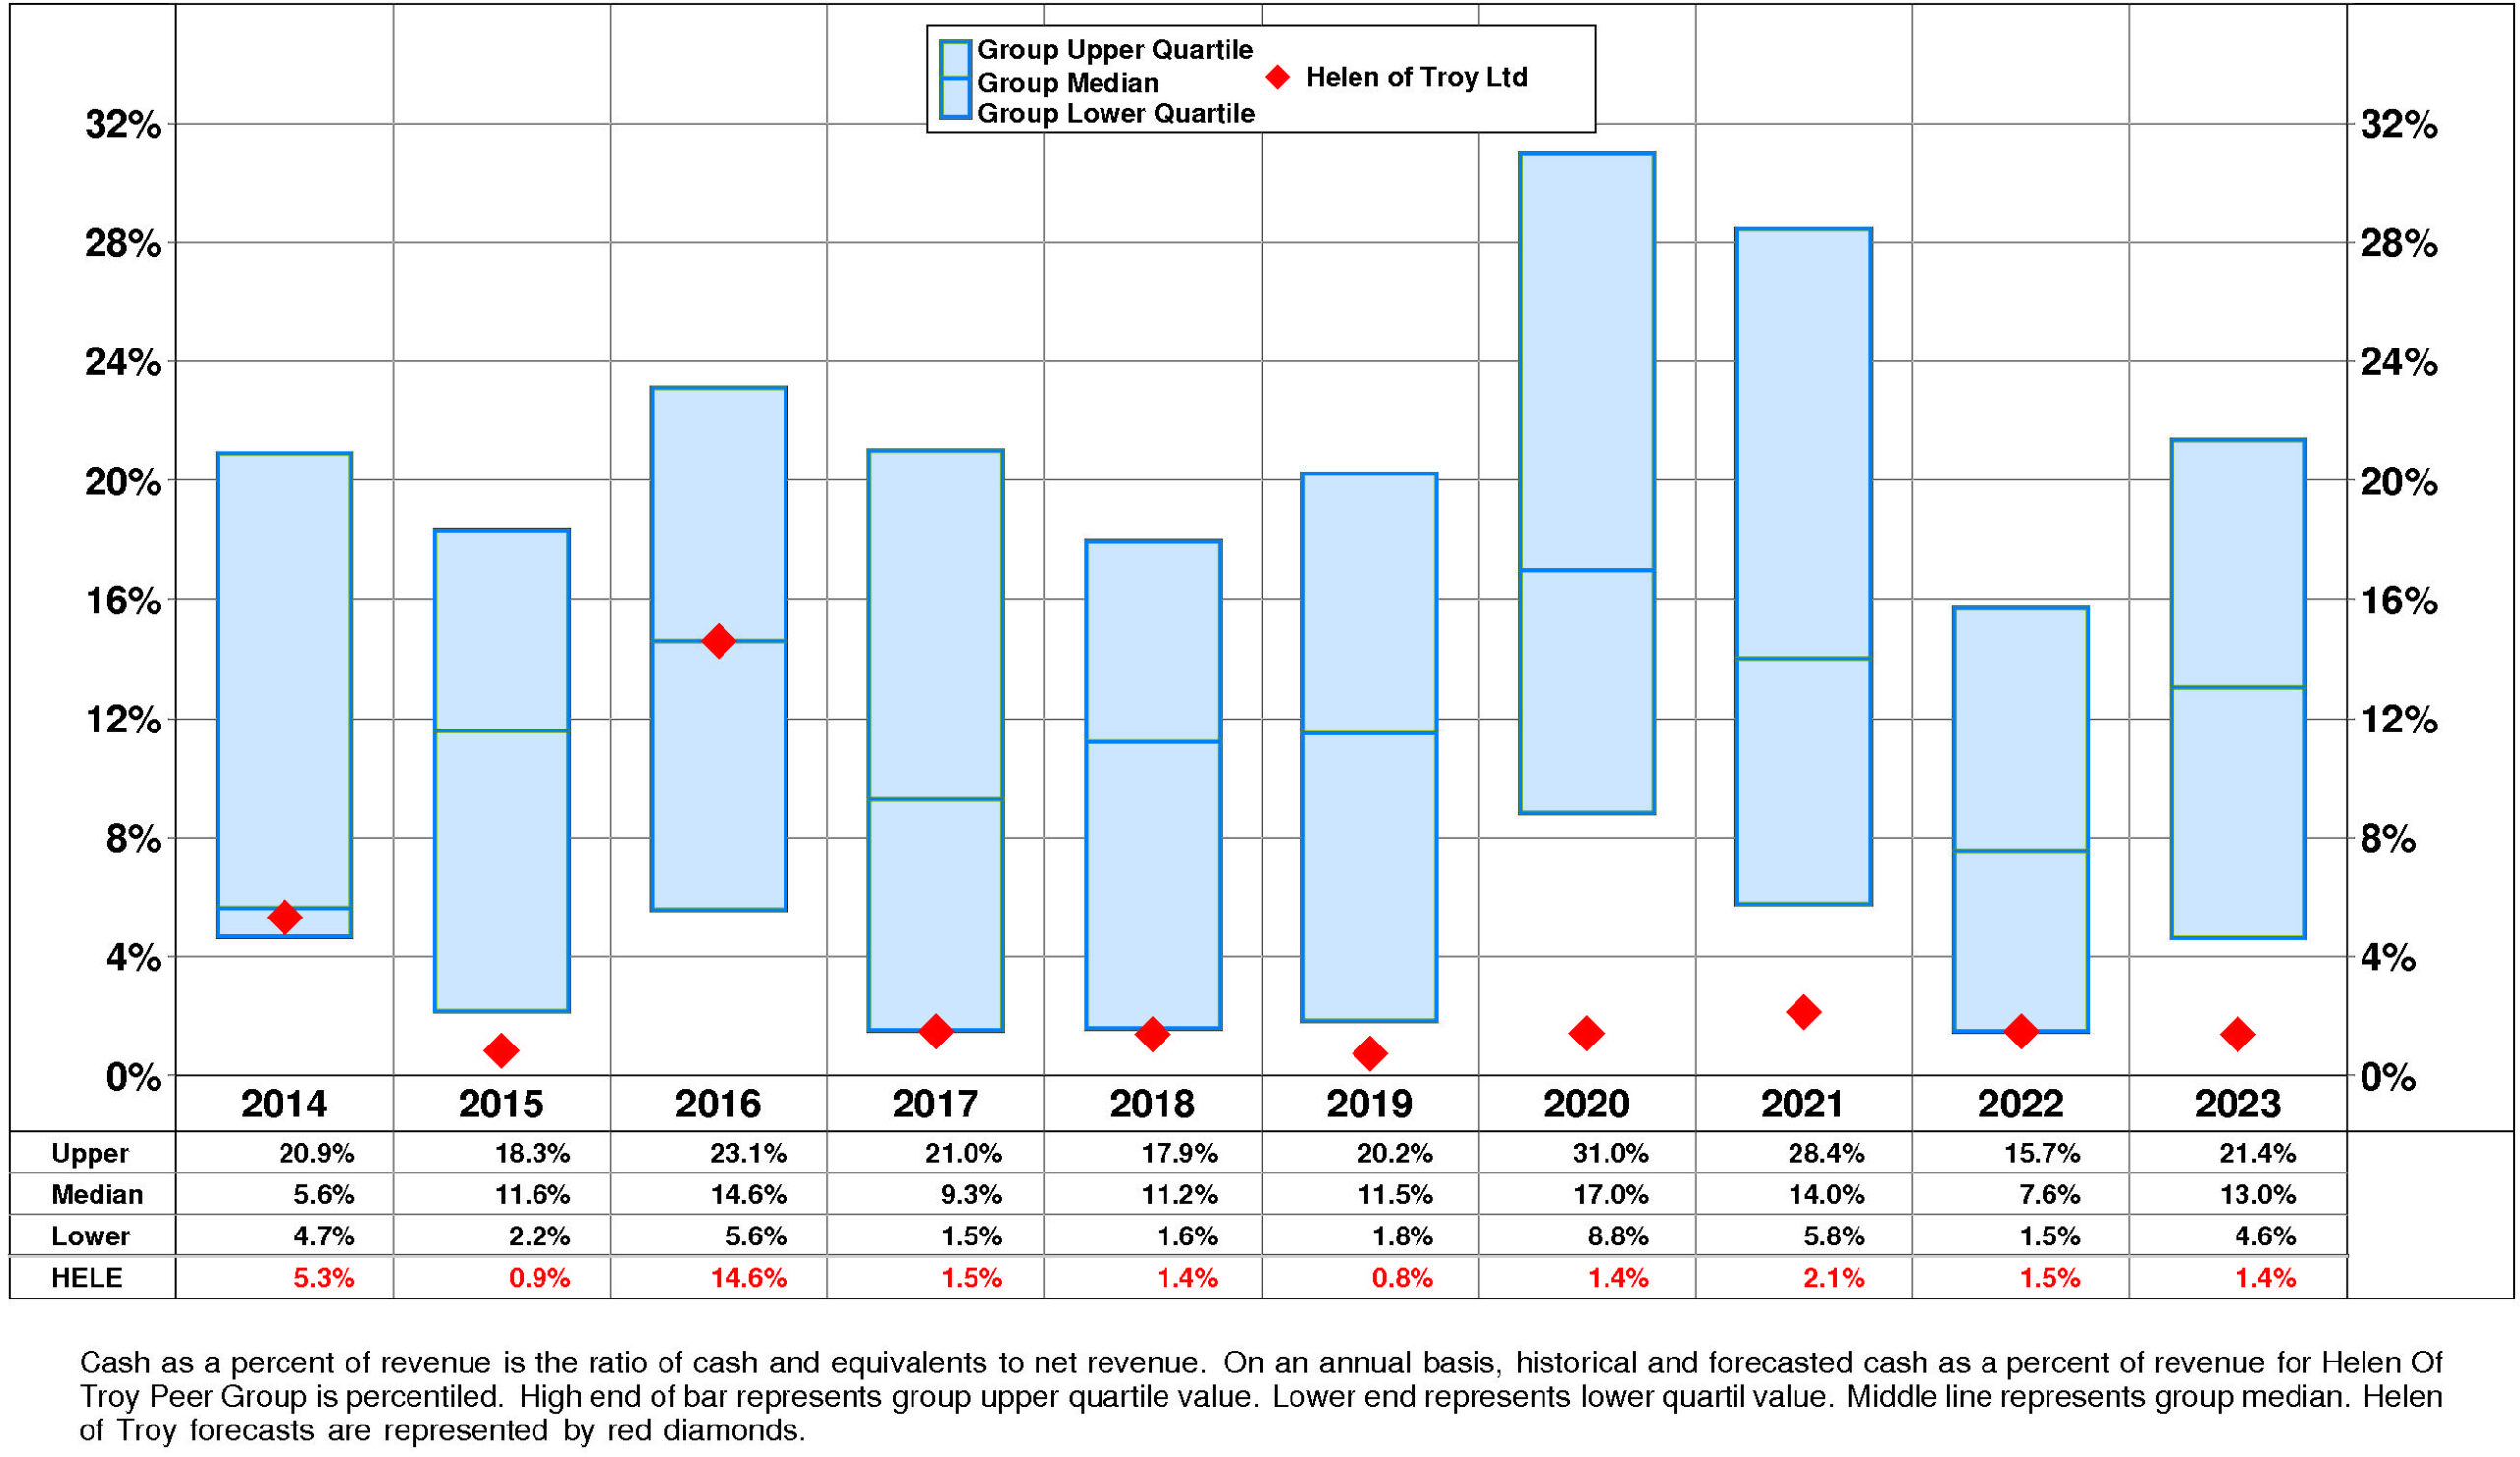
Helen of Troy's Cash, %Revenue has experienced a downtrend over the period.
This downtrend was accompanied by stability for the Helen Of Troy Peer Group. In most years, Helen of Troy was in the lower quartile and third quartile. Currently, Helen of Troy is lower quartile at +1%.
PROFITABILITY
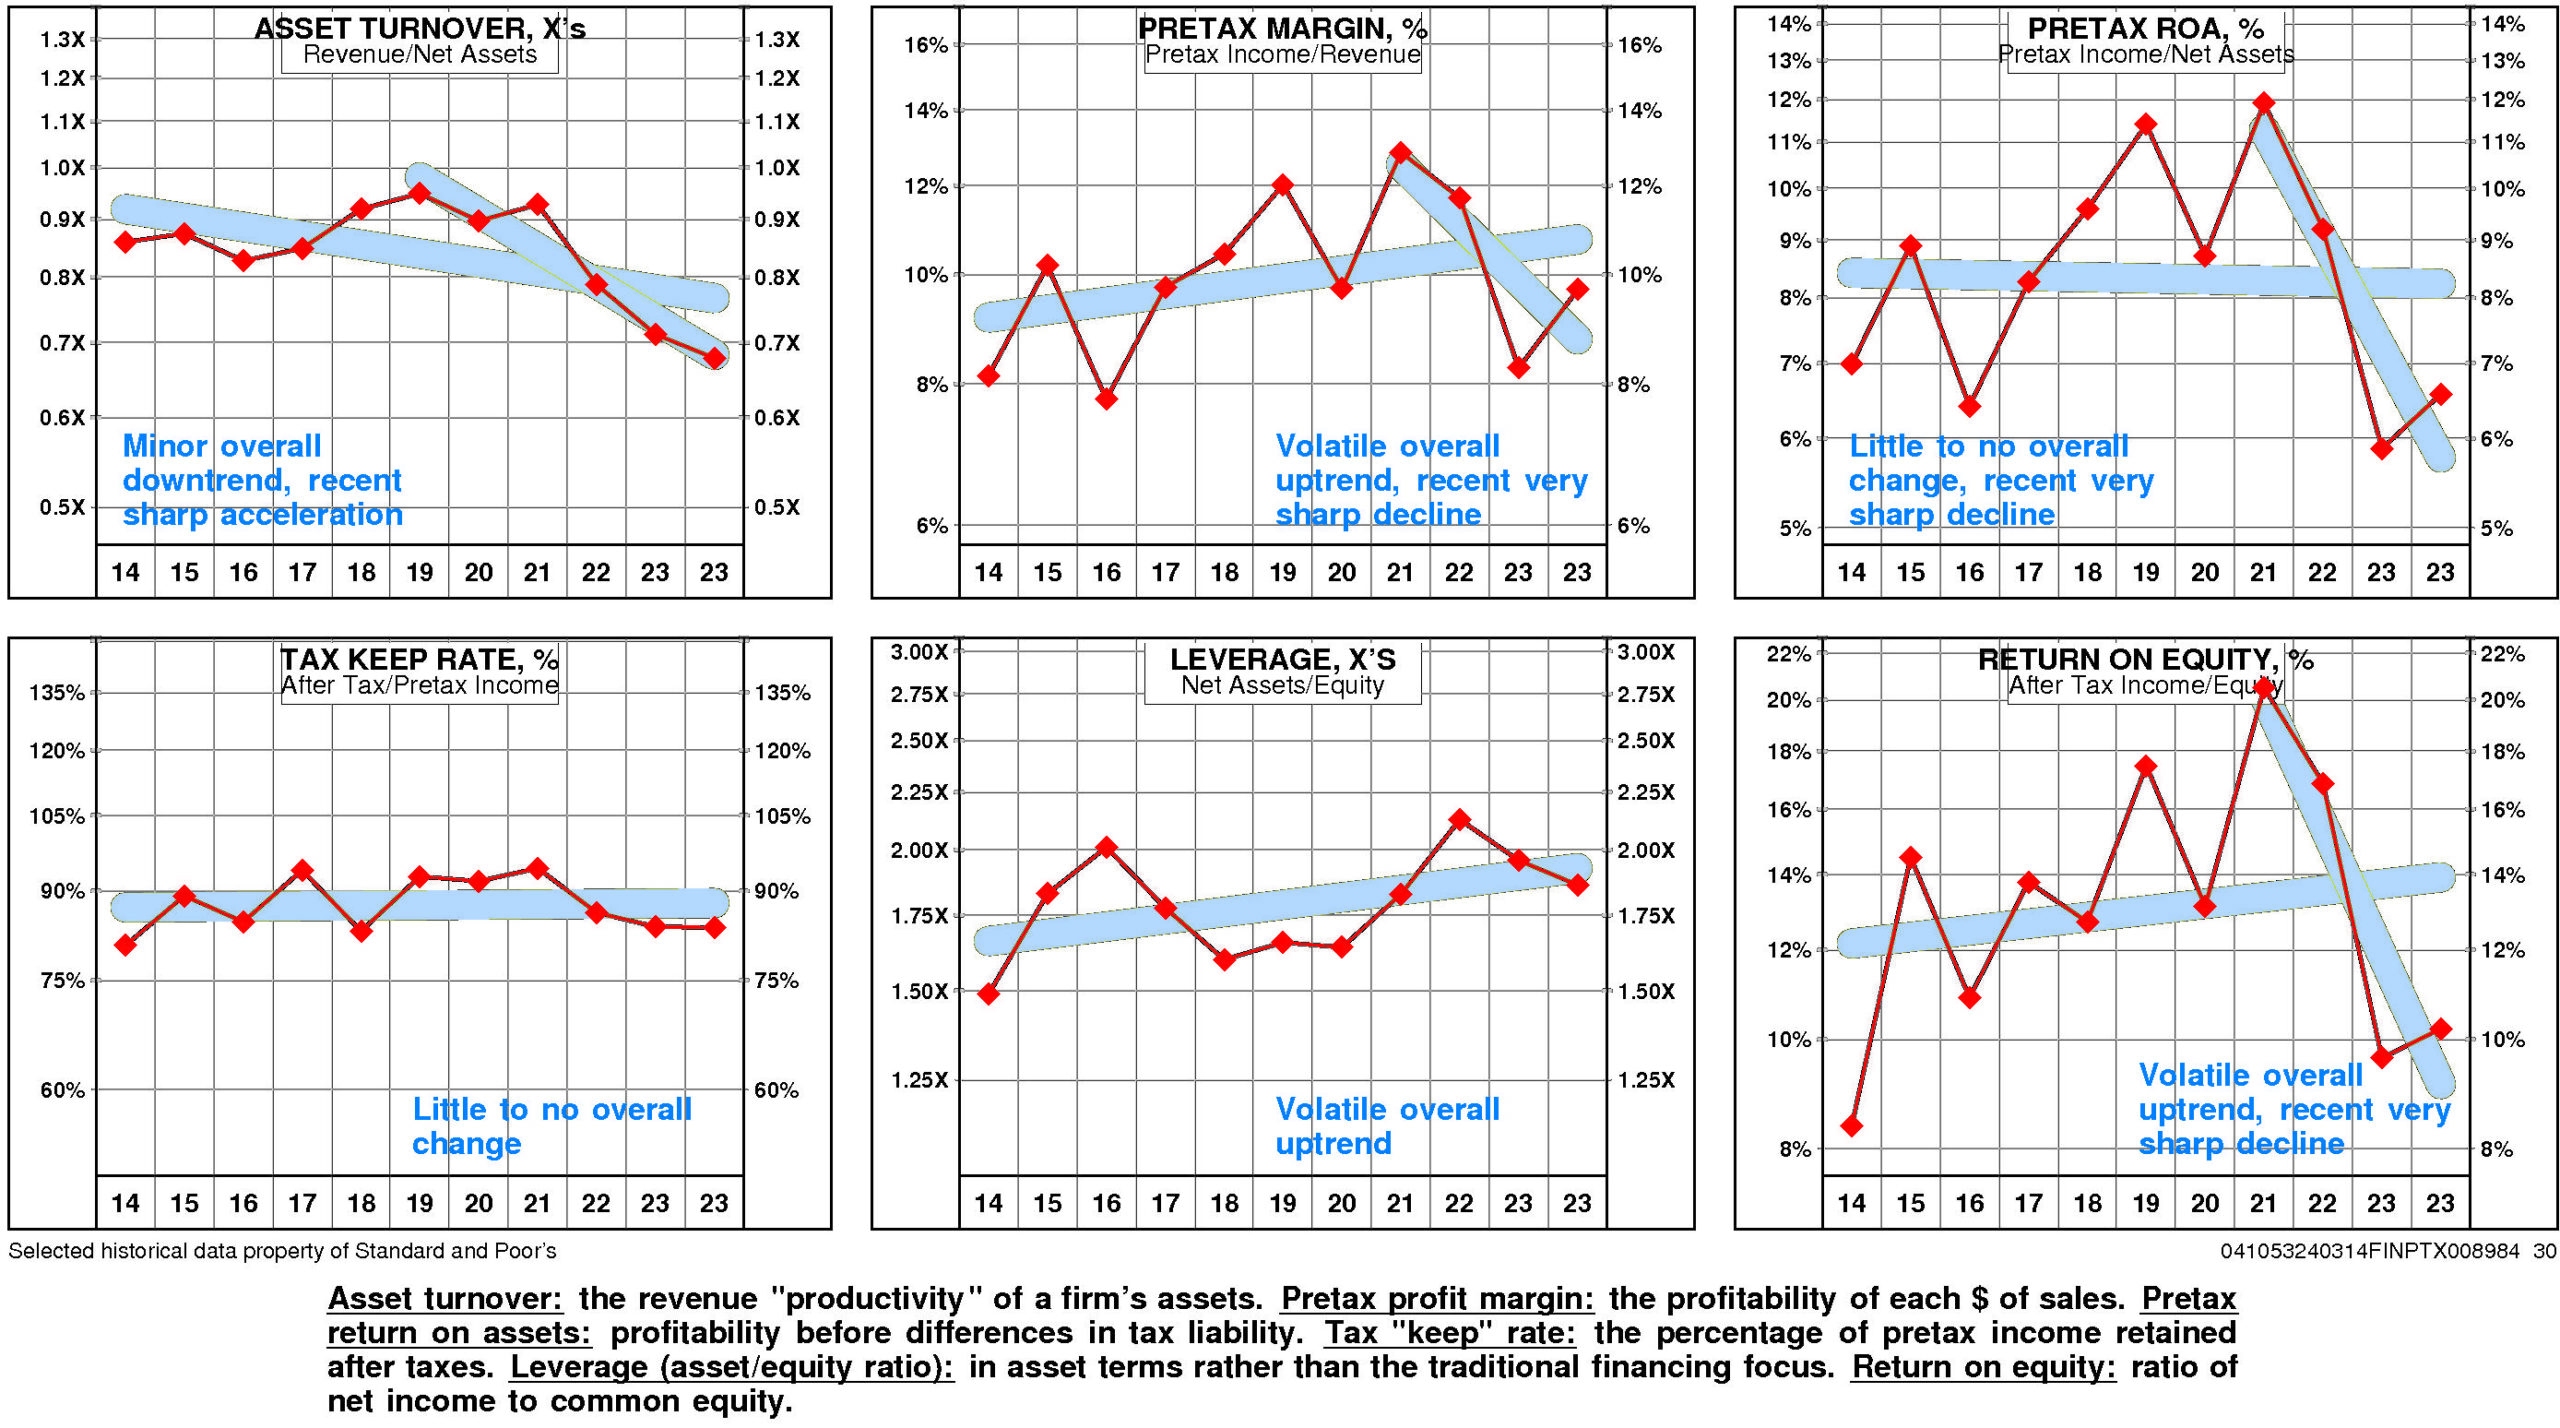
Helen of Troy's return on equity has improved slightly since 2014. The current level of 10.2% is 1.22X the low for the period and is -29.6% from the high.
This slight improvement was due to little change in pretax operating return and small positive trend in non-operating factors.
The productivity of Helen of Troy's assets declined over the full period 2014-2023: asset turnover has experienced a minor downtrend that accelerated sharply after the 2019 level.
Partially offsetting this trend, however, pretax margin has exhibited a volatile overall uptrend but it experienced a very sharp decline after the 2021 high.
Non-operating factors (income taxes and financial leverage) had a minor positive influence on return on equity.
Helen of Troy's return on equity is at the lower quartile (10.2%) for the four quarters ended November, 2023.
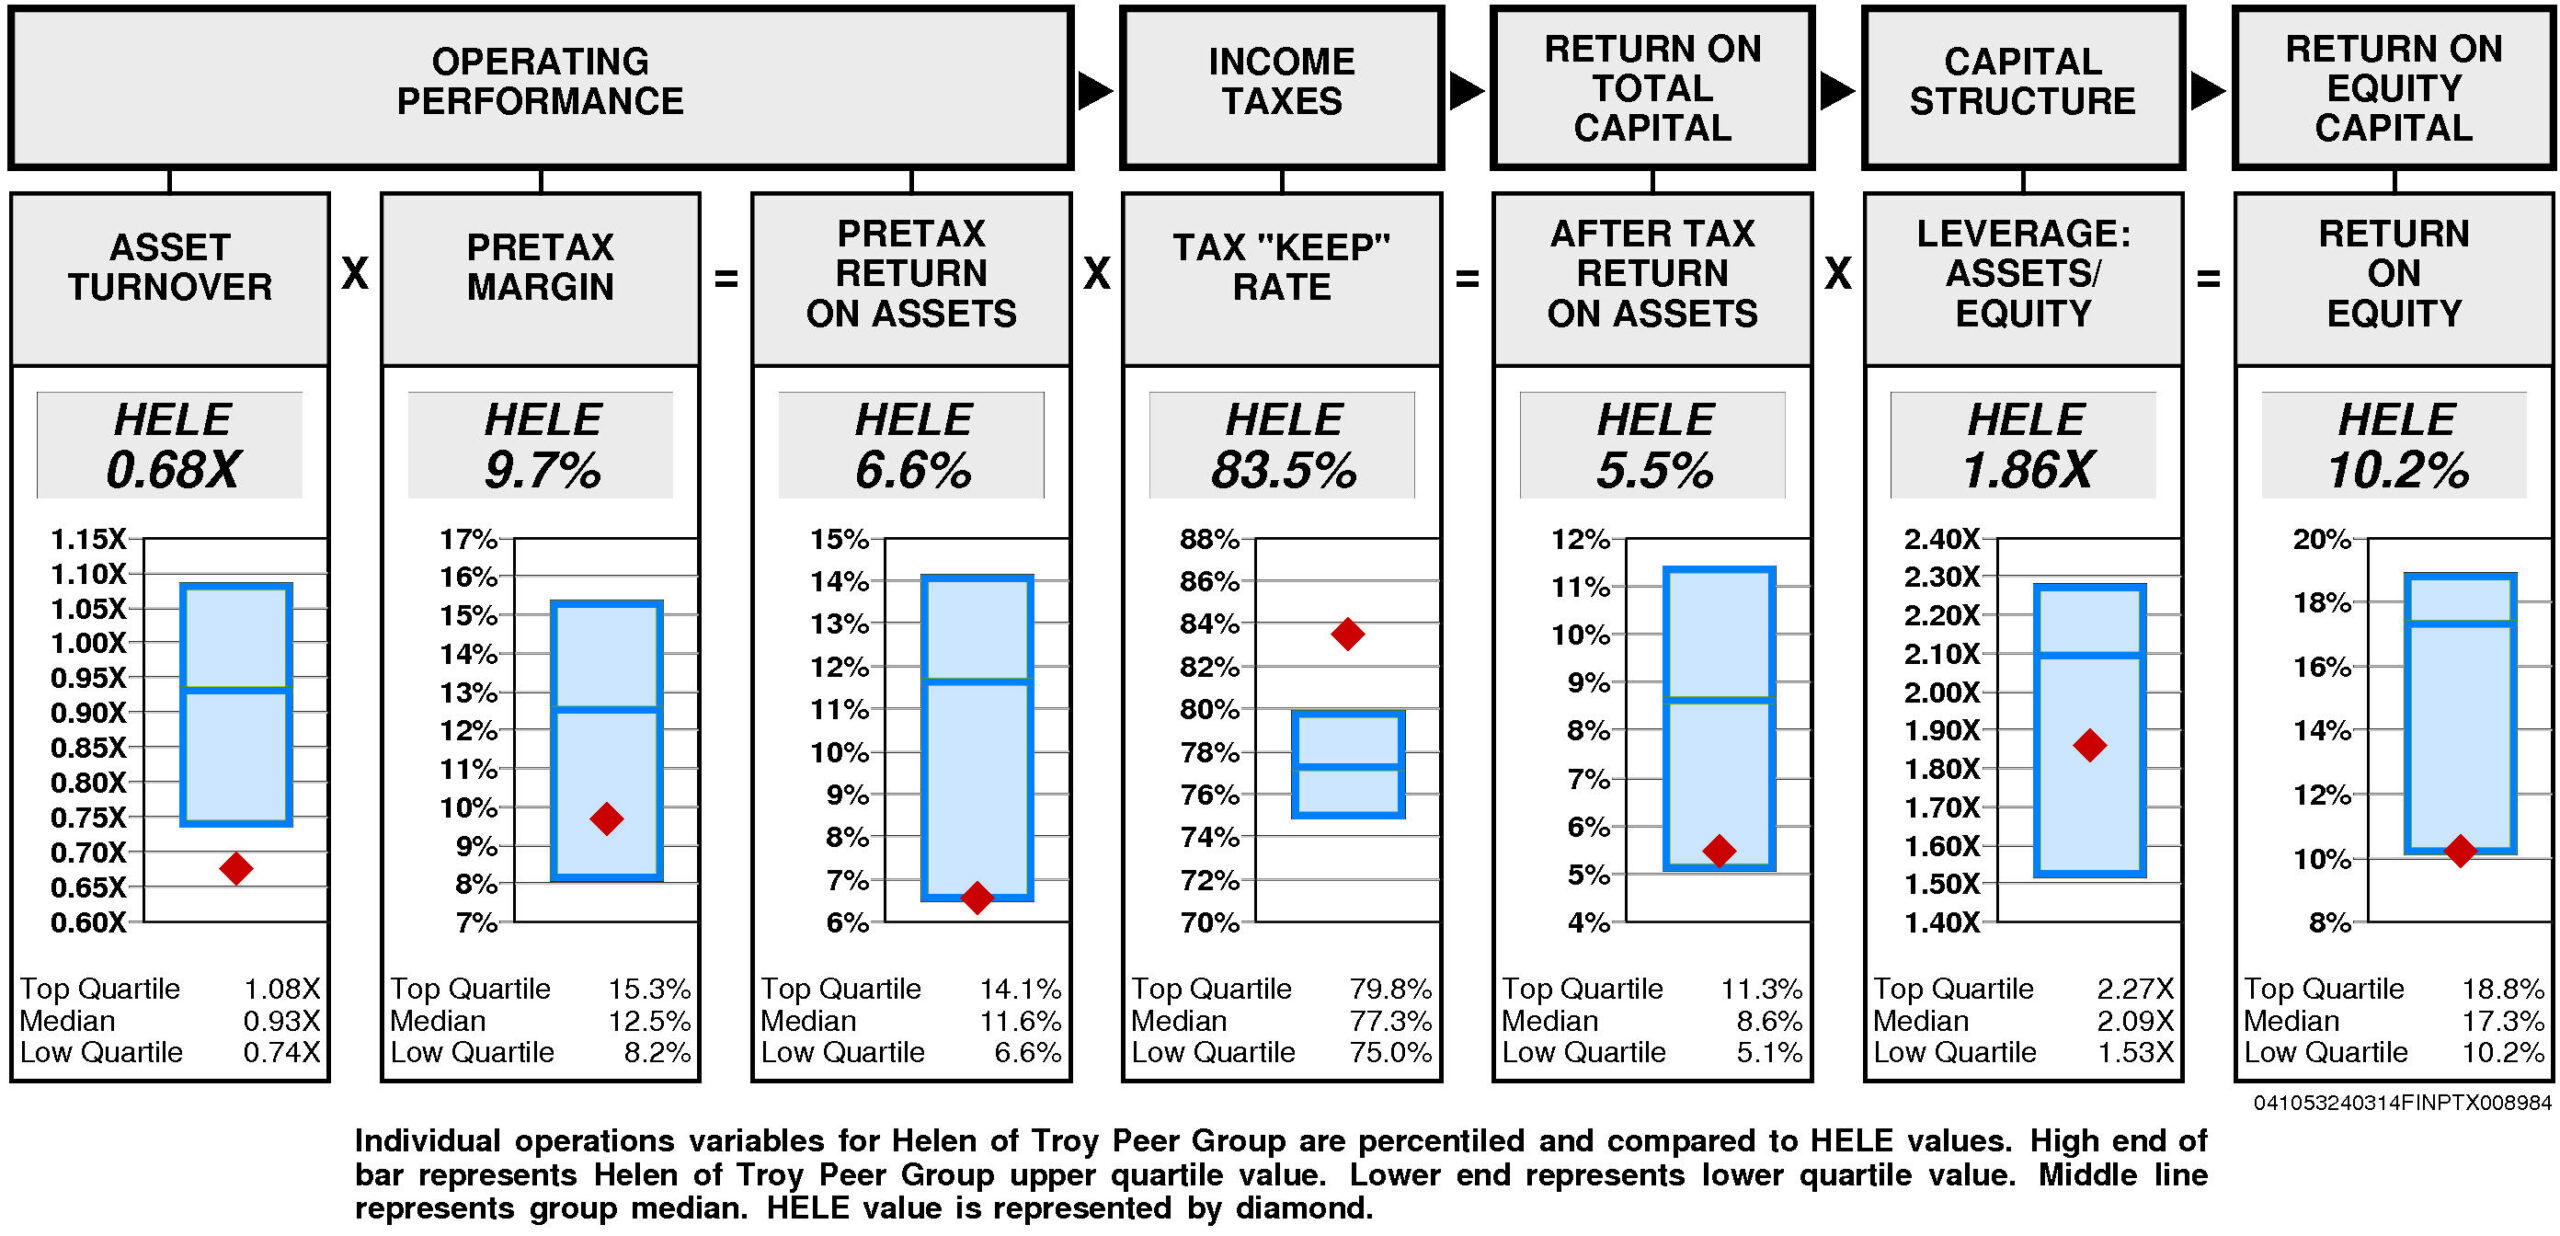
Operating performance (pretax return on assets) is at the lower quartile (6.6%) reflecting asset turnover that is lower quartile (0.68X) and below median pretax margin (9.7%).
Tax “keep” rate (income tax management) is upper quartile (83.5%) resulting in after tax return on assets that is substantially below median.
Financial leverage (leverage) is below median (1.86X).
GROWTH RATES
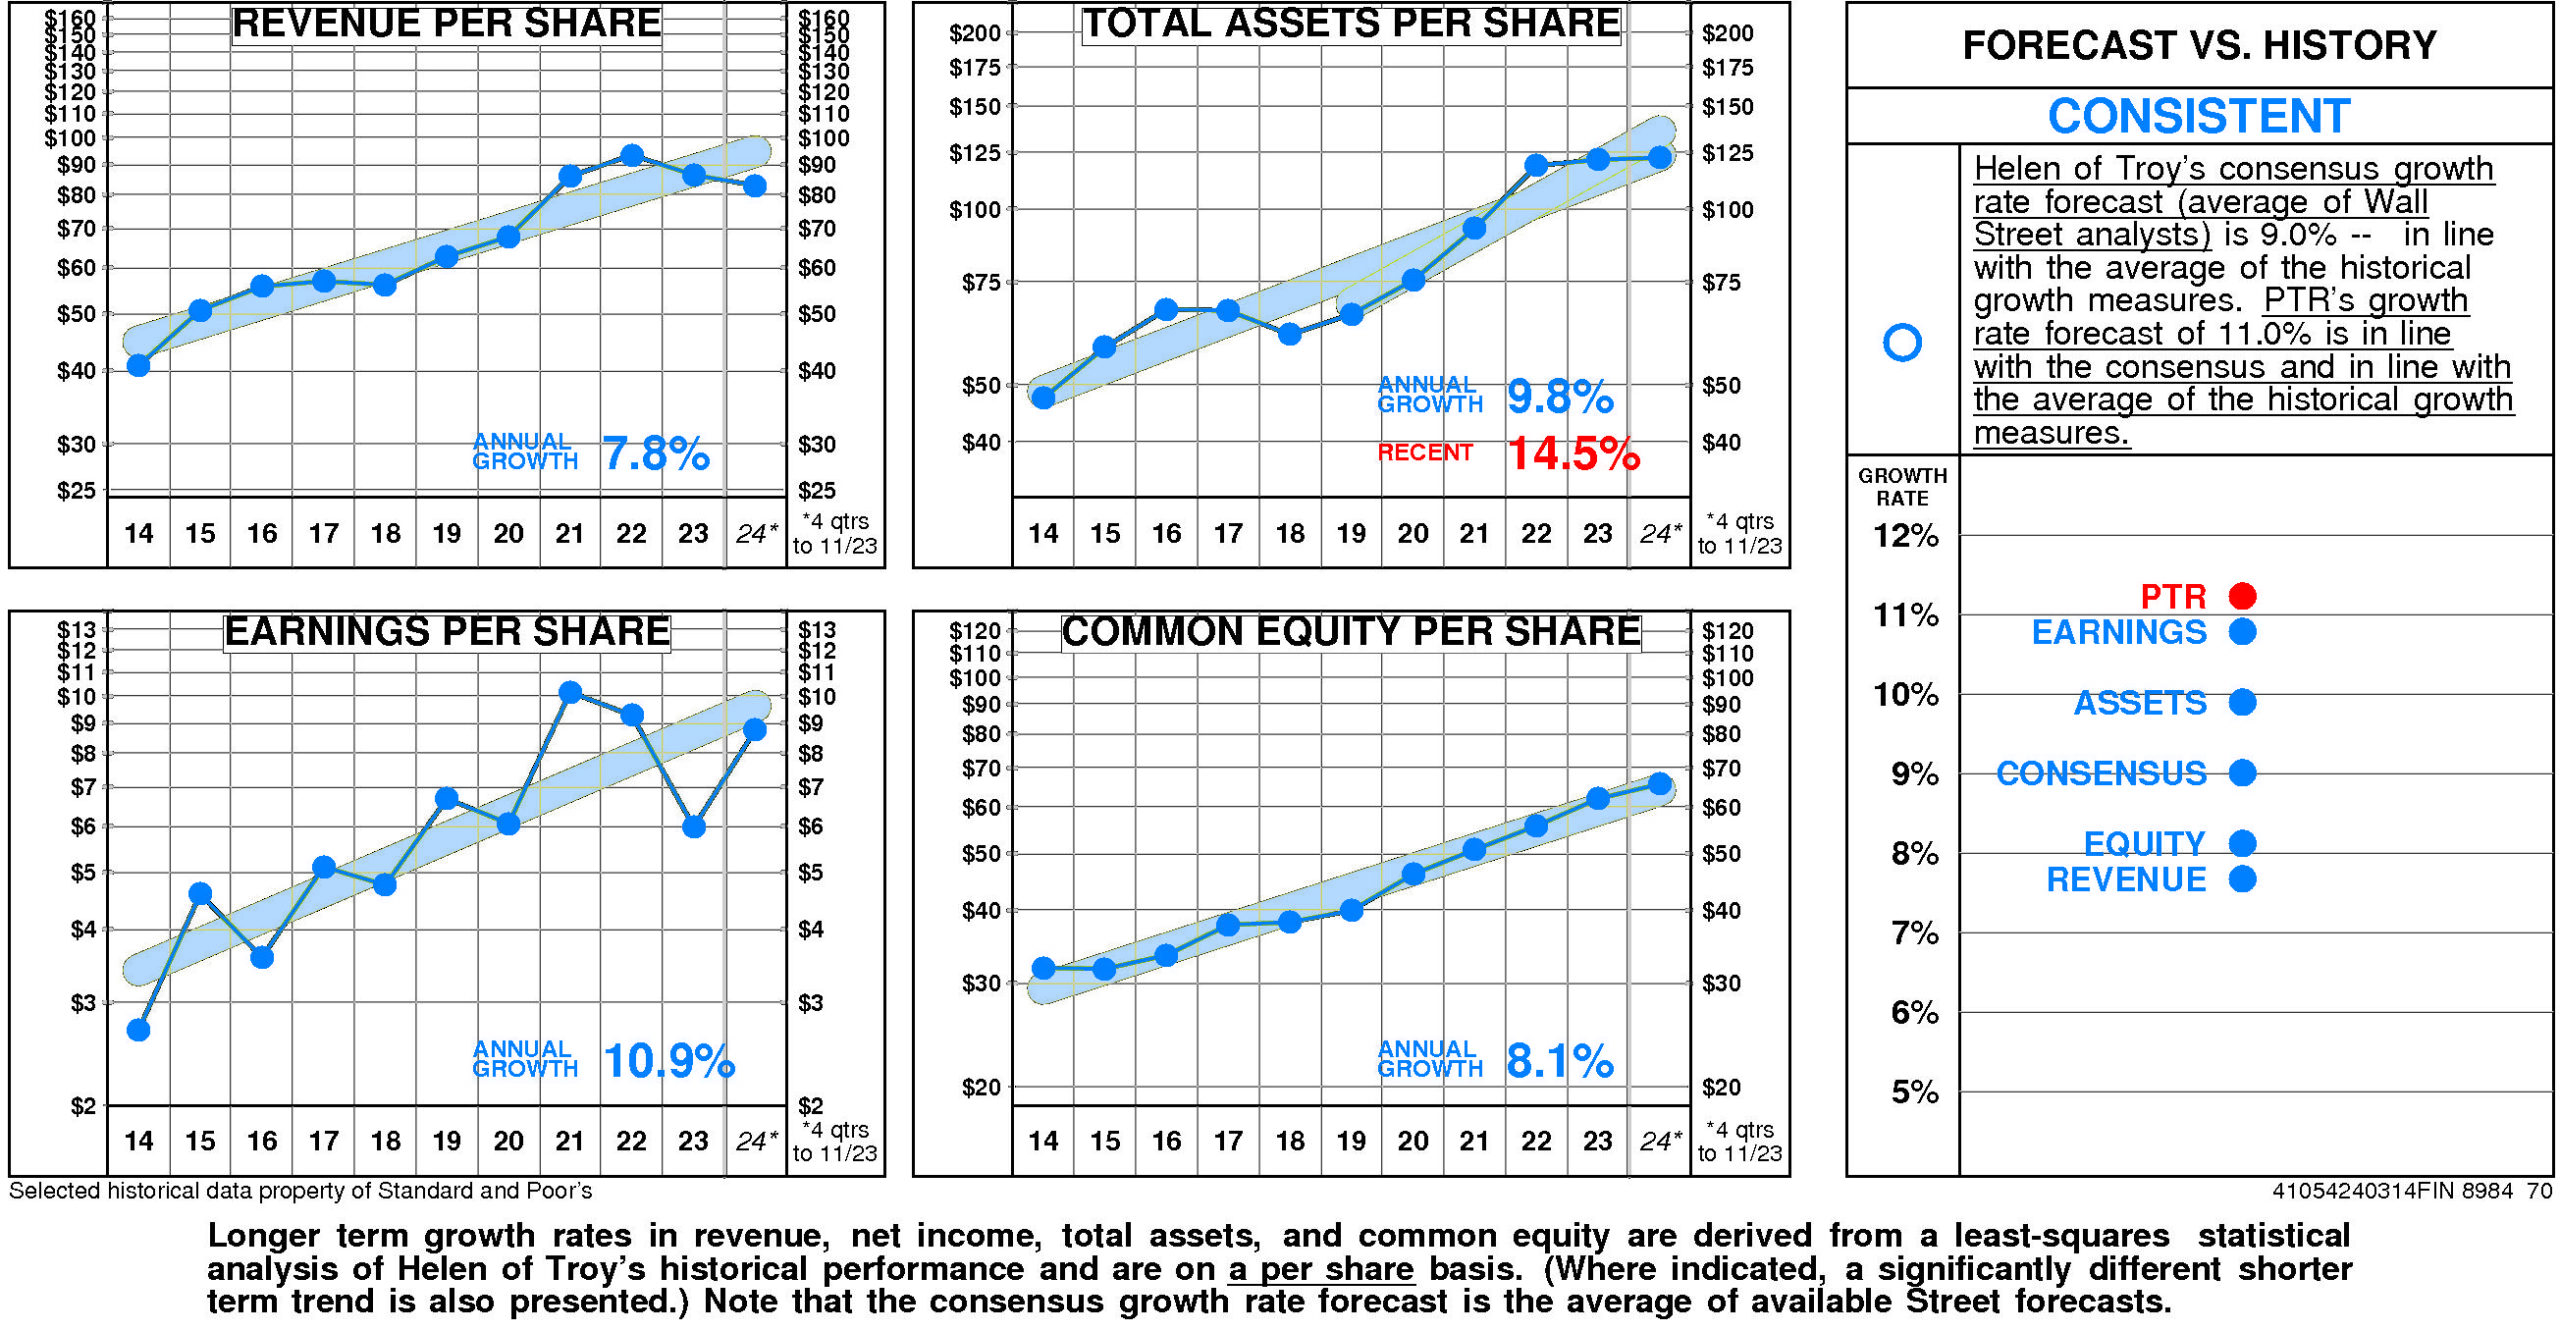
There are no significant differences between Helen of Troy's longer term growth and growth in recent years.
Helen of Troy's historical income statement growth has been in line with balance sheet growth. Revenue growth has paralleled asset growth; earnings growth has paralleled equity growth.
Annual revenue growth
has been 7.8% per year.
Total asset growth
has been 9.8% per year. (More recently it has been 14.5%.)
Annual E.P.S. growth
has been 10.9% per year.
Equity growth
has been 8.1% per year.
Helen of Troy's consensus growth rate forecast (average of Wall Street analysts)
is 9.0% — in line with the average of the historical growth measures.
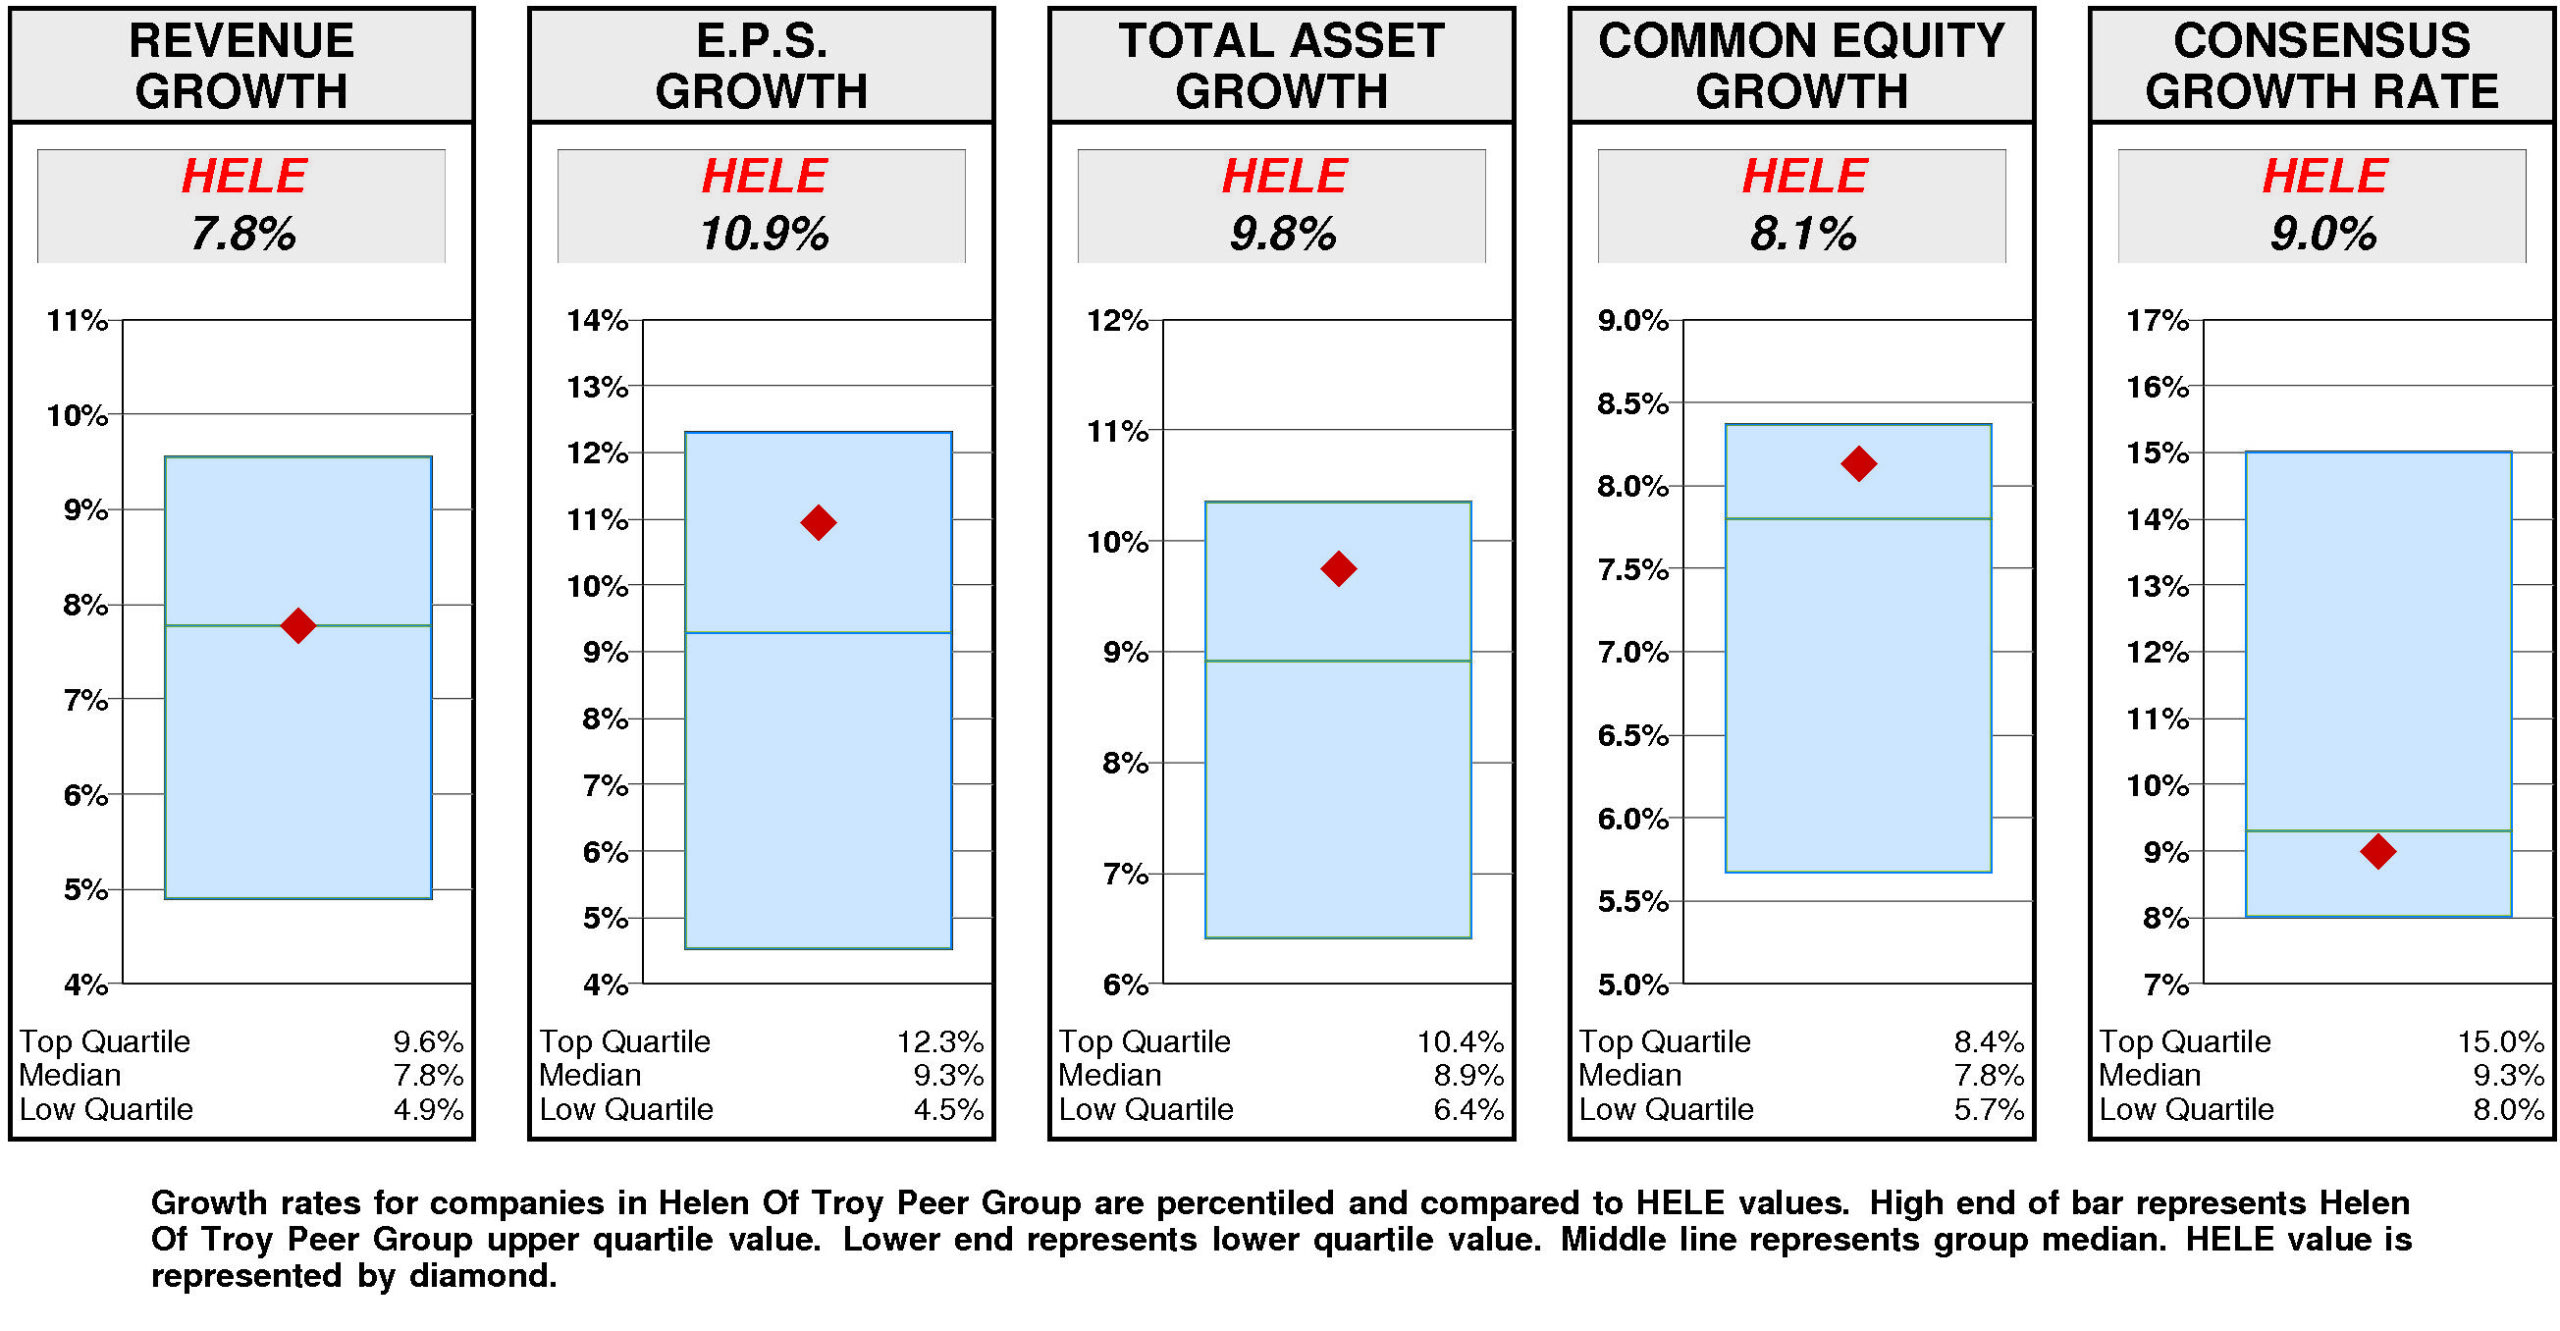
Relative to the Helen Of Troy Peer Group, Helen of Troy's historical growth measures are consistently second quartile.
E.P.S. growth (10.9%) has been above median. Total asset growth (9.8%) has been above median. Equity growth (8.1%) has been above median. Revenue growth (7.8%) has been at median.
In agreement with this pattern, consensus growth forecast (9.0%) is slightly below median.
PRICE HISTORY
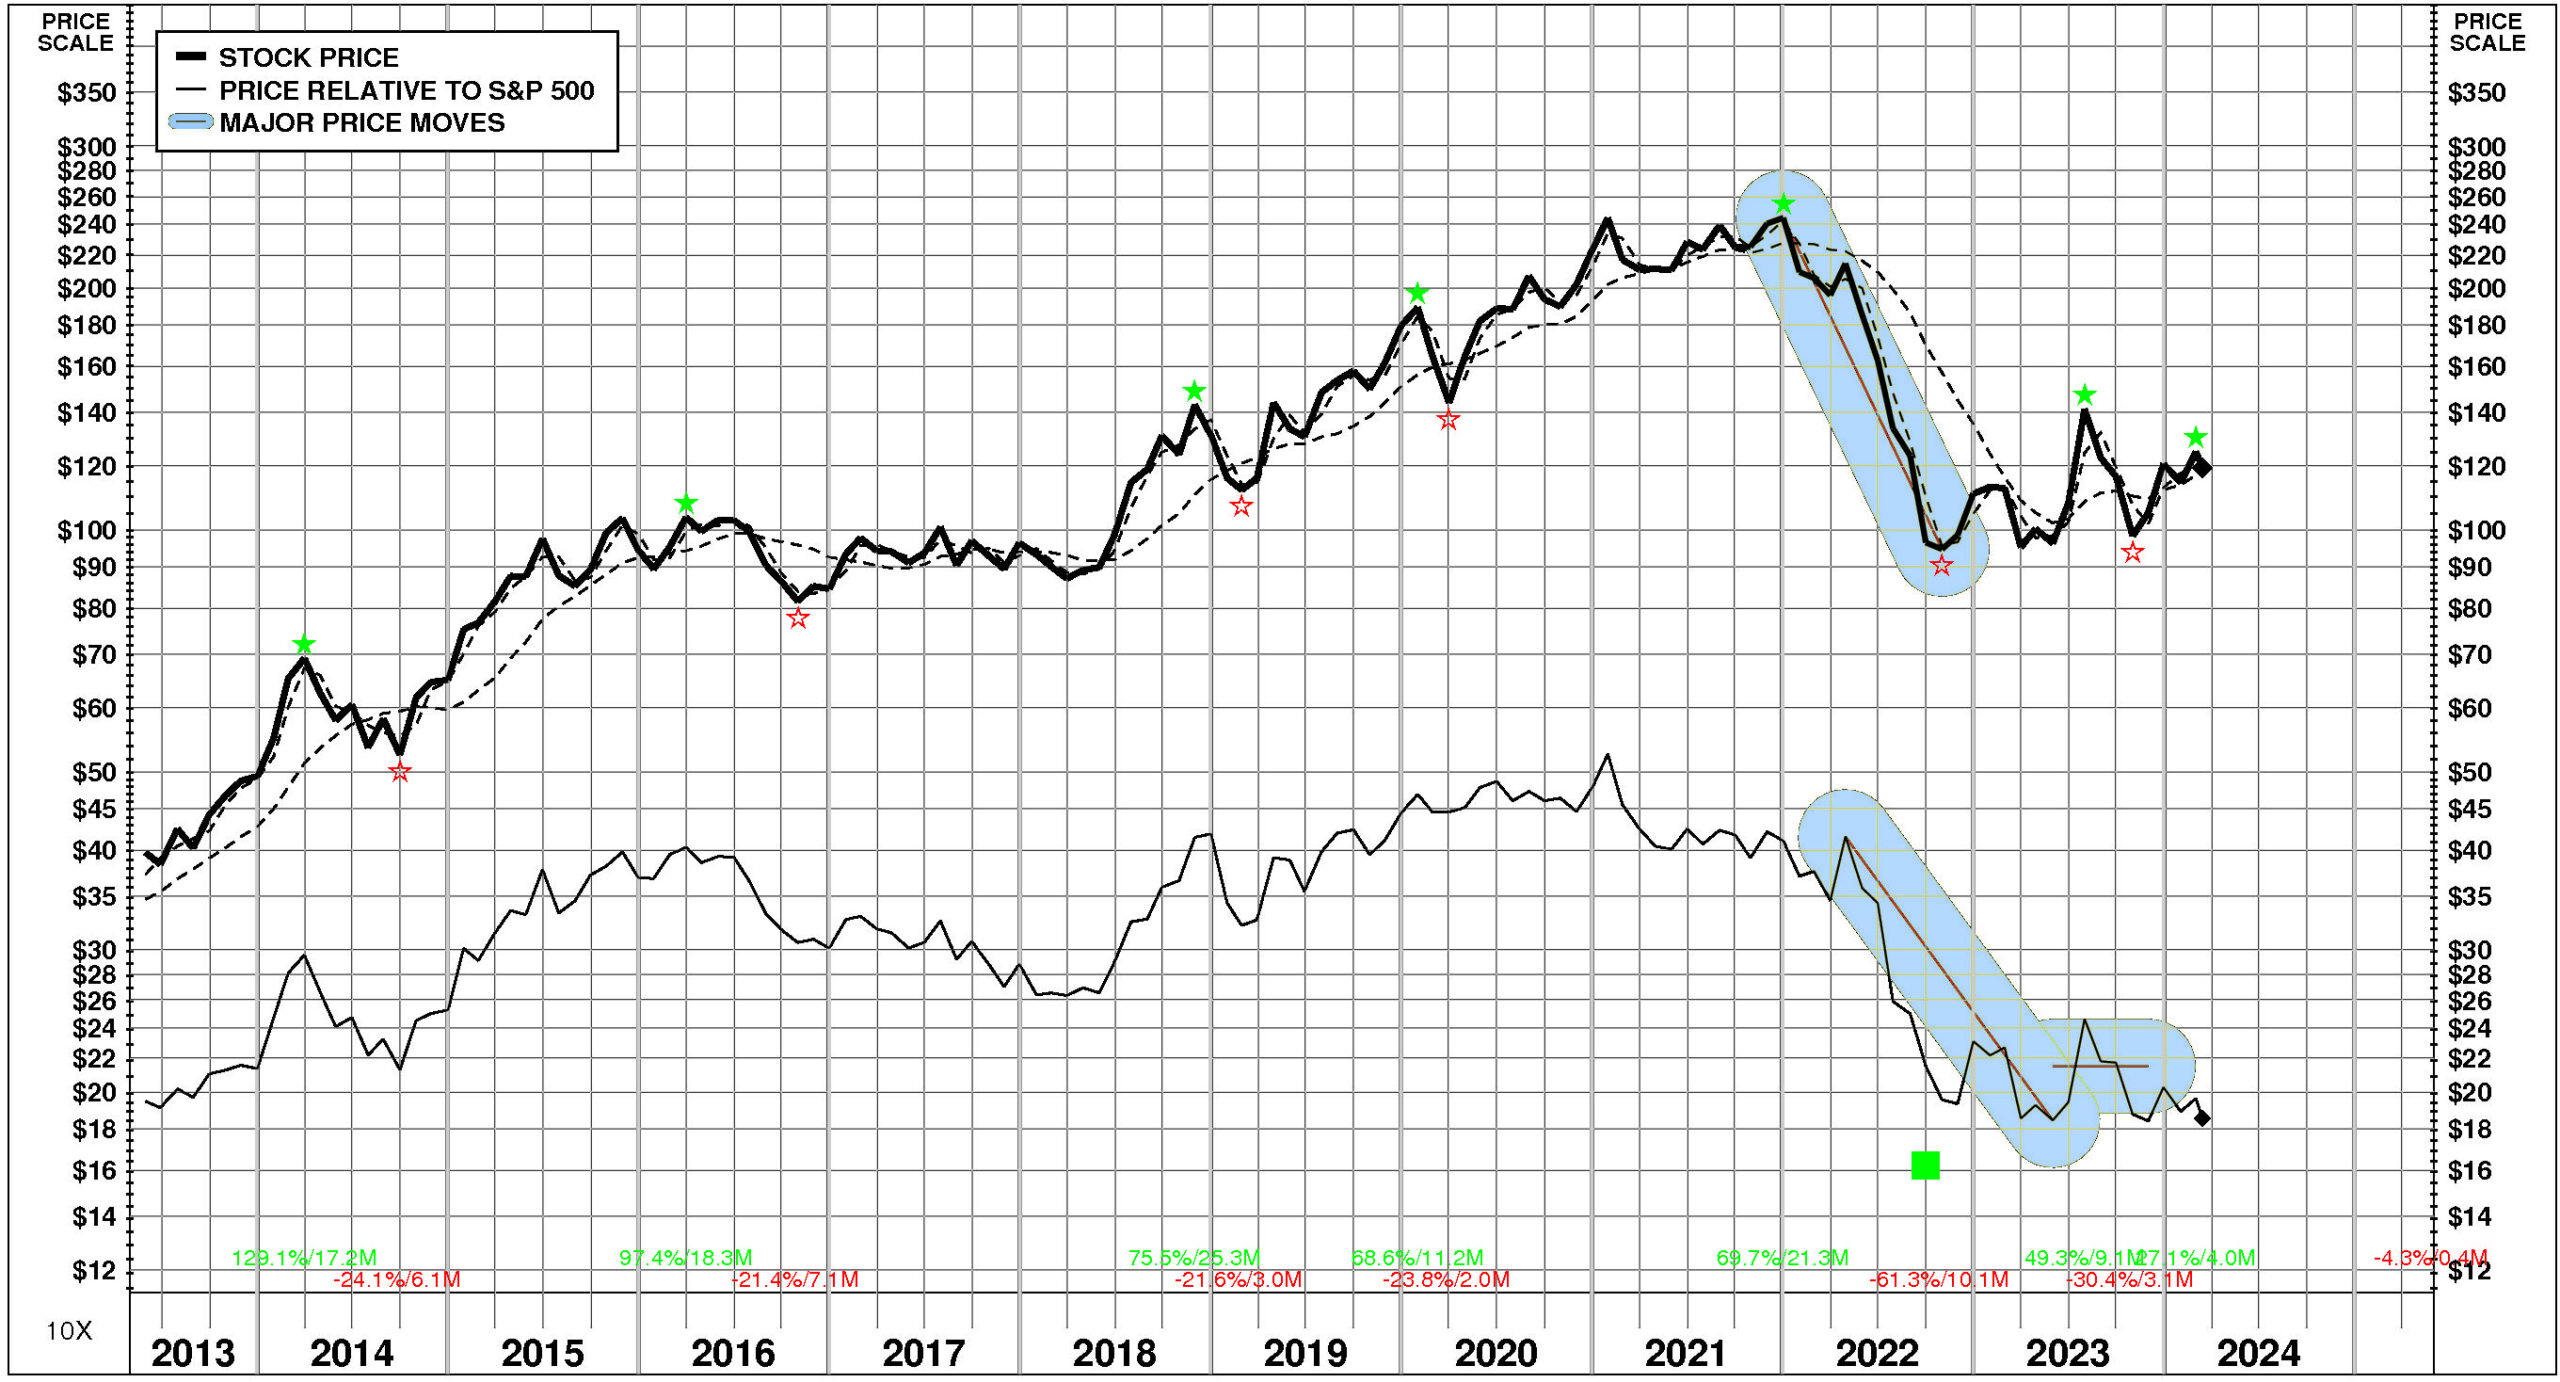
Over the full time period, Helen of Troy's stock price performance has been variable and in line with the market.
Between May, 2013 and March, 2024, Helen of Troy's stock price rose +202%; relative to the market, this was a -5% loss. Significant price move during the period: 1) December, 2021 – October, 2022: -61%.
TOTAL INVESTMENT RETURNS
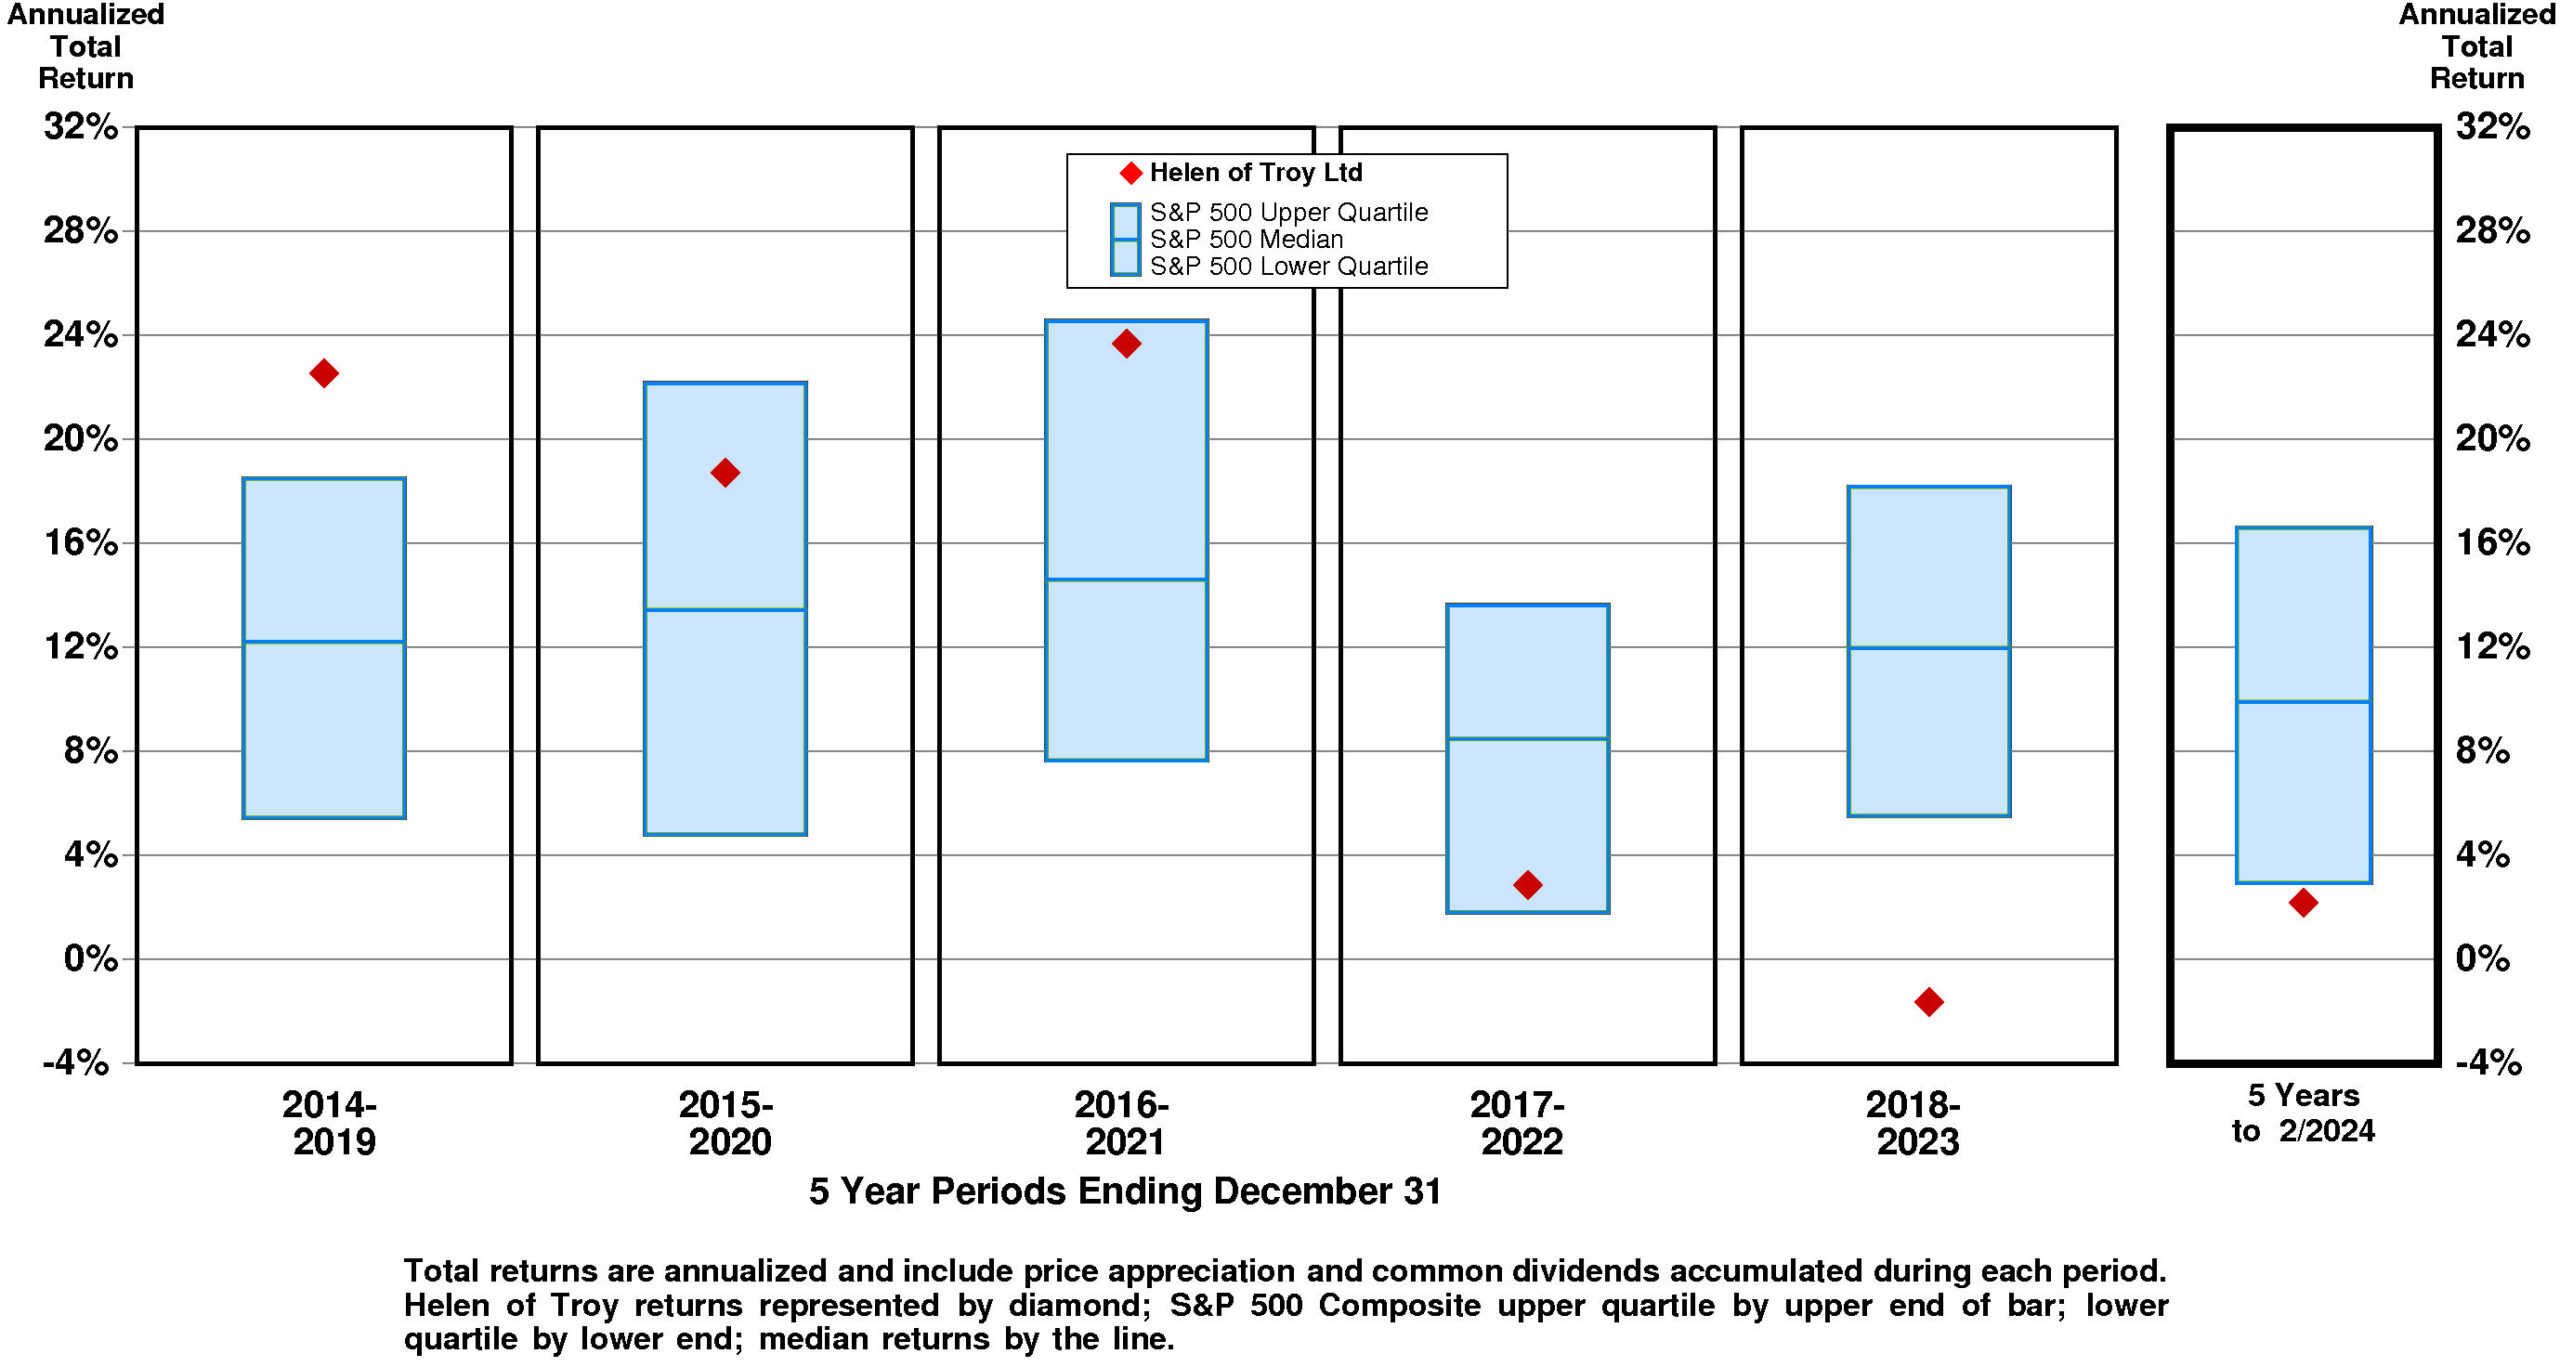
Current annual total return performance of 10.9% is at median relative to the S&P 500 Composite.
In addition to being at median relative to S&P 500 Composite, current annual total return performance through February, 2024 of 10.9% is below median relative to Helen of Troy Ltd Peer Group.
Current 5-year total return performance of 2.2% is lower quartile relative to the S&P 500 Composite.
Through February, 2024, with lower quartile current 5-year total return of 2.2% relative to S&P 500 Composite, Helen of Troy's total return performance is substantially below median relative to Helen of Troy Ltd Peer Group.
VALUATION BENCHMARKS
Relative to S&P 500 Composite, HELE's overall valuation is quite low.
The highest factor, the ratio of enterprise value/assets, is below median. Price/earnings ratio is below median. Ratio of enterprise value/earnings before interest and taxes is lower quartile. Price/equity ratio is lower quartile. The lowest factor, the ratio of enterprise value/revenue, is lower quartile.
Relative to Helen of Troy Peer Group, HELE's overall valuation is low.
The highest factor, the ratio of enterprise value/revenue, is at median. Ratio of enterprise value/earnings before interest and taxes is below median. Price/earnings ratio is near the lower quartile. Ratio of enterprise value/assets is lower quartile. The lowest factor, the price/equity ratio, is lower quartile.
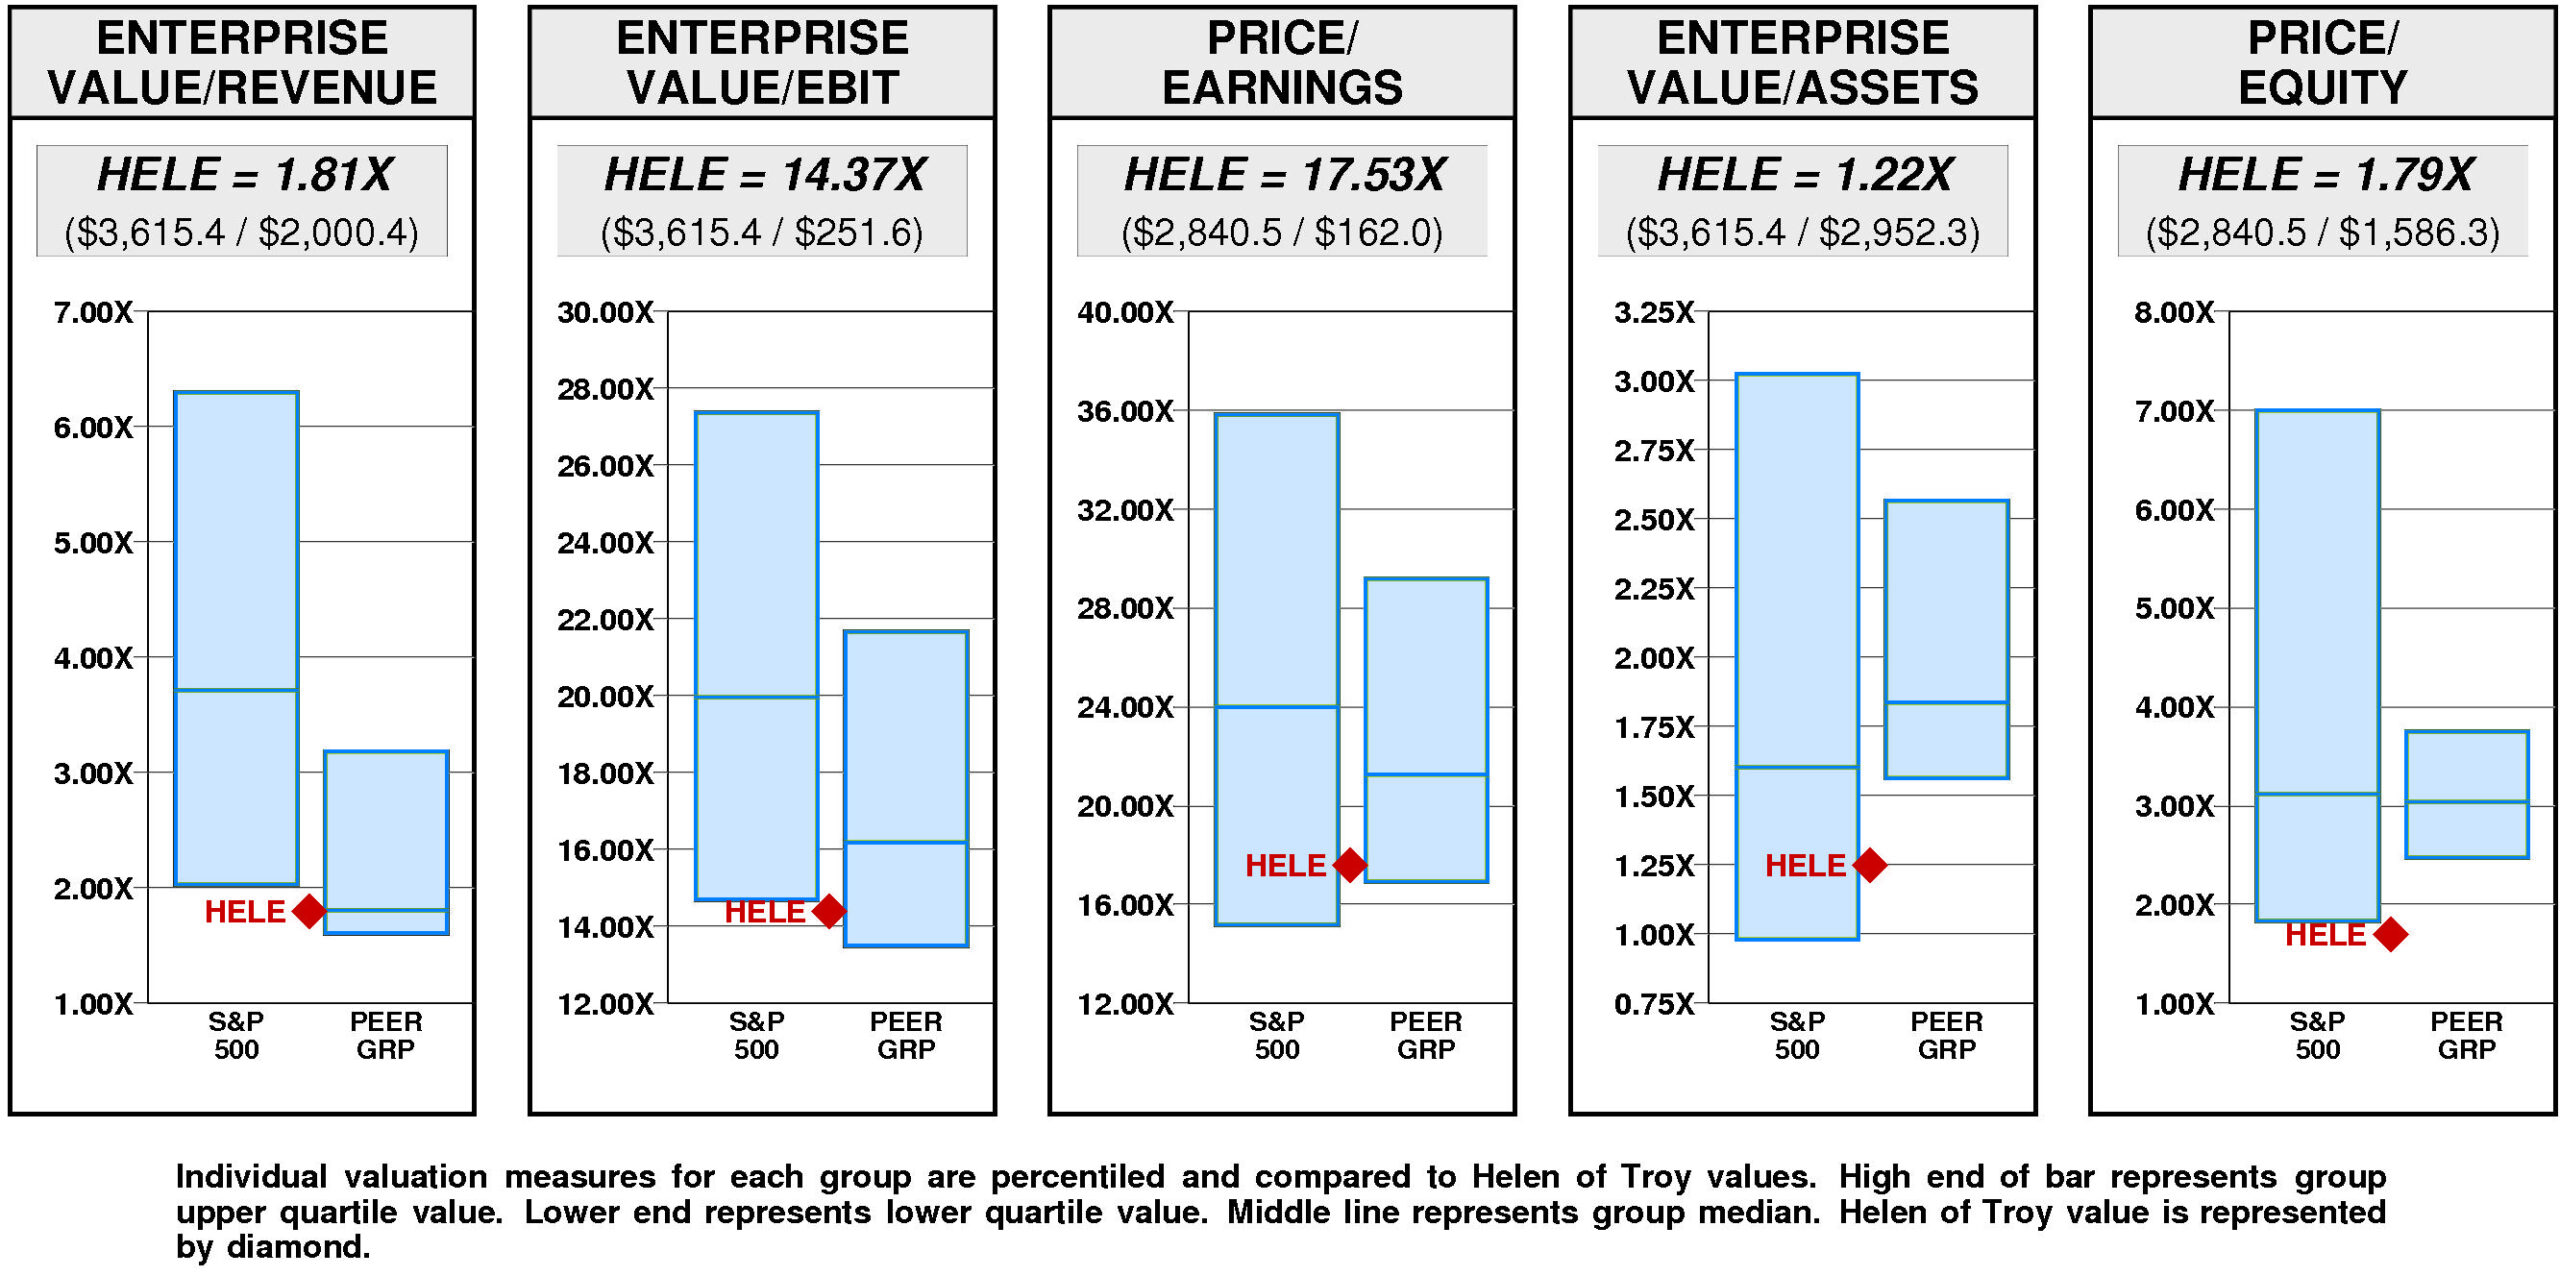
Helen of Troy has a large value gap compared to median valuation.
For HELE to fall to lower quartile valuation, its current ratio of enterprise value/revenue would have to decline from the current level of 1.81X to 1.61X. If HELE's ratio of enterprise value/revenue were to decline to 1.61X, its stock price would be lower by $-17 to $103.
For HELE to achieve upper quartile valuation relative to the Helen of Troy Peer Group, its current ratio of enterprise value/revenue would have to rise from the current level of 1.81X to 3.18X. If HELE's ratio of enterprise value/revenue were to rise to 3.18X, its stock price would increase by $116 from the current level of $120.
VALUE TARGETS
HELE is expected to continue to be a Value Builder reflecting capital returns that are forecasted to exceed the cost of capital.
Helen of Troy's current Price Target of $209 represents a +75% change from the current price of $119.62.
This moderately high appreciation potential results in an appreciation score of 62 (only 38% of the universe has greater appreciation potential.)
Reinforcing this moderately high Appreciation Score of 62, the neutral Power Rating of 59 contributes to an Value Trend Rating of C.
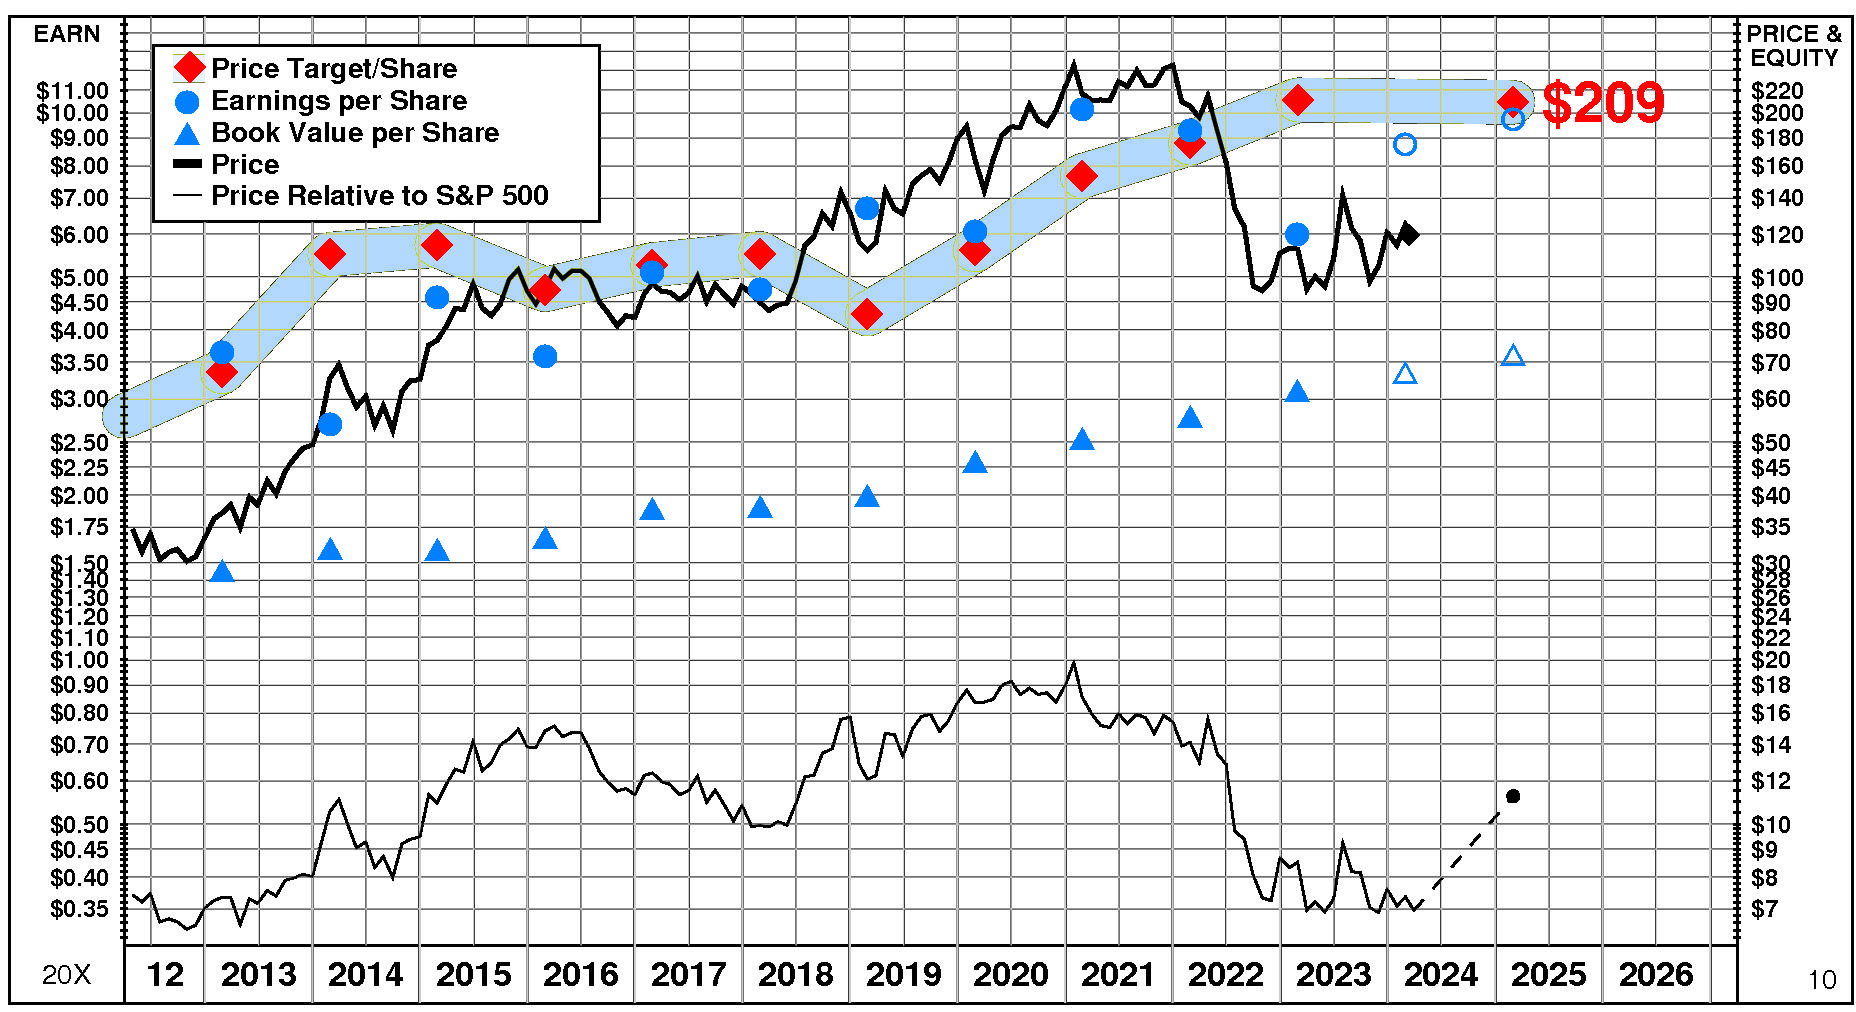
Helen of Troy's current Price Target is $209 (-1% from the 2023 Target of $211 but +75% from the 03/13/24 price of $119.62).
This plateau in the Target is the result of a +14% increase in the equity base and a -13% decrease in the price/equity multiple. The forecasted decline in return on equity has a very large negative impact on the price/equity multiple and the forecasted decline in growth has a slight negative impact as well. Partially offsetting these Drivers, the forecasted decline in cost of equity has a very large positive impact.
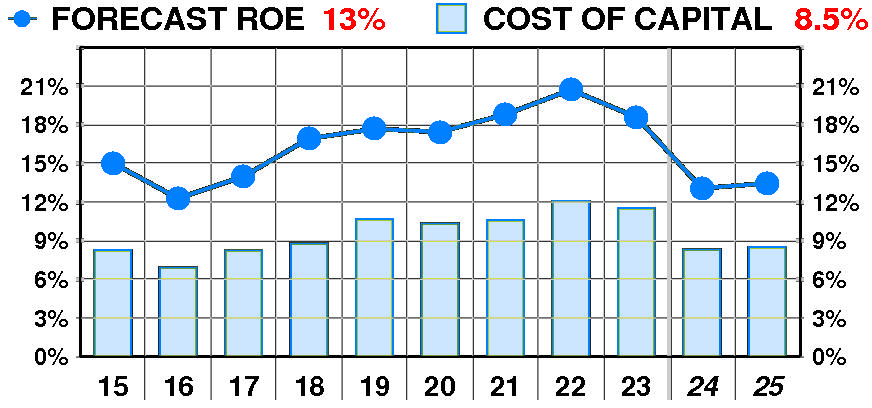
PTR's return on equity forecast is 13.4% — below our recent forecasts.
Forecasted return on equity enjoyed a dramatic, variable increase between 2015 and 2023. The current forecast is steady at the 2015 peak of 15%.
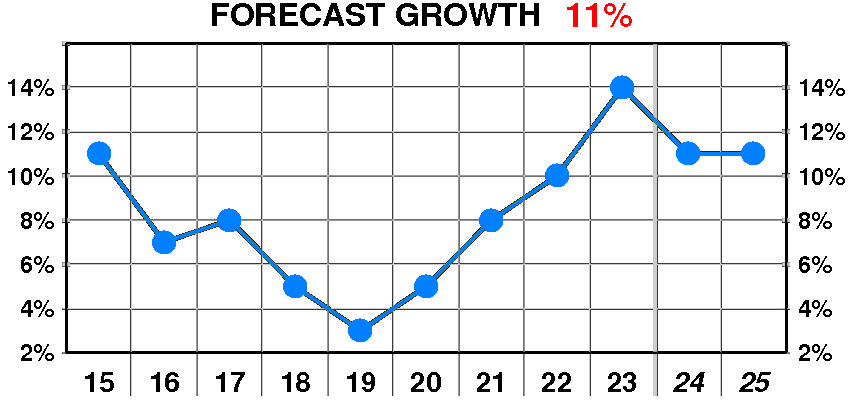
PTR's growth forecast is 11.0% — slightly below our recent forecasts.
Forecasted growth enjoyed a dramatic, erratic increase between 2015 and 2023. The current forecast is well above the 2019 low of 3%.
PTR's cost of equity forecast is 8.5% — slightly below recent levels.
Forecasted cost of equity suffered a dramatic, steady increase between 2015 and 2023. The current forecast is steady at the 2016 low of 6.9%.
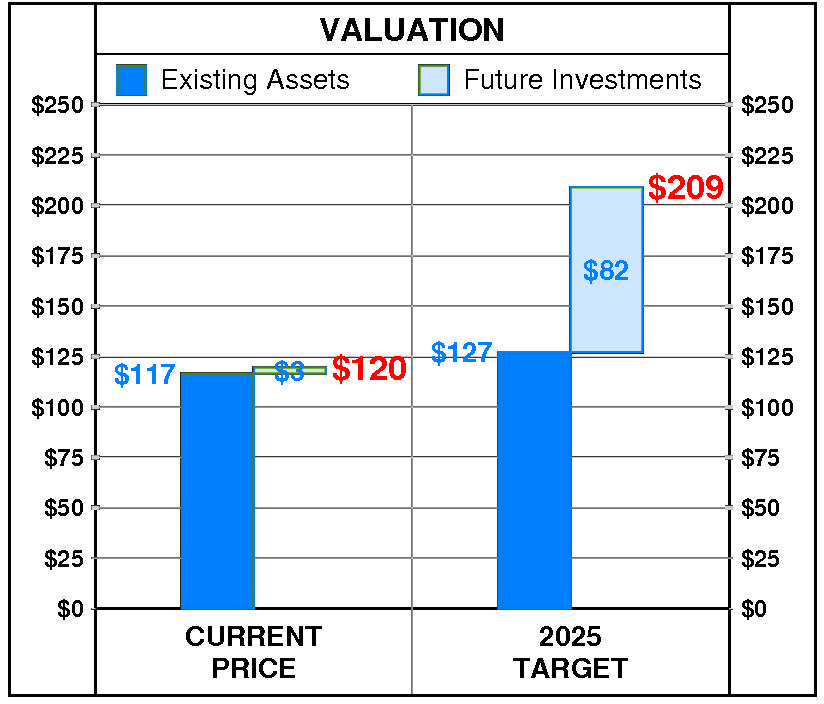
At Helen of Troy's current price of $119.62, investors are placing a positive value of $3 on its future investments. This view is consistent with the company's most recent performance that reflected a growth rate of 14.0% per year, and a return on equity of 18.6% versus a cost of equity of 11.5%.
PTR's 2025 Price Target of $209 is based on these forecasts and reflects an estimated value of existing assets of $127 and a value of future investments of $82.