![]()
BUSINESS
Power Integrations, Inc. designs, develops, manufactures, and markets analog and mixed-signal integrated circuits (ICs), and other electronic components and circuitry used in high-voltage power conversion worldwide. The company provides a range of alternating current to direct current power conversion products that address power supply ranging from less than one watt of output to approximately 500 watts of output for mobile-device chargers, consumer appliances, utility meters, LCD monitors, main and standby power supplies for desktop computers and TVs, LED lighting, and various other consumer and industrial applications, as well as power conversion in high-power applications comprising industrial motors, solar and wind-power systems, electric vehicles, and high-voltage DC transmission systems.

INVESTMENT RATING

POWI is expected to continue to be an important Value Builder reflecting capital returns that are forecasted to be above the cost of capital.
Power Integrations has a current Value Trend Rating of F (Lowest Rating).
This rating combines consistent signals from two proprietary PTR measures of a stock’s attractiveness. Power Integrations has a poor Power Rating of 28 and a very low Appreciation Score of 8, triggering the Lowest Value Trend Rating.
Power Integrations’ stock is selling significantly above targeted value. The current stock price of $70.14 compares to targeted value 12 months forward of $28.
Power Integrations’ very low appreciation potential results in an appreciation score of 8 (92% of the universe has greater appreciation potential.)

Power Integrations has a Power Rating of 28. (This poor Power Rating indicates that POWI only has a better chance of achieving attractive investment performance over the near to intermediate term than 28% of companies in the universe.)
Factors contributing to this poor Power Rating include: the Semiconductor, Related Devices comparison group is currently in an unfavorable position; recent price action has been slightly unfavorable; and earnings estimate behavior for POWI has been slightly negative recently.
INVESTMENT PROFILE
POWI’s financial strength is high. Financial strength rating is 72.
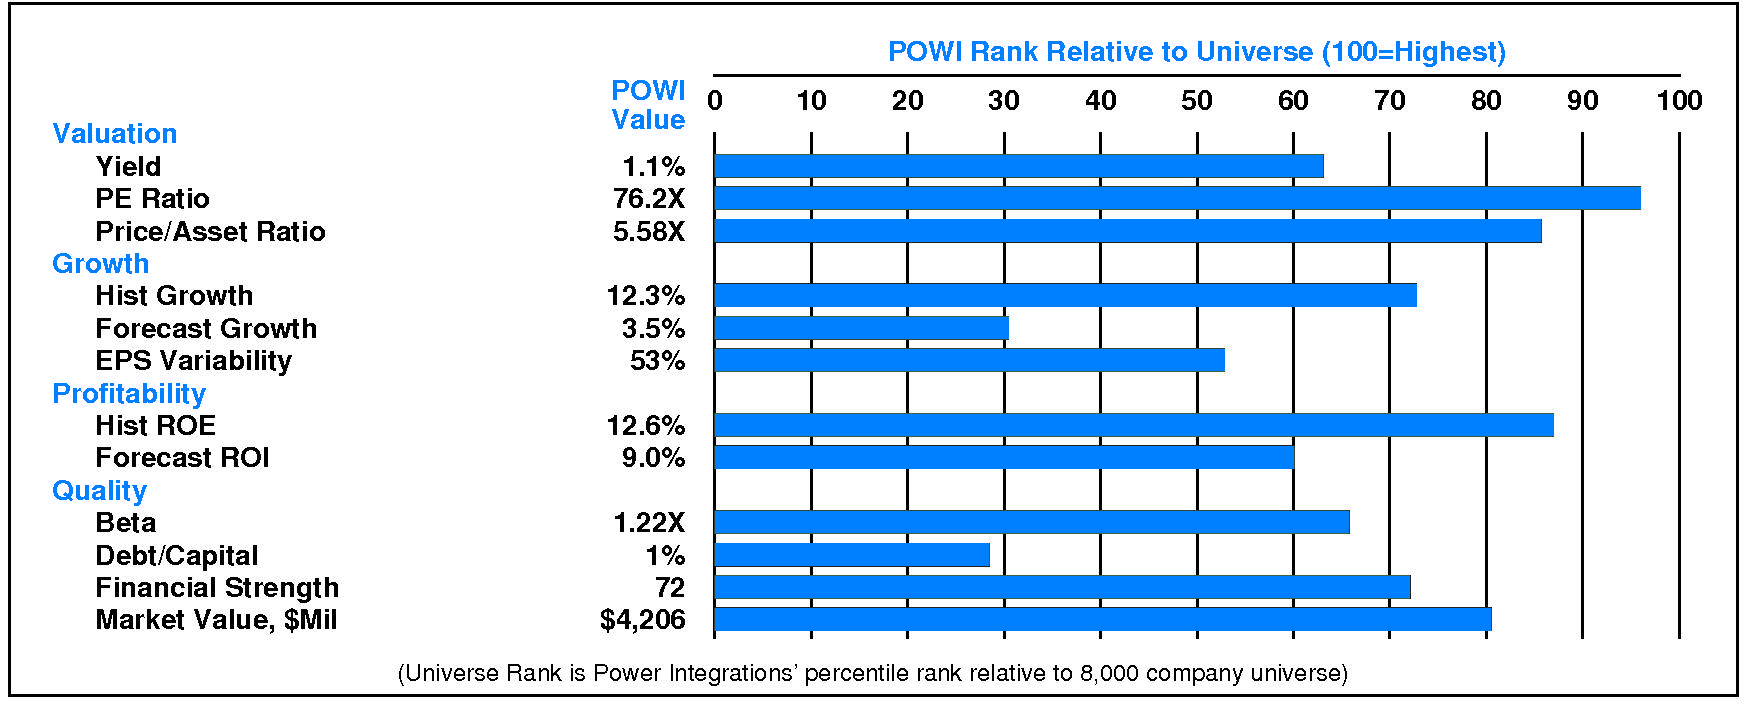
Relative to the S&P 500 Composite, Power Integrations Inc has neutral Growth/Value characteristics; its appeal is likely to be to Capital Gain-oriented investors; the perception is that POWI is normal risk. Low financial leverage is a positive for POWI. Relative weaknesses include: low forecasted profitability, and low expected growth. POWI’s valuation is moderate: moderate dividend yield, high P/E ratio, and moderate price/book ratio. POWI has unusually low market capitalization.
CURRENT SIGNALS
Power Integrations’ current operations are eroding. Return on equity is falling, reflecting: falling asset utilization; declining pretax margin; and falling leverage.
Power Integrations’ current technical position is very weak. The stock price is in a 2.3 month down move. The stock has declined 14.6% from its prior high. The stock price is below its 200 day moving average which is in a downtrend.
ALERTS
Positive development: significant quarterly earnings acceleration occurred. Negative development: significant quarterly sales deceleration occurred.
The stock is currently rated F.
On 3/14/24, Power Integrations Inc (NASDAQ: POWI) stock declined by -3.1%, closing at $70.14. This decline was accompanied by normal trading volume. Relative to the market the stock has been weak over the last nine months and has declined -3.8% during the last week.
CASH FLOW
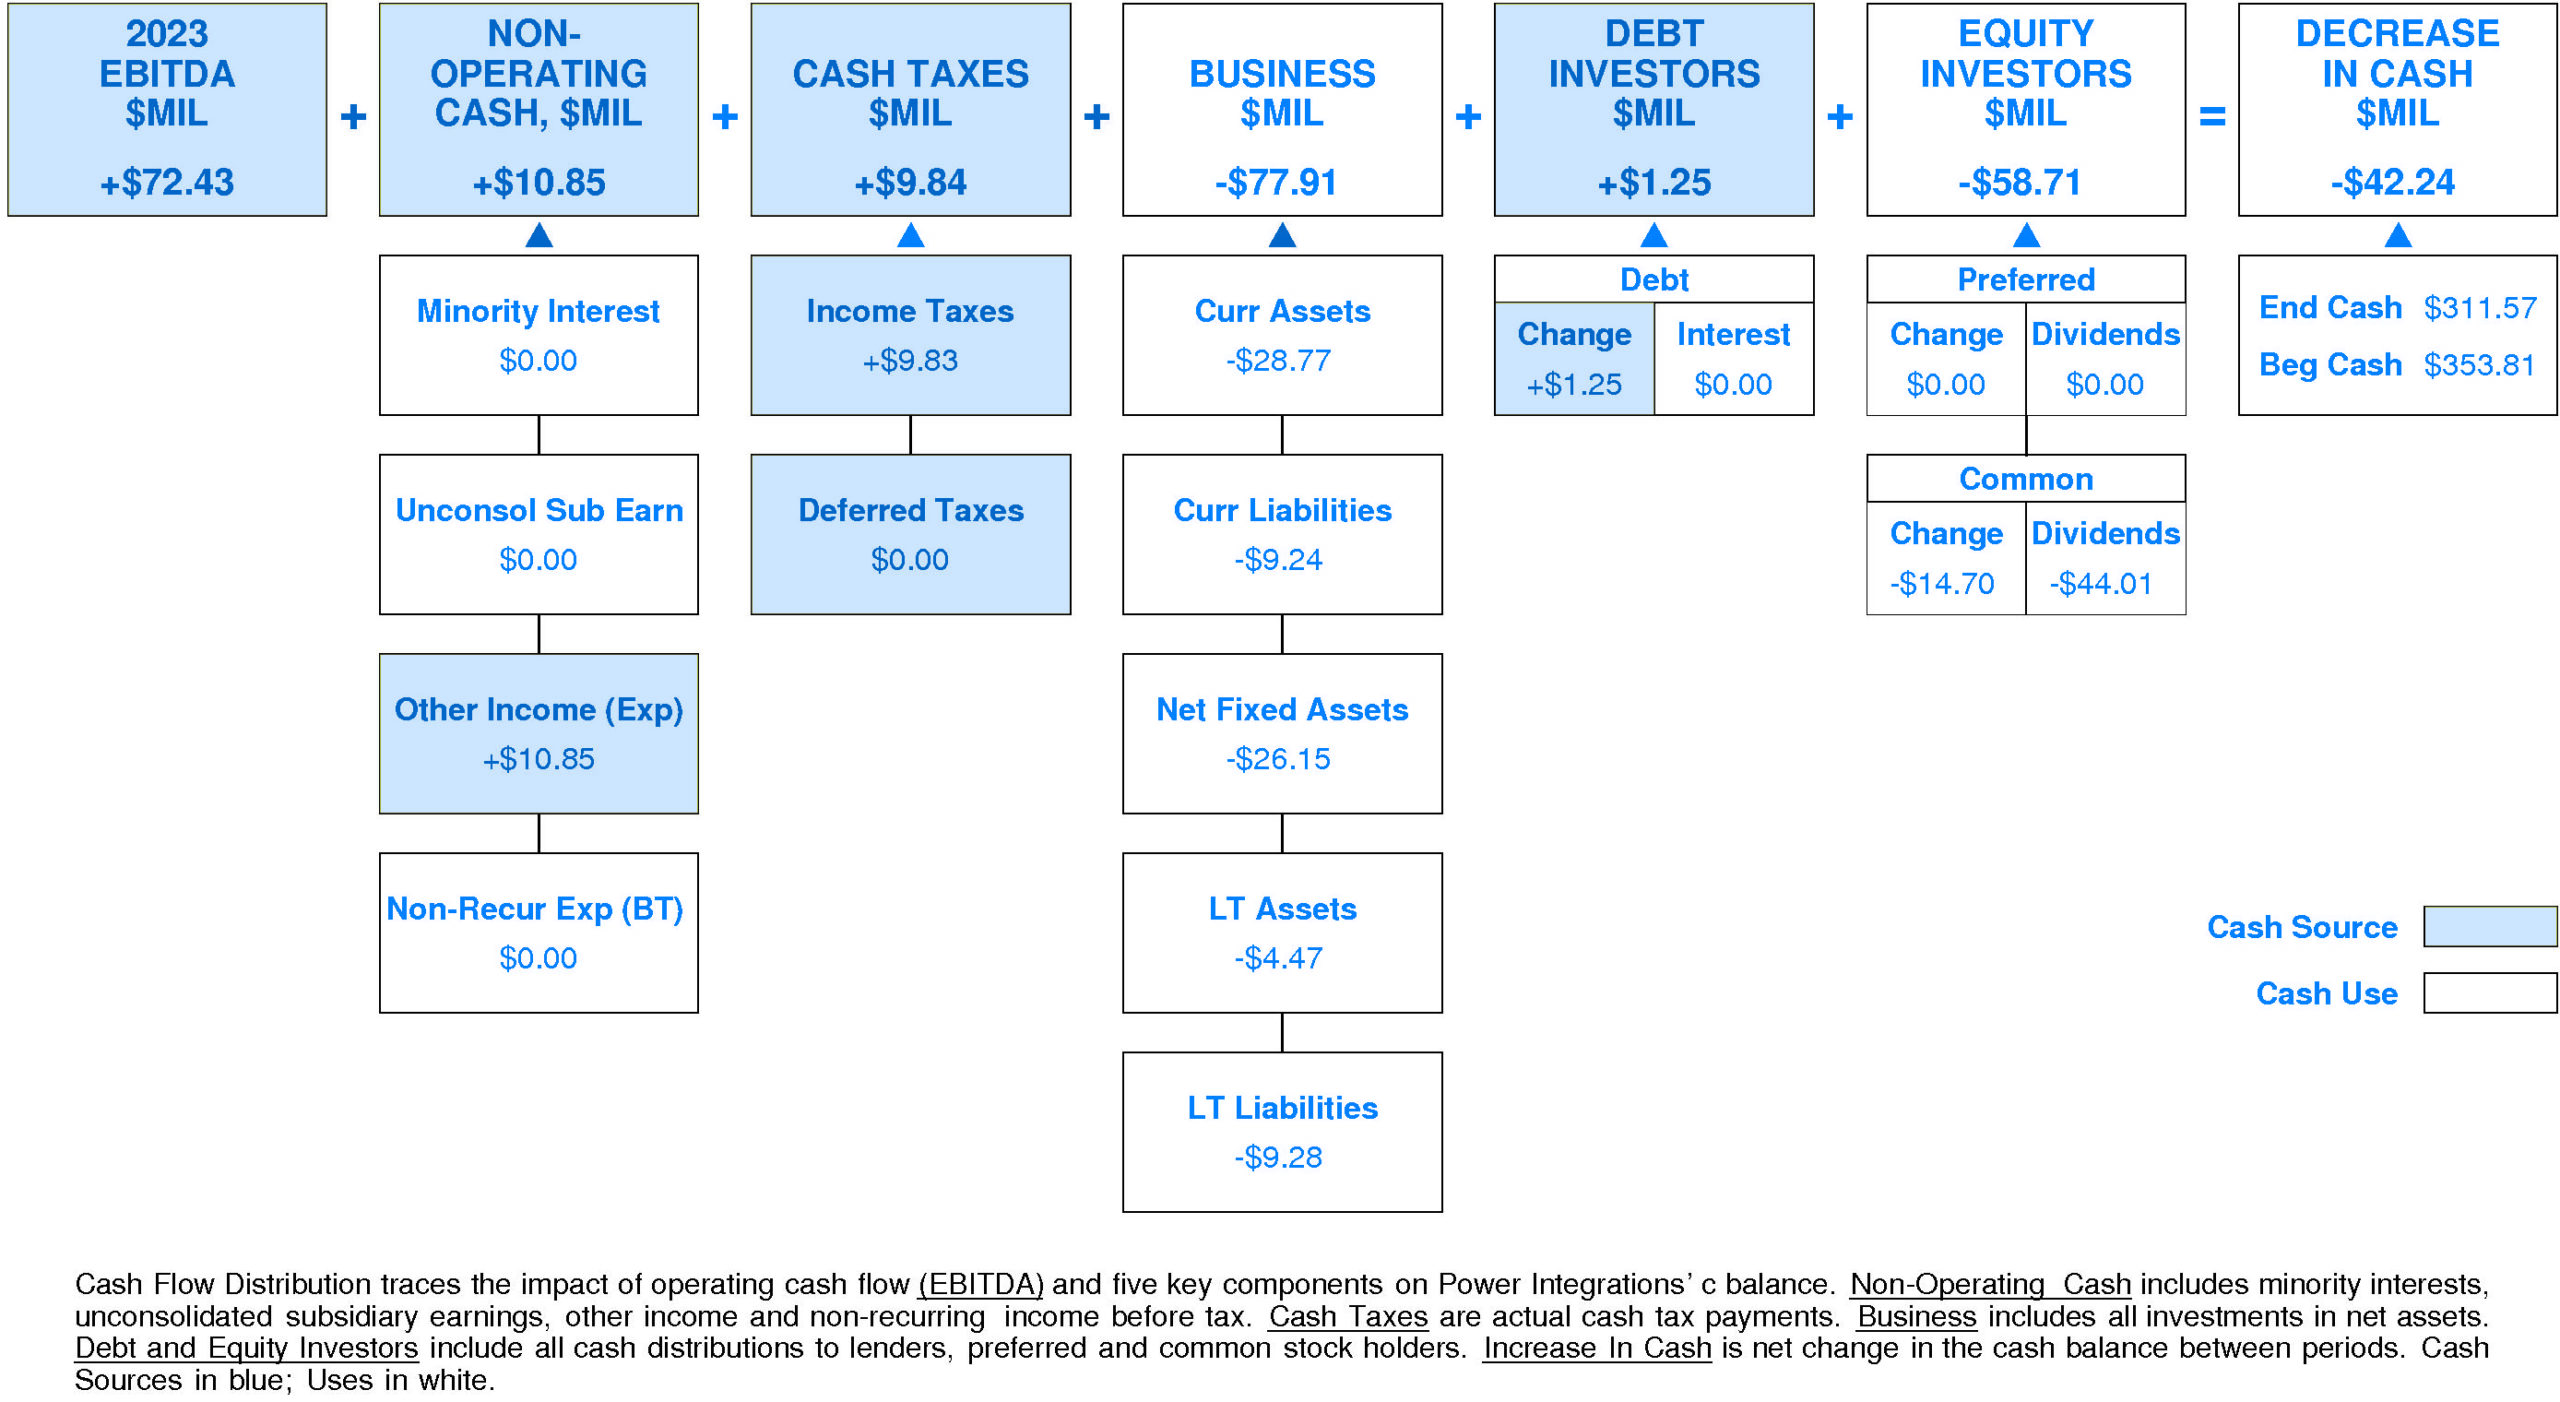
In 2023, Power Integrations experienced a significant decline in cash of -$42.24 million (-12%). Sources of cash were lower than uses. Cash generated from 2023 EBITDA totaled +$72.43 million. Non-operating sources contributed +$10.85 million (+15% of EBITDA). Cash taxes contributed +$9.84 million (+14% of EBITDA). Re-investment in the business amounted to -$77.91 million (-108% of EBITDA). On a net basis, debt investors provided +$1.25 million (+2% of EBITDA) while equity investors received -$58.71 million (-81% of EBITDA).
Power Integrations’ Non-operating Income, %EBITDA has exhibited a volatile overall uptrend over the period. This improvement was accompanied by stability for the Power Integrations Peer Group. (Since 2021 Non-operating Income, %EBITDA has accelerated.) In most years, Power Integrations was in the top quartile. Currently, Power Integrations is upper quartile at +15% of EBITDA (+$10.85 million).
Power Integrations’ Cash Taxes, %EBITDA has exhibited a volatile overall uptrend over the period. This improvement was accompanied by a similar trend for the Power Integrations Peer Group. In most years, Power Integrations was in the top quartile. Currently, Power Integrations is upper quartile at +14% of EBITDA (+$9.84 million).
Power Integrations’ Business Re-investment, %EBITDA has suffered a volatile overall downtrend over the period. This downtrend was accompanied by an opposite trend for the Power Integrations Peer Group. In most years, Power Integrations was in the second quartile and top quartile. Currently, Power Integrations is lower quartile at -108% of EBITDA (-$77.91 million).
Power Integrations’ Debt Investors, %EBITDA has exhibited little to no overall change over the period. This stability was accompanied by a downtrend for the Power Integrations Peer Group. In most years, Power Integrations was in the second quartile and third quartile. Currently, Power Integrations is above median at +2% of EBITDA (+$1.25 million).
Power Integrations’ Equity Investors, %EBITDA has suffered a volatile overall downtrend over the period. This downtrend was accompanied by an opposite trend for the Power Integrations Peer Group. In most years, Power Integrations was in the lower quartile and top quartile. Currently, Power Integrations is lower quartile at -81% of EBITDA (-$58.71 million).
Power Integrations’ Change in Cash, %EBITDA has experienced a volatile overall downtrend over the period. This downtrend was accompanied by an opposite trend for the Power Integrations Peer Group. In most years, Power Integrations was in the top quartile and lower quartile. Currently, Power Integrations is lower quartile at -58% of EBITDA (-$42.24 million).
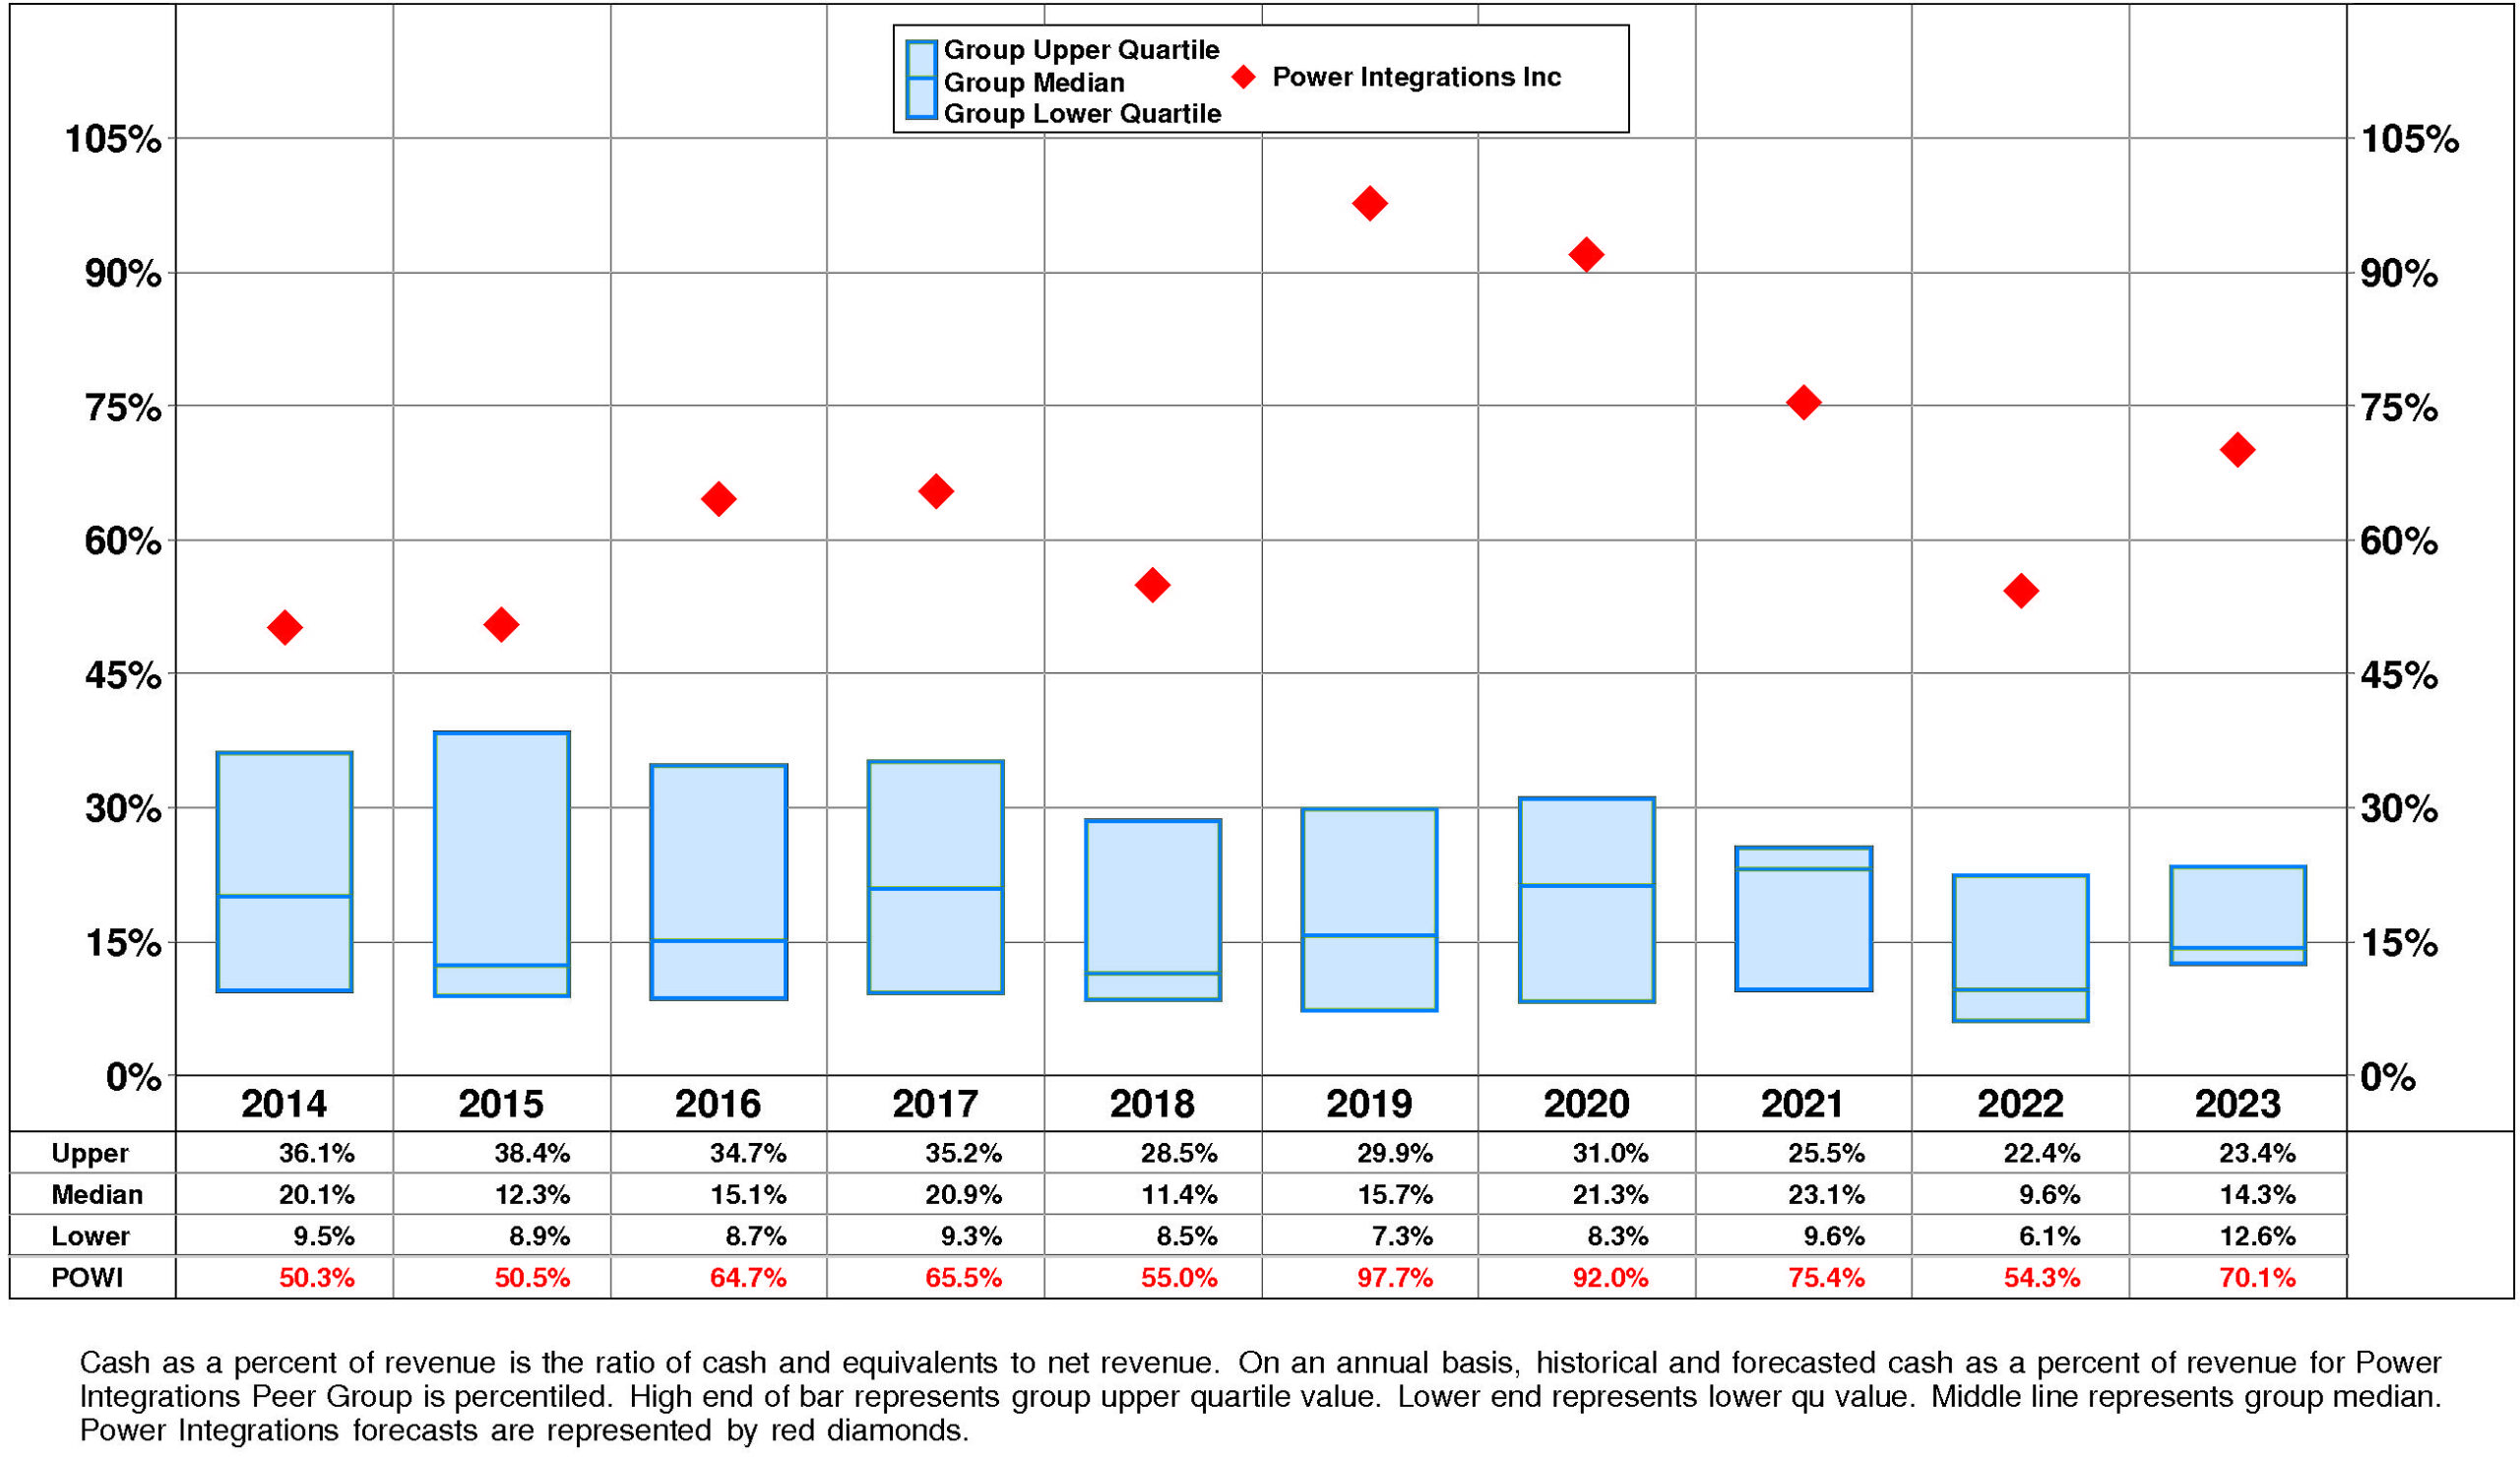
Power Integrations’ Cash, %Revenue has enjoyed a volatile overall uptrend over the period. This improvement was accompanied by stability for the Power Integrations Peer Group. In most years, Power Integrations was in the top quartile. Currently, Power Integrations is upper quartile at +70%.
PROFITABILITY
Power Integrations’ return on equity has improved slightly since 2014. The current level of 7.4% is 1.47X the low for the period and is -46.4% from the high.
This slight improvement was due to small negative trend in pretax operating return and small positive trend in non-operating factors.
The productivity of Power Integrations’ assets declined over the full period 2014-2023: asset turnover has experienced a downtrend that accelerated very sharply after the 2022 level.
Partially offsetting this trend, however, pretax margin has exhibited a volatile overall uptrend but it experienced a very sharp decline after the 2022 high.
Non-operating factors (income taxes and financial leverage) had a minor positive influence on return on equity.
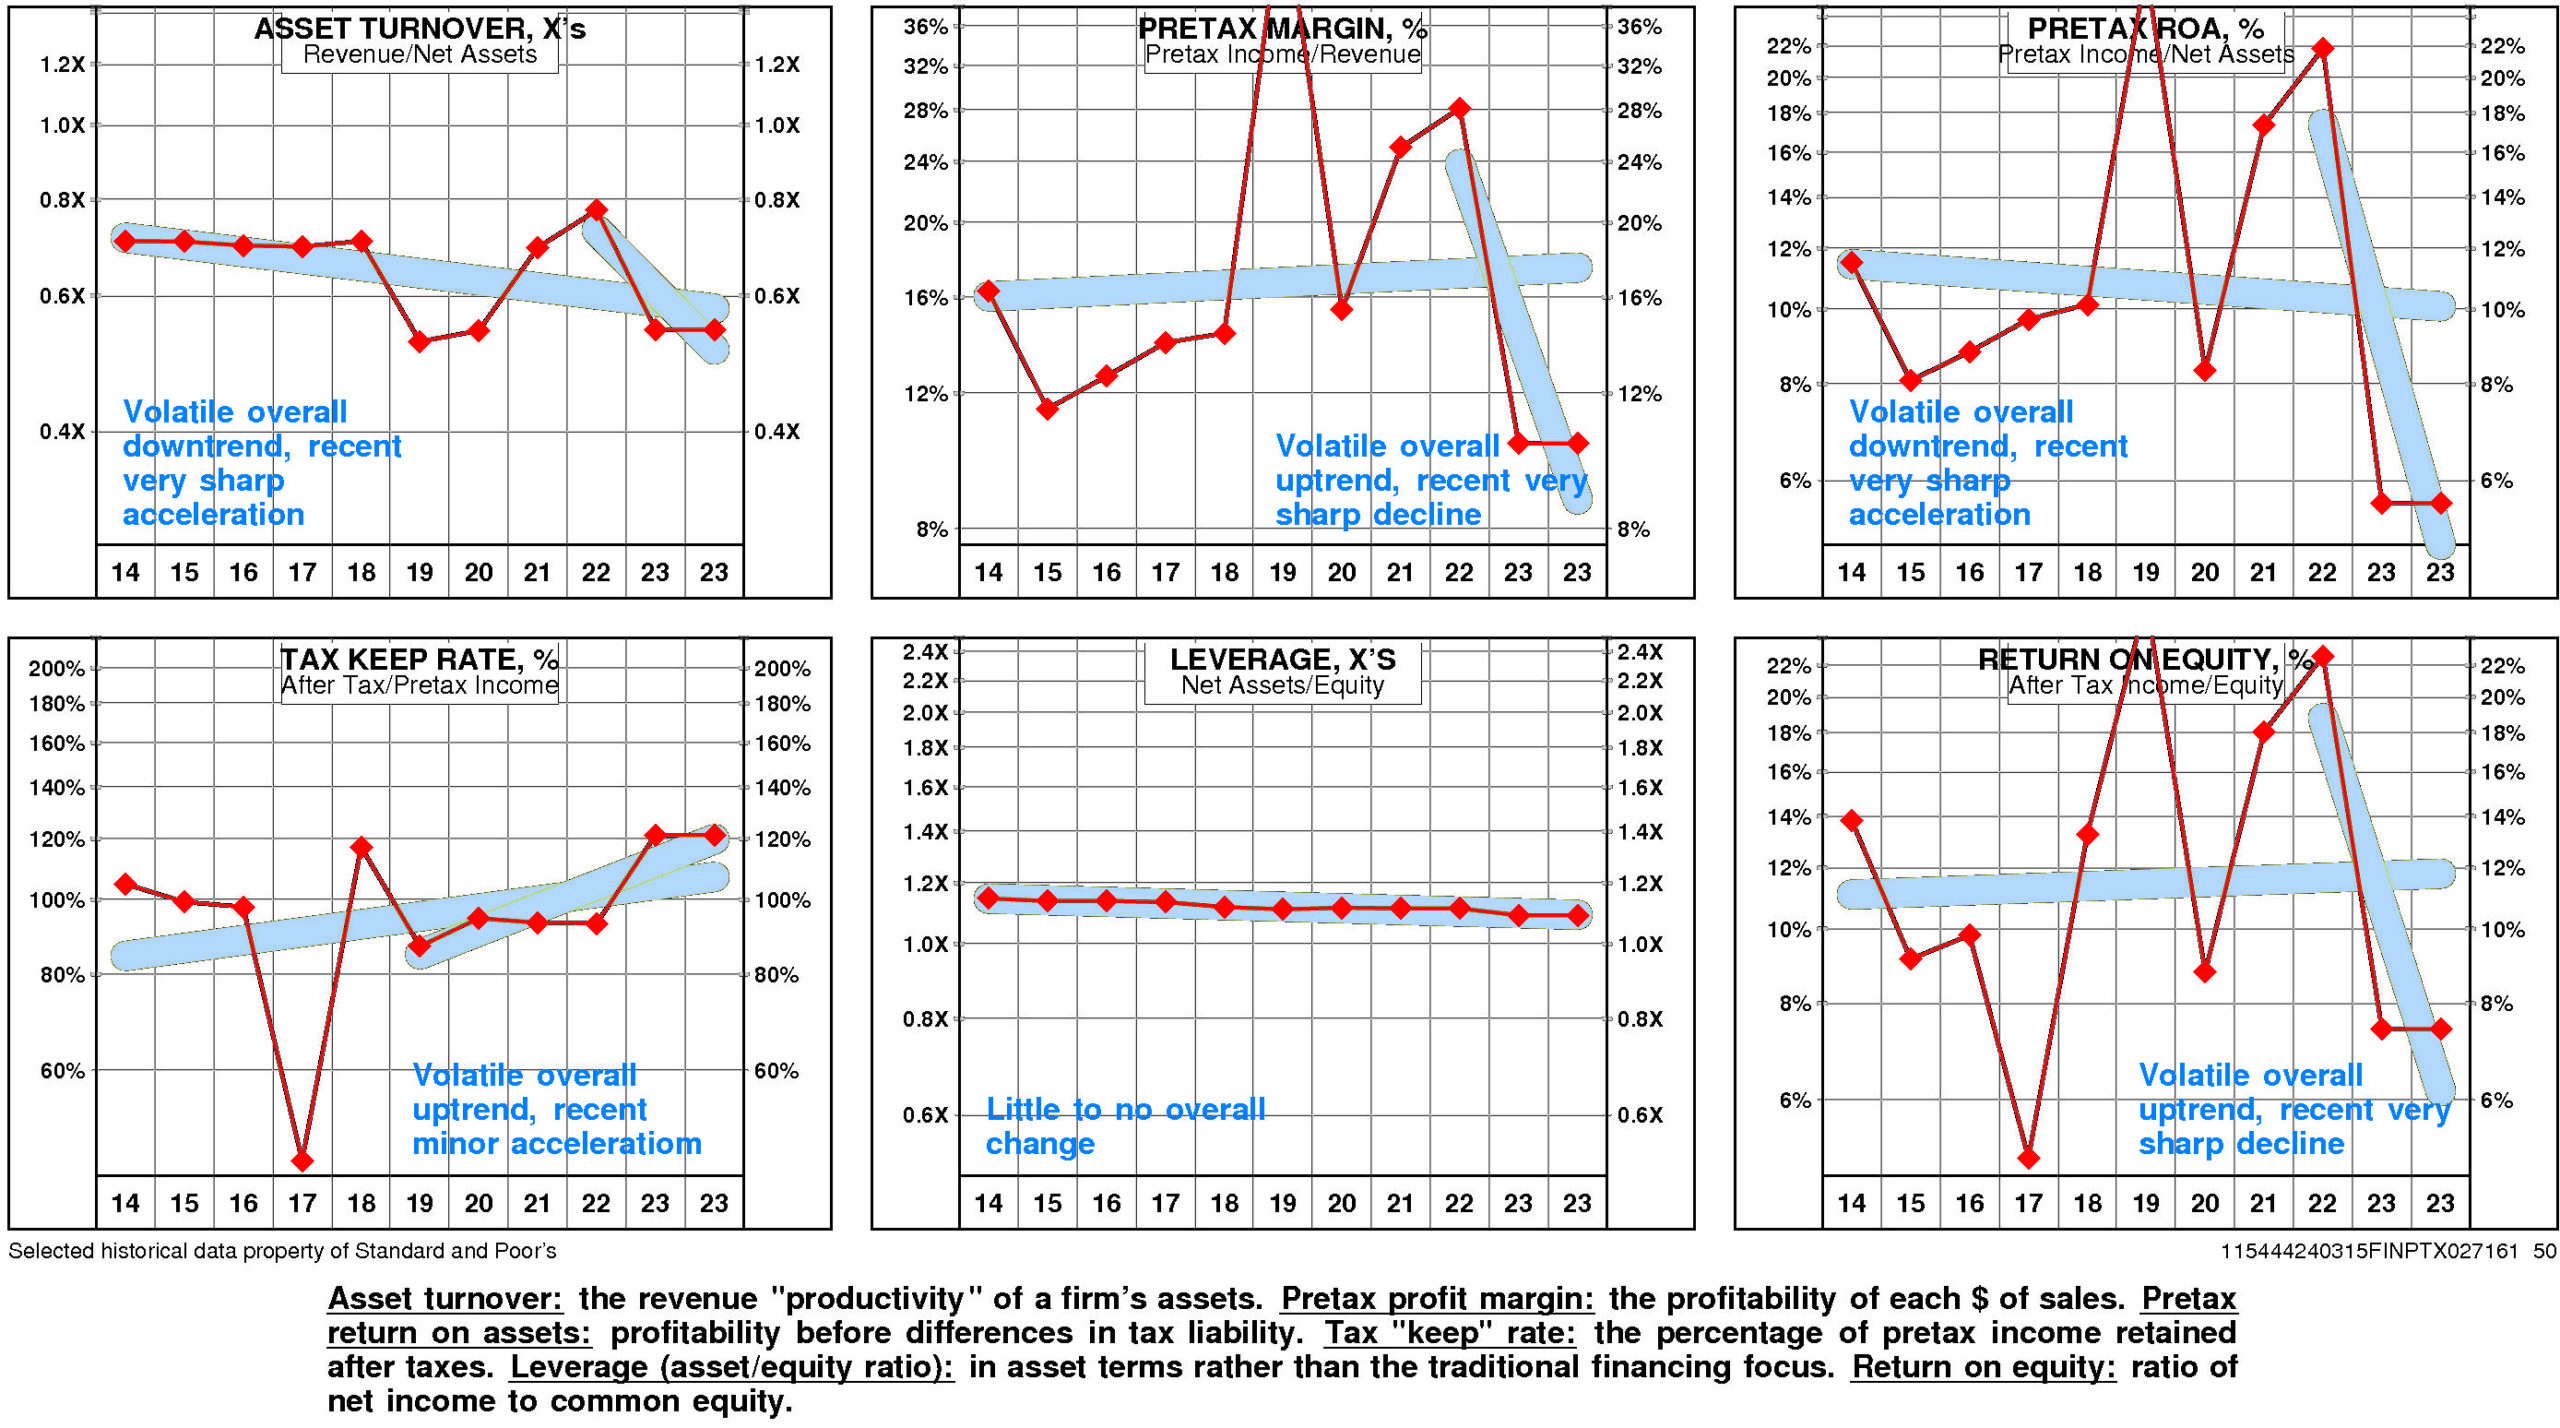
Power Integrations’ return on equity is at the lower quartile (7.4%) for the four quarters ended December, 2023.
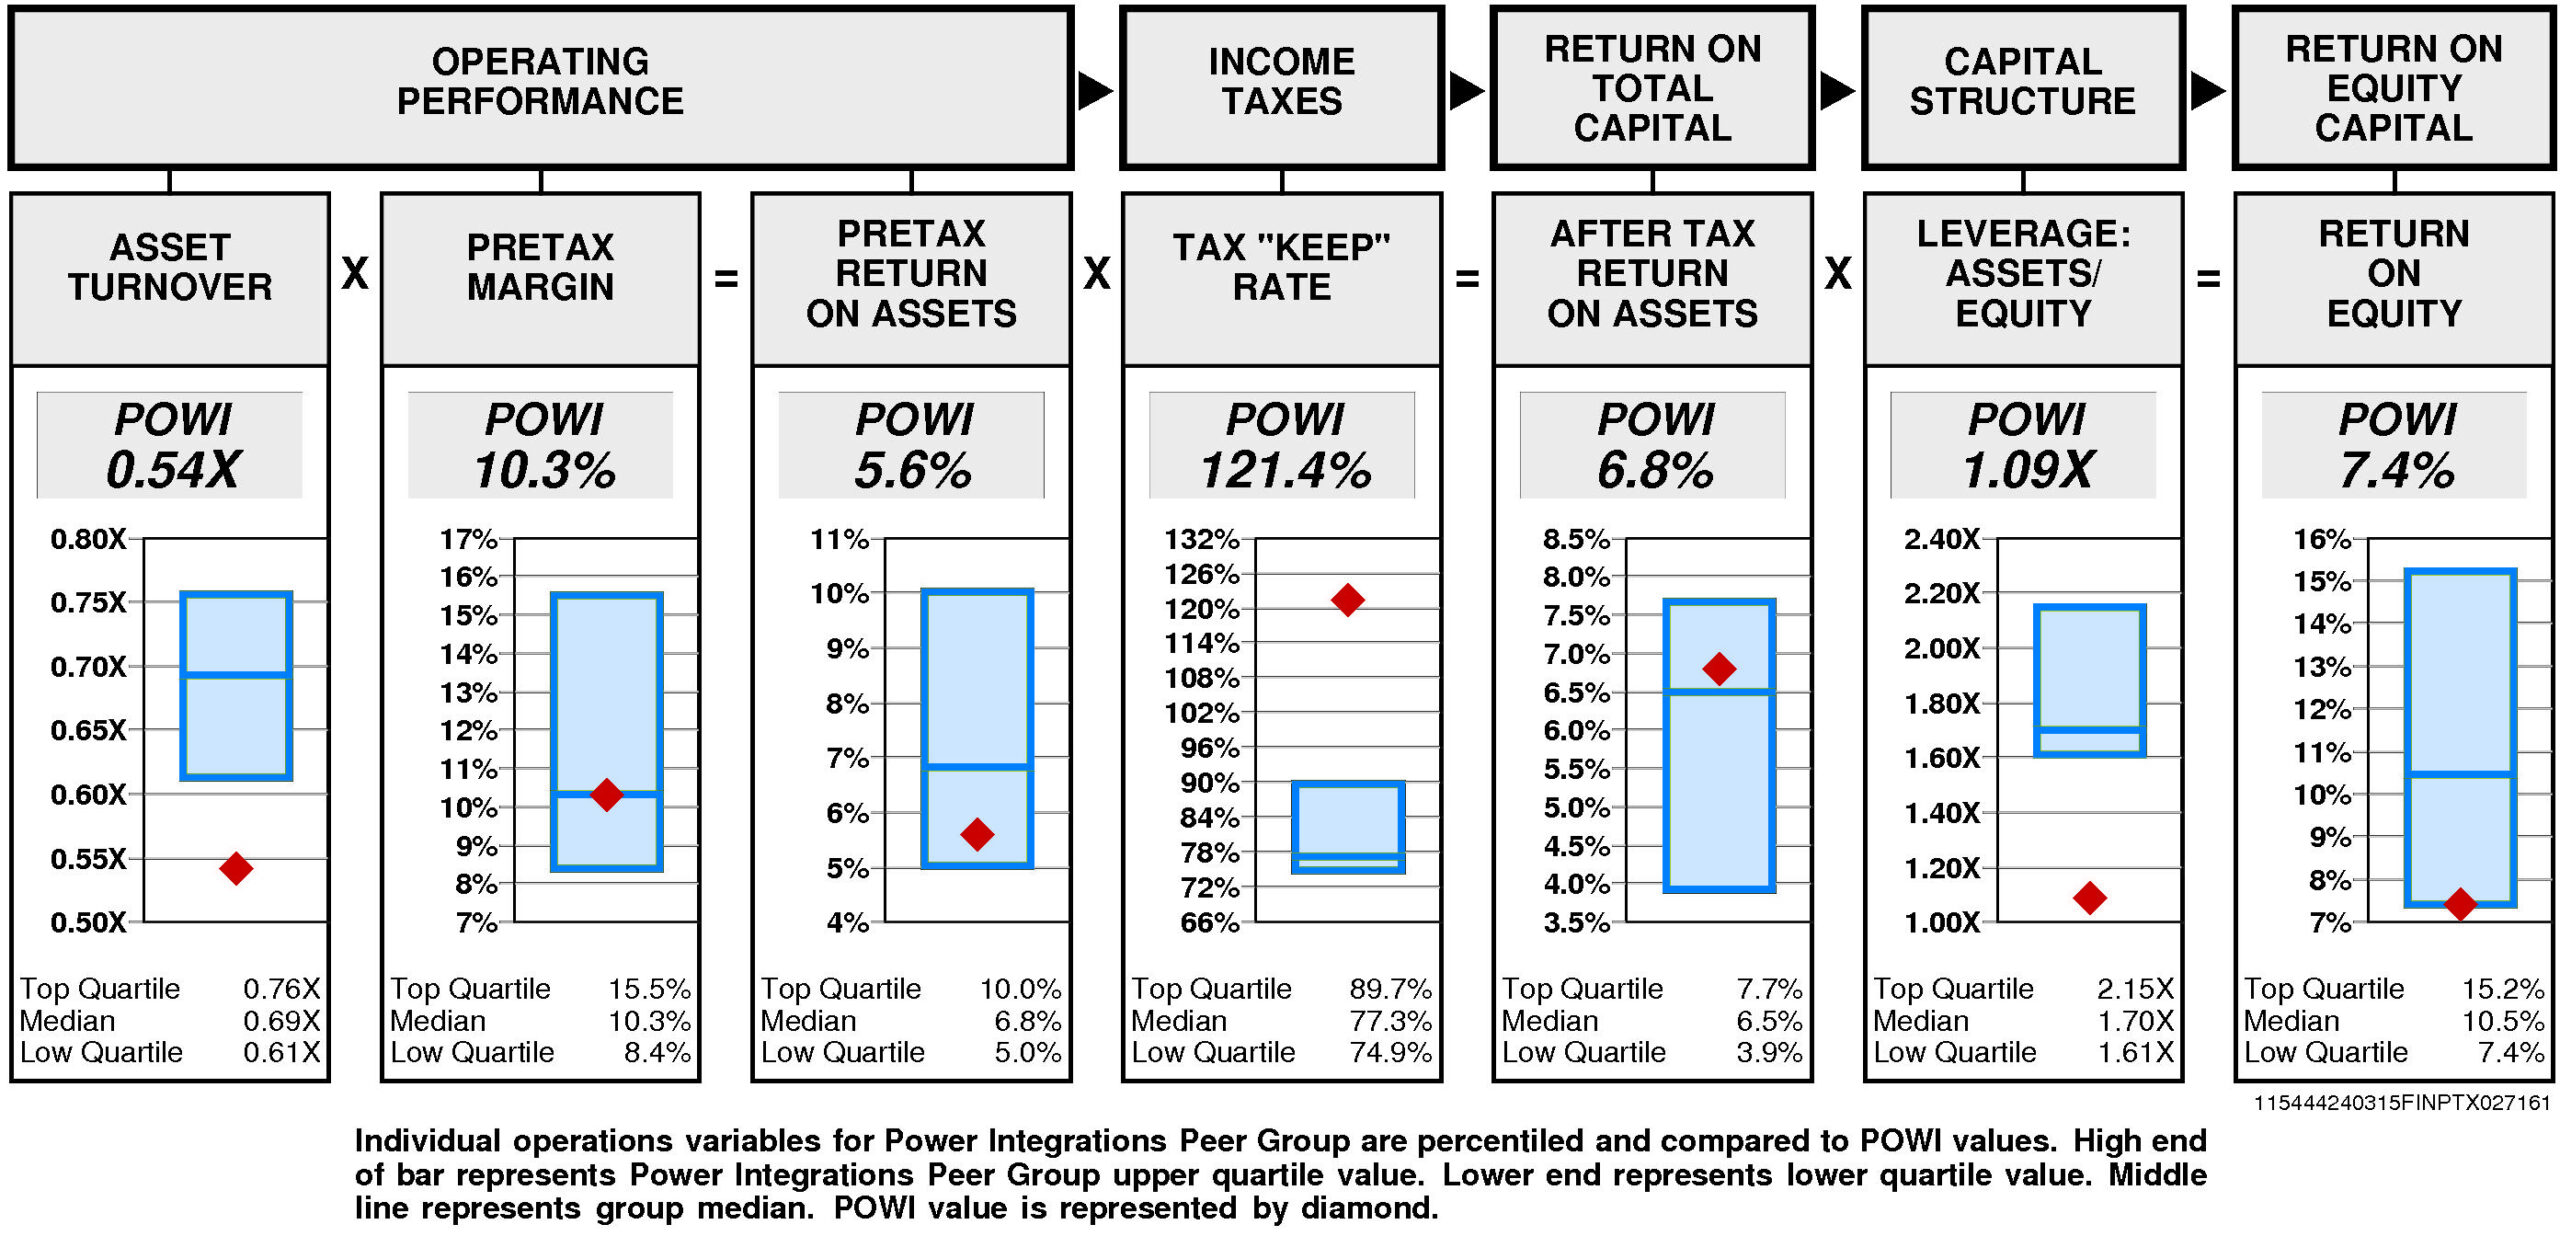
Operating performance (pretax return on assets) is below median (5.6%) reflecting asset turnover that is lower quartile (0.54X) and at median pretax margin (10.3%).
Tax “keep” rate (income tax management) is upper quartile (121.4%) resulting in after tax return on assets that is above median.
Financial leverage (leverage) is lower quartile (1.09X).
GROWTH RATES
Overall, Power Integrations’ growth rate has slowed very considerably in recent years.
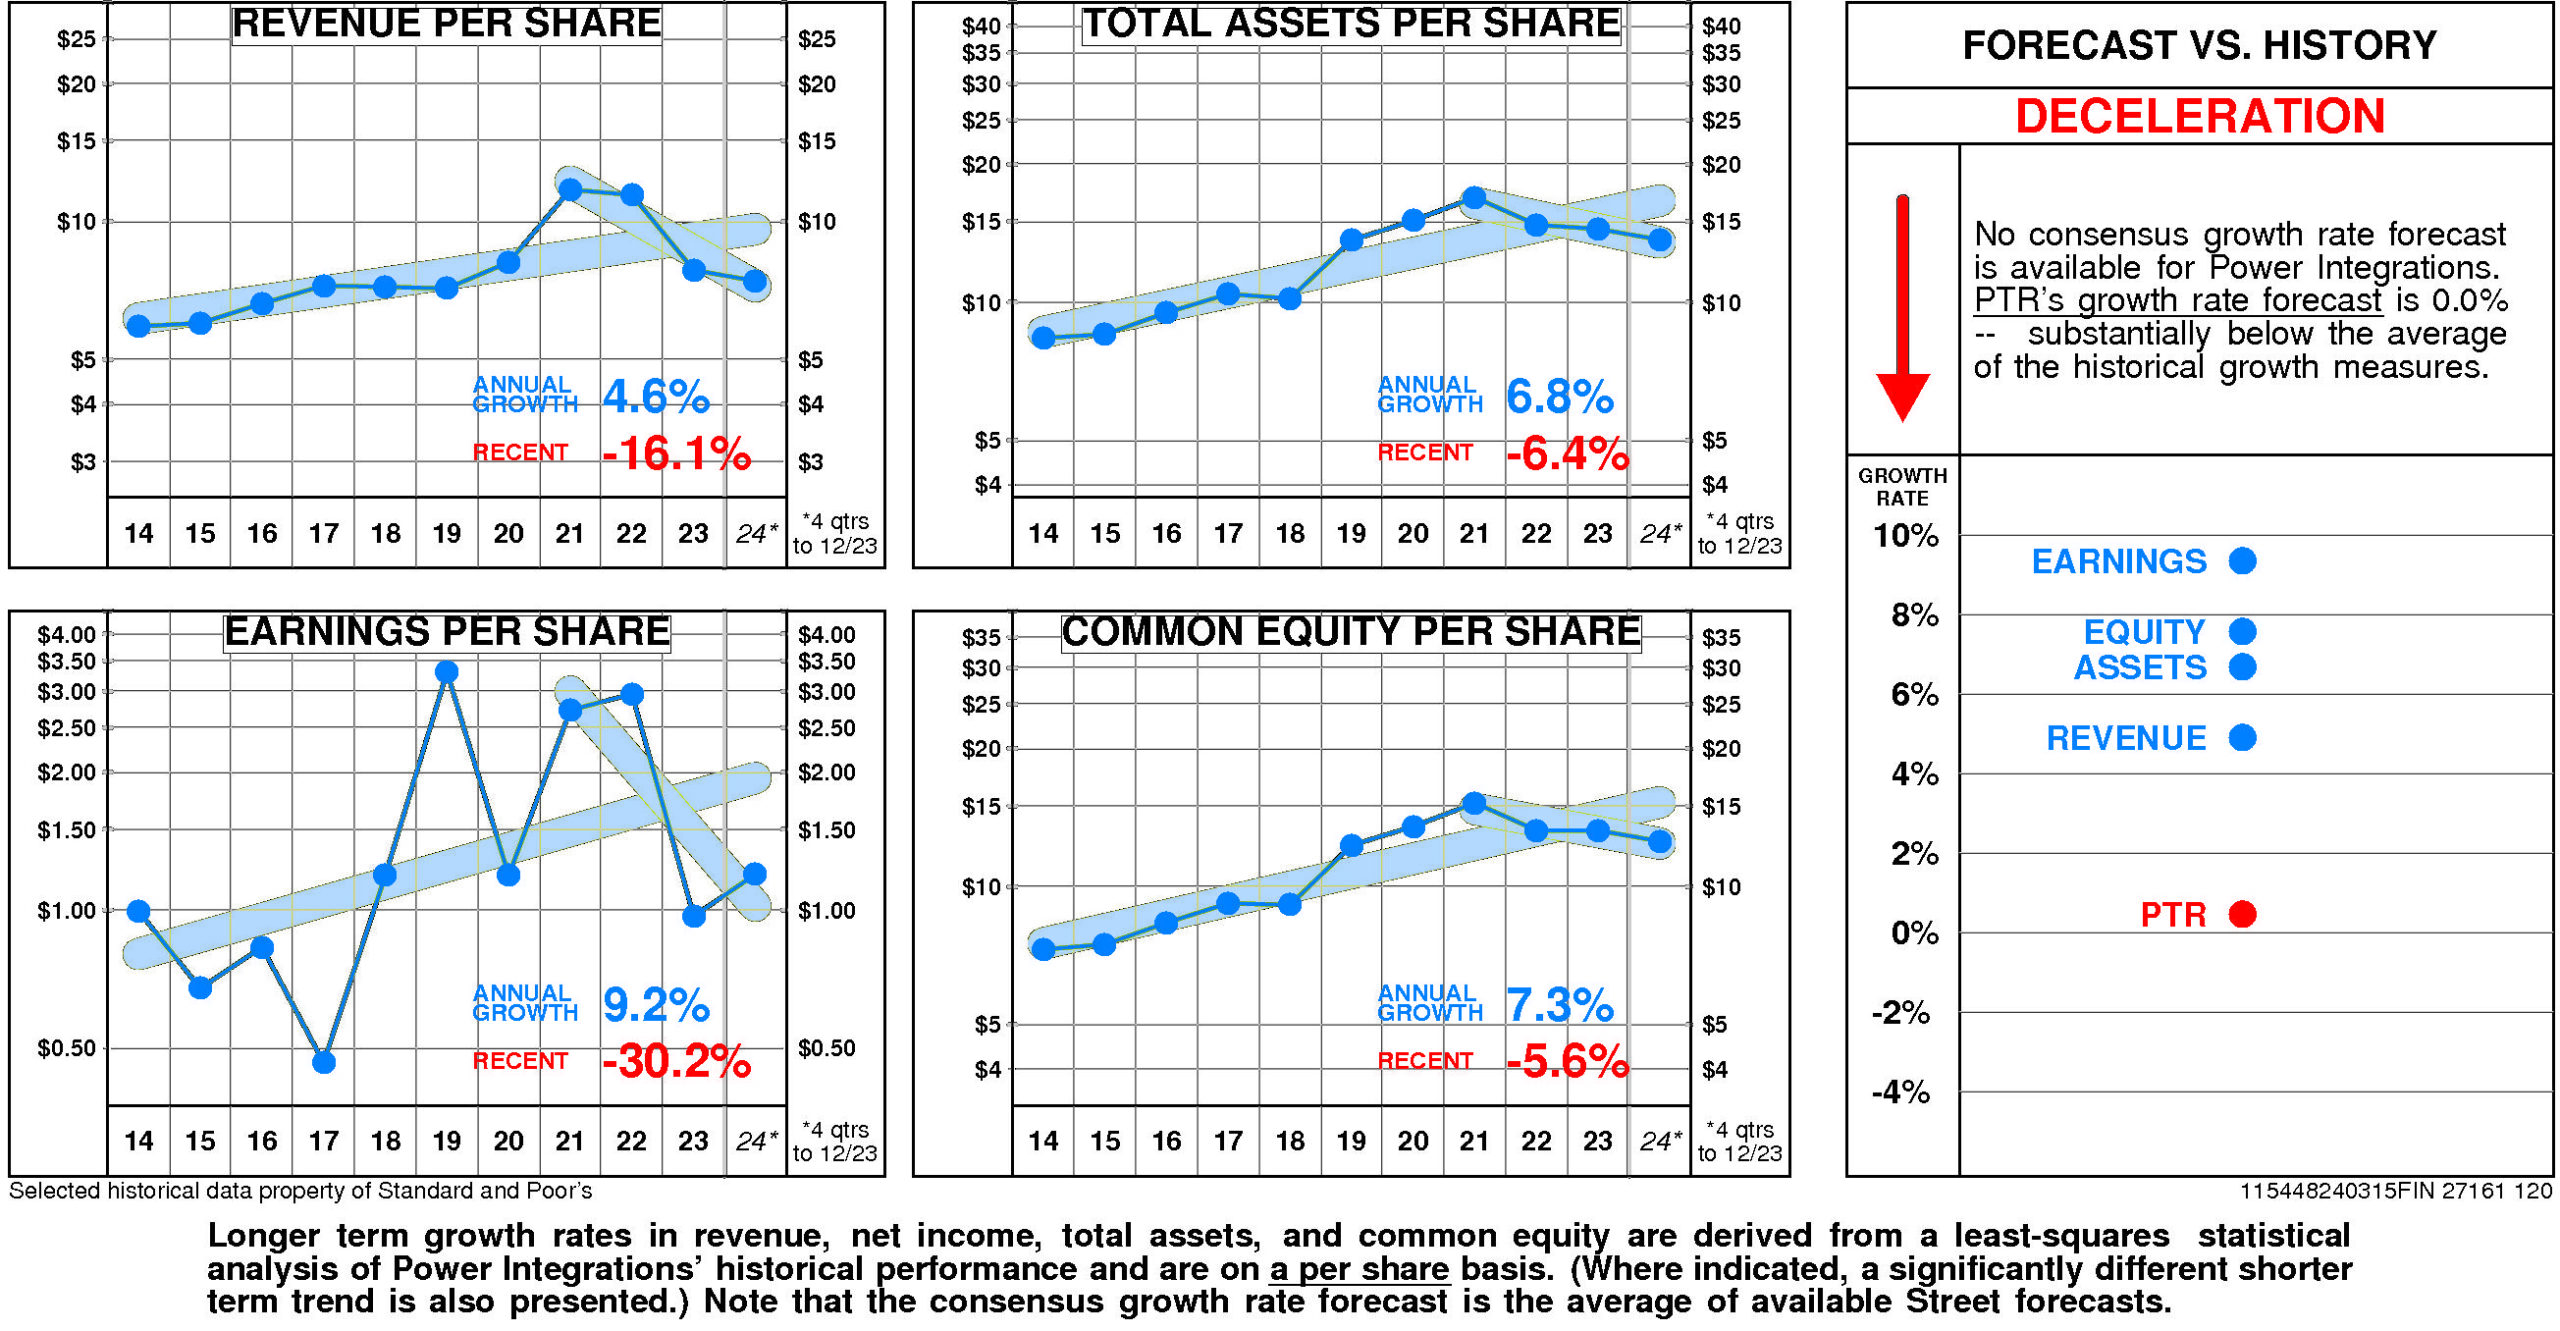
Power Integrations’ historical income statement growth has been in line with balance sheet growth. Revenue growth has paralleled asset growth; earnings growth has paralleled equity growth.
Annual revenue growth has been 4.6% per year. (More recently it has been -16.1%.)
Total asset growth has been 6.8% per year. (More recently it has been -6.4%.)
Annual E.P.S. growth has been 9.2% per year. (More recently it has been -30.2%.)
Equity growth has been 7.3% per year. (More recently it has been -5.6%.)
No consensus growth rate forecast is available for Power Integrations.
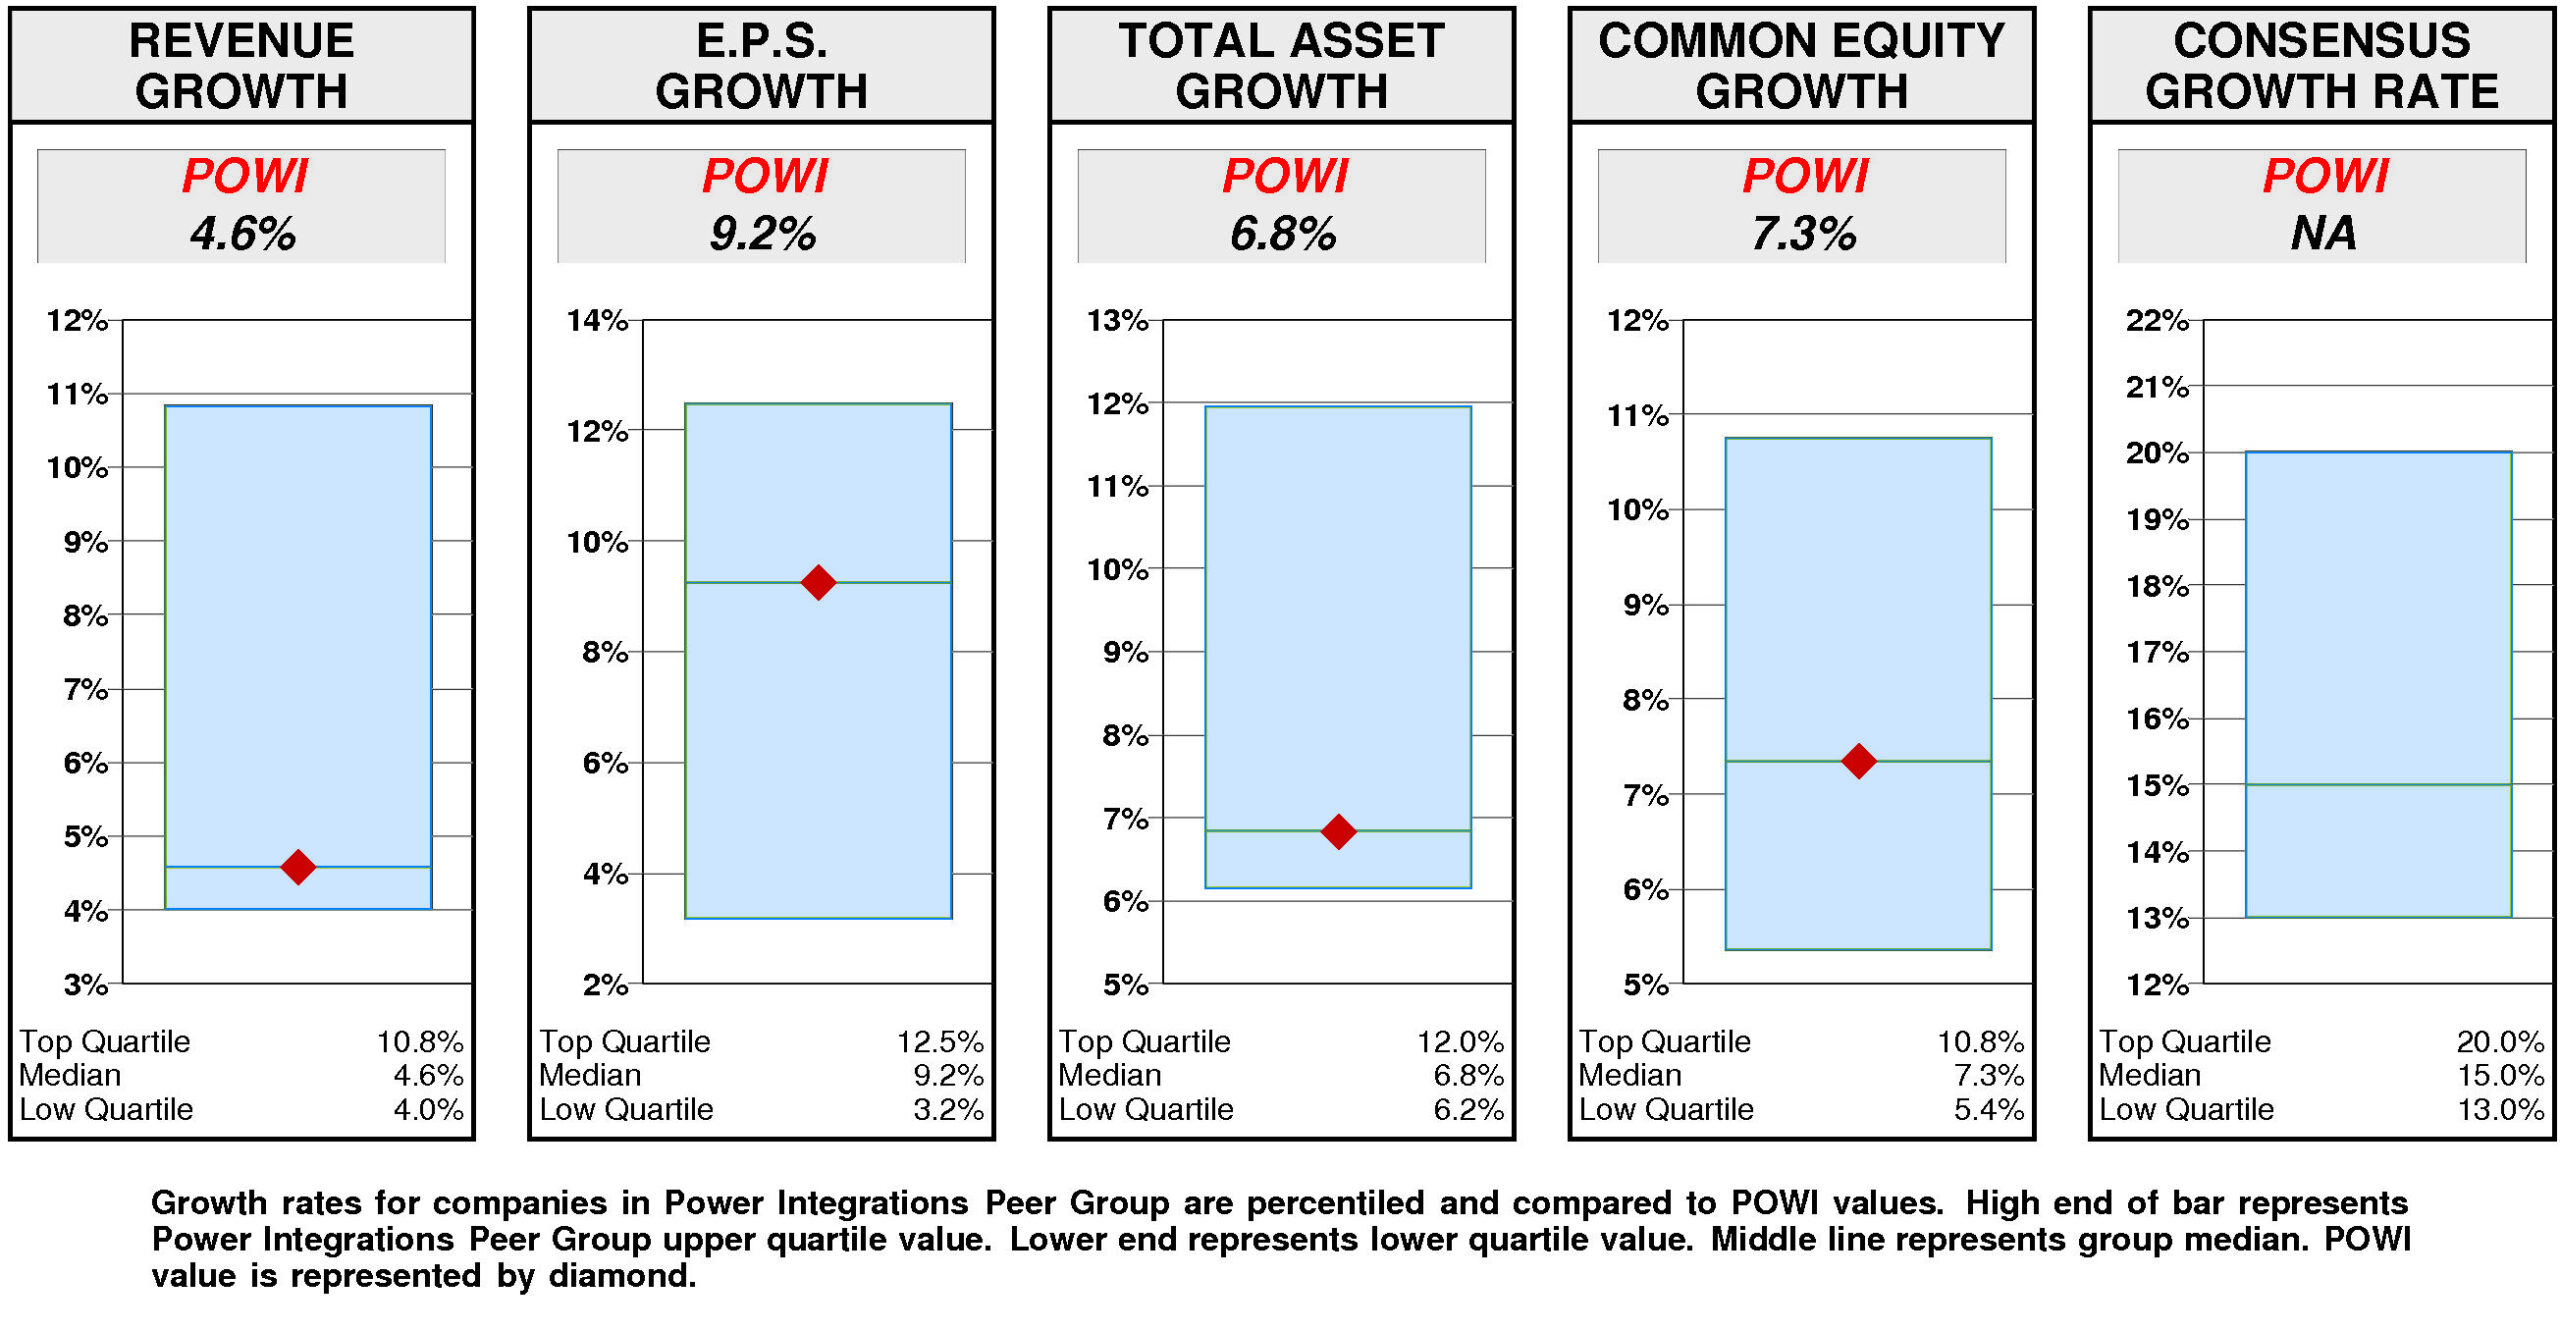
Relative to the Power Integrations Peer Group, Power Integrations’ historical growth measures are generally second quartile. Revenue growth (4.6%) has been at median. Total asset growth (6.8%) has been at median. E.P.S. growth (9.2%) has been at median. Equity growth (7.3%) has been at median.
Consensus growth forecast is unavailable.
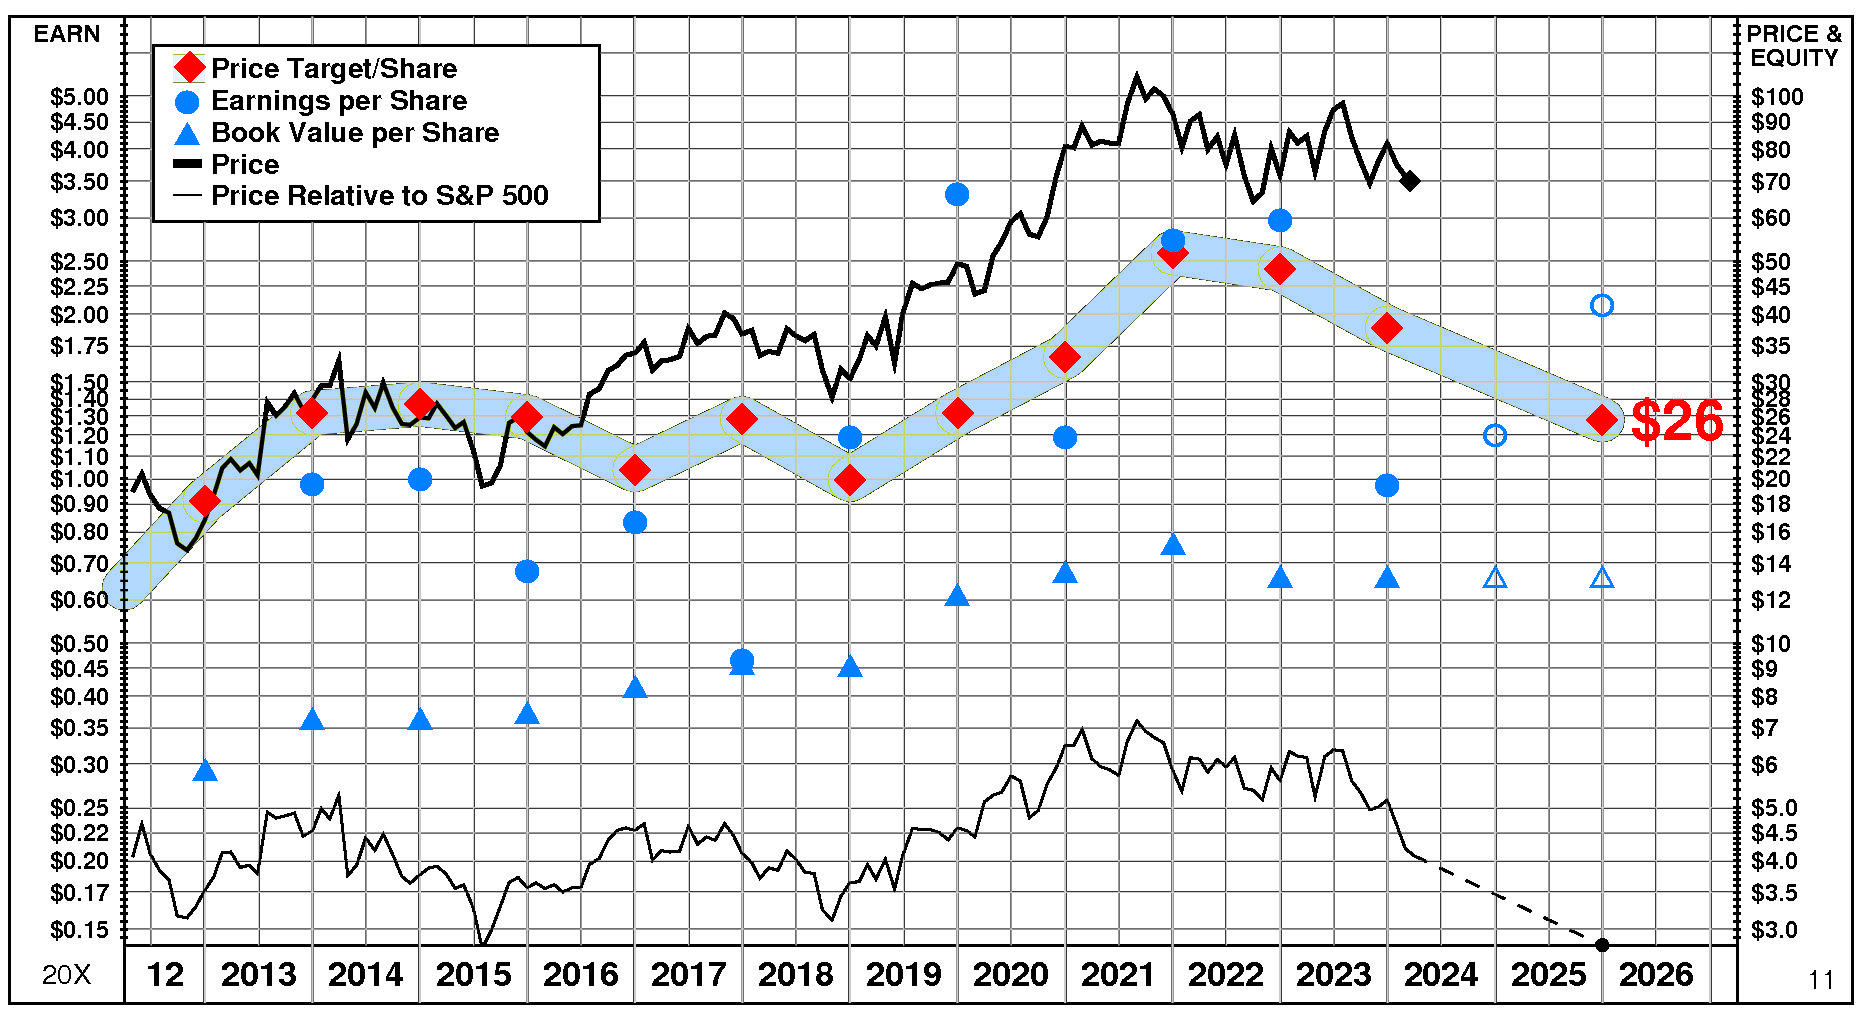
PRICE HISTORY
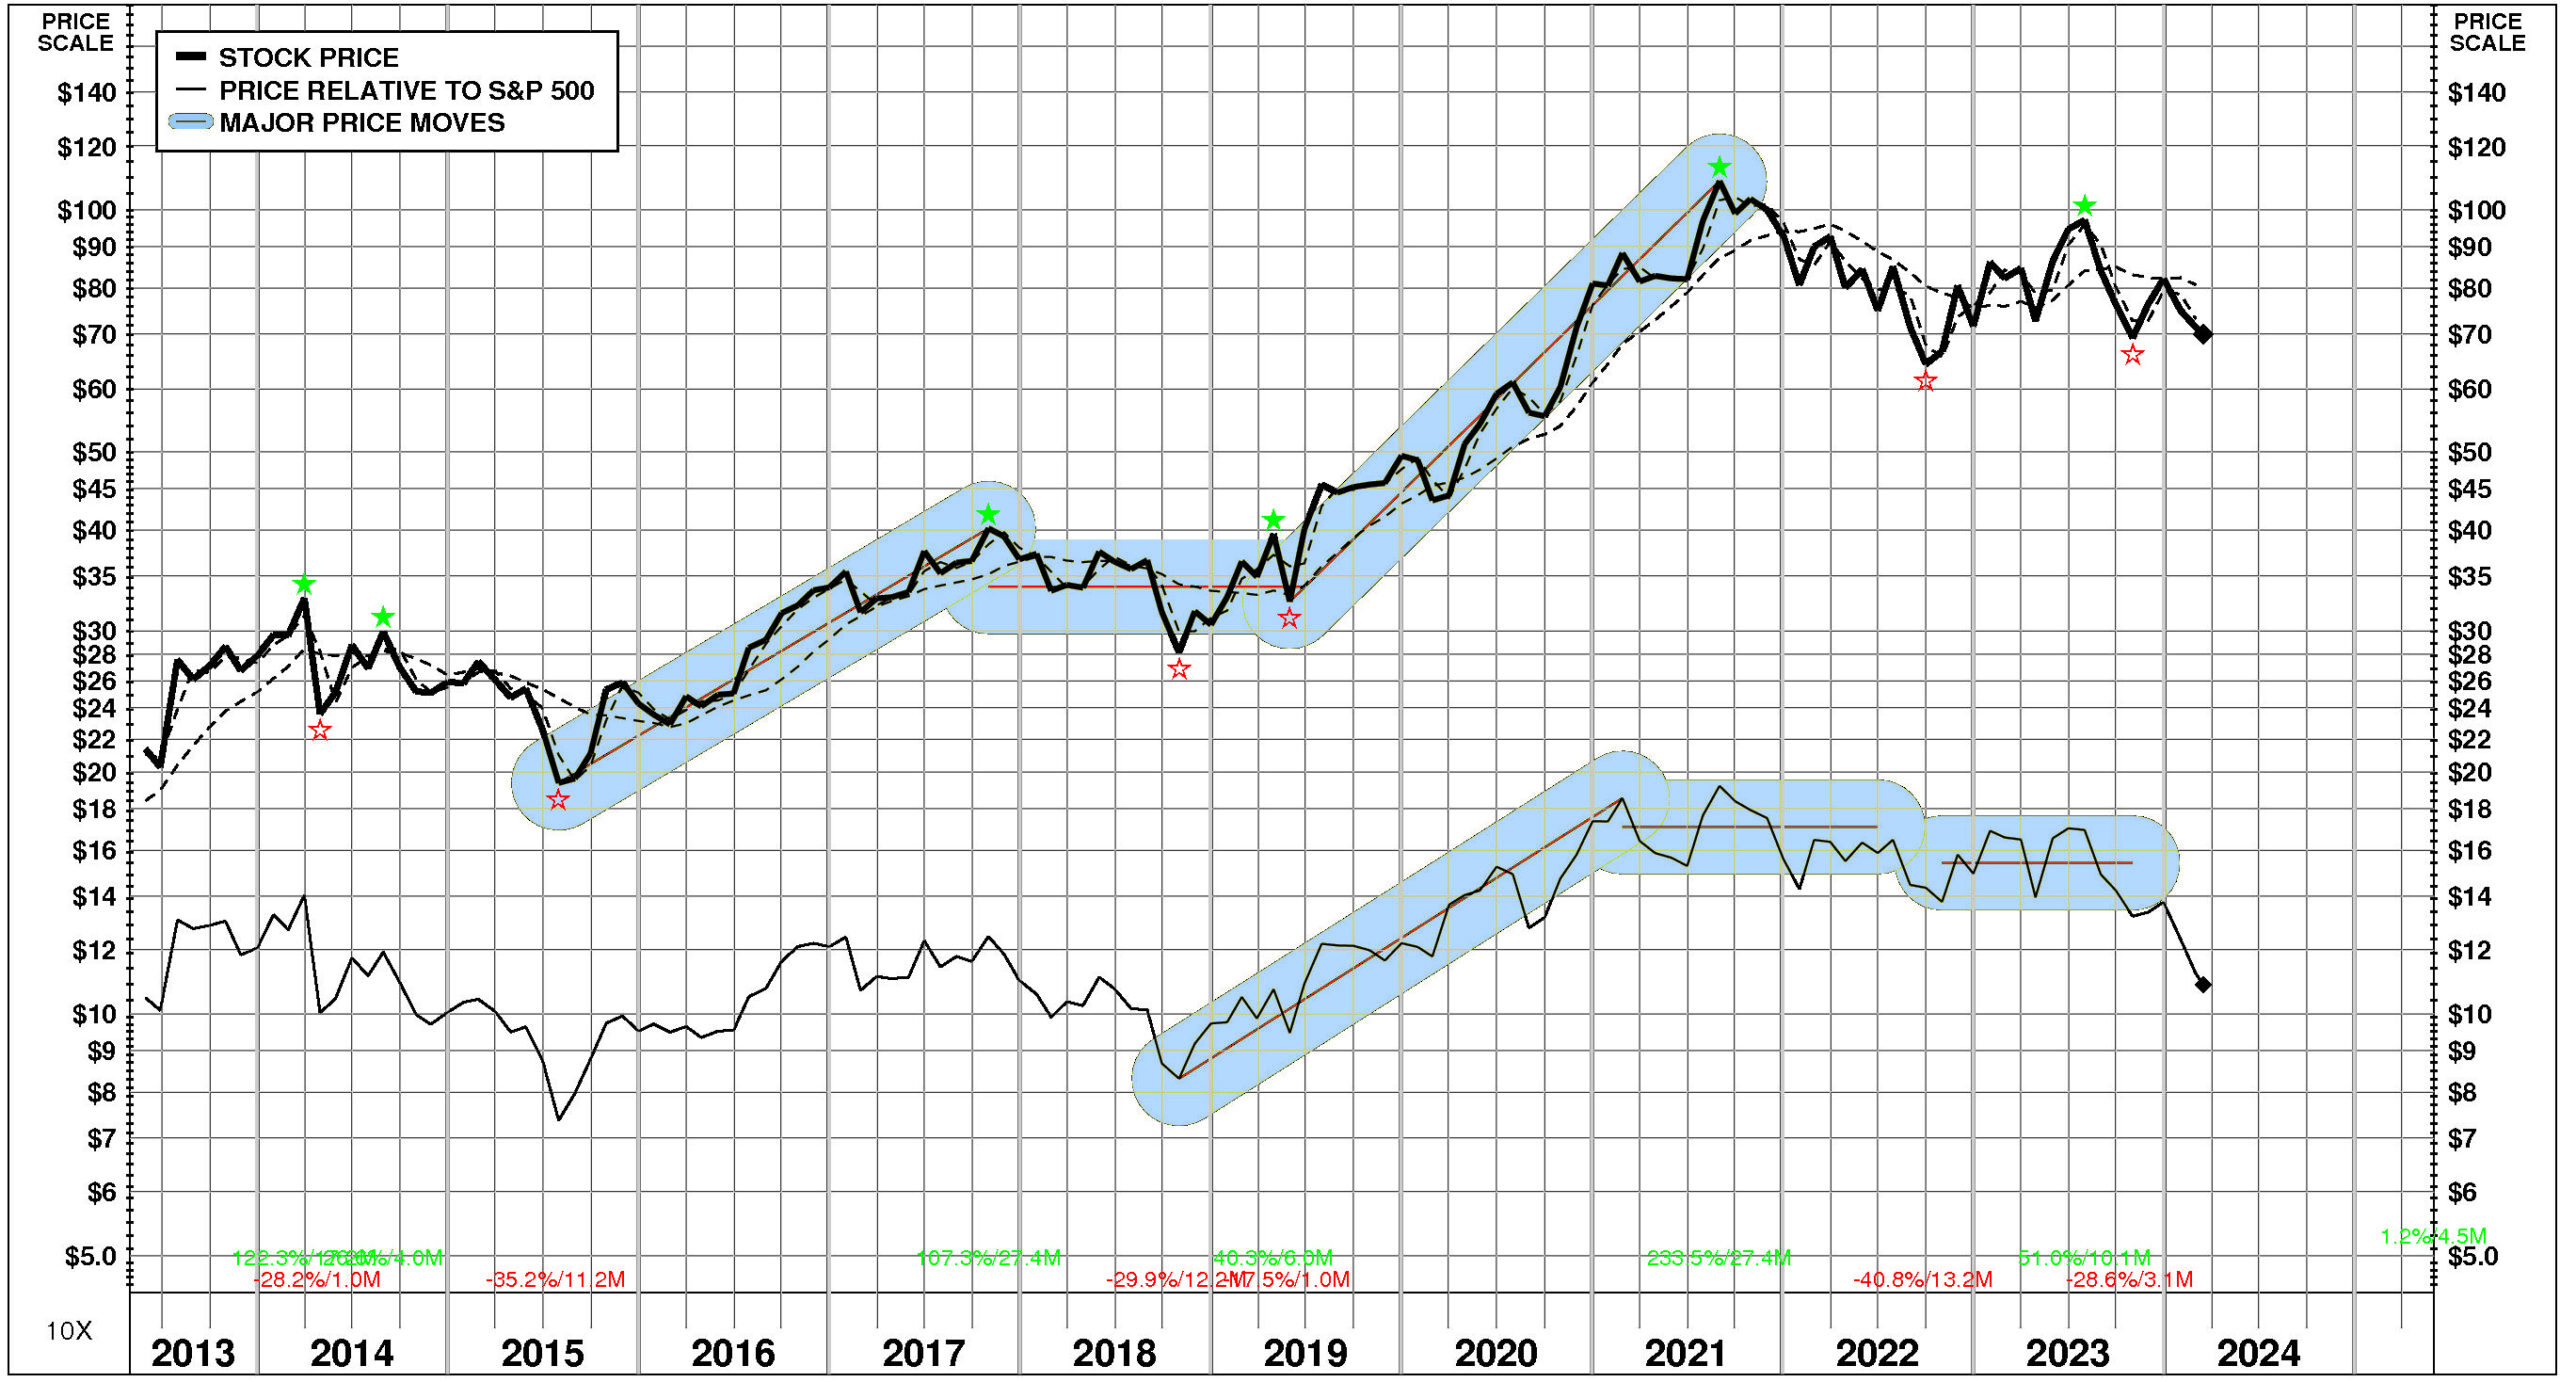
Over the full time period, Power Integrations’ stock price performance has been variable and in line with the market. Between May, 2013 and March, 2024, Power Integrations’ stock price rose +229%; relative to the market, this was a +4% gain. Significant price moves during the period: 1) May, 2019 – August, 2021: +233%; and 2) July, 2015 – October, 2017: +107%.
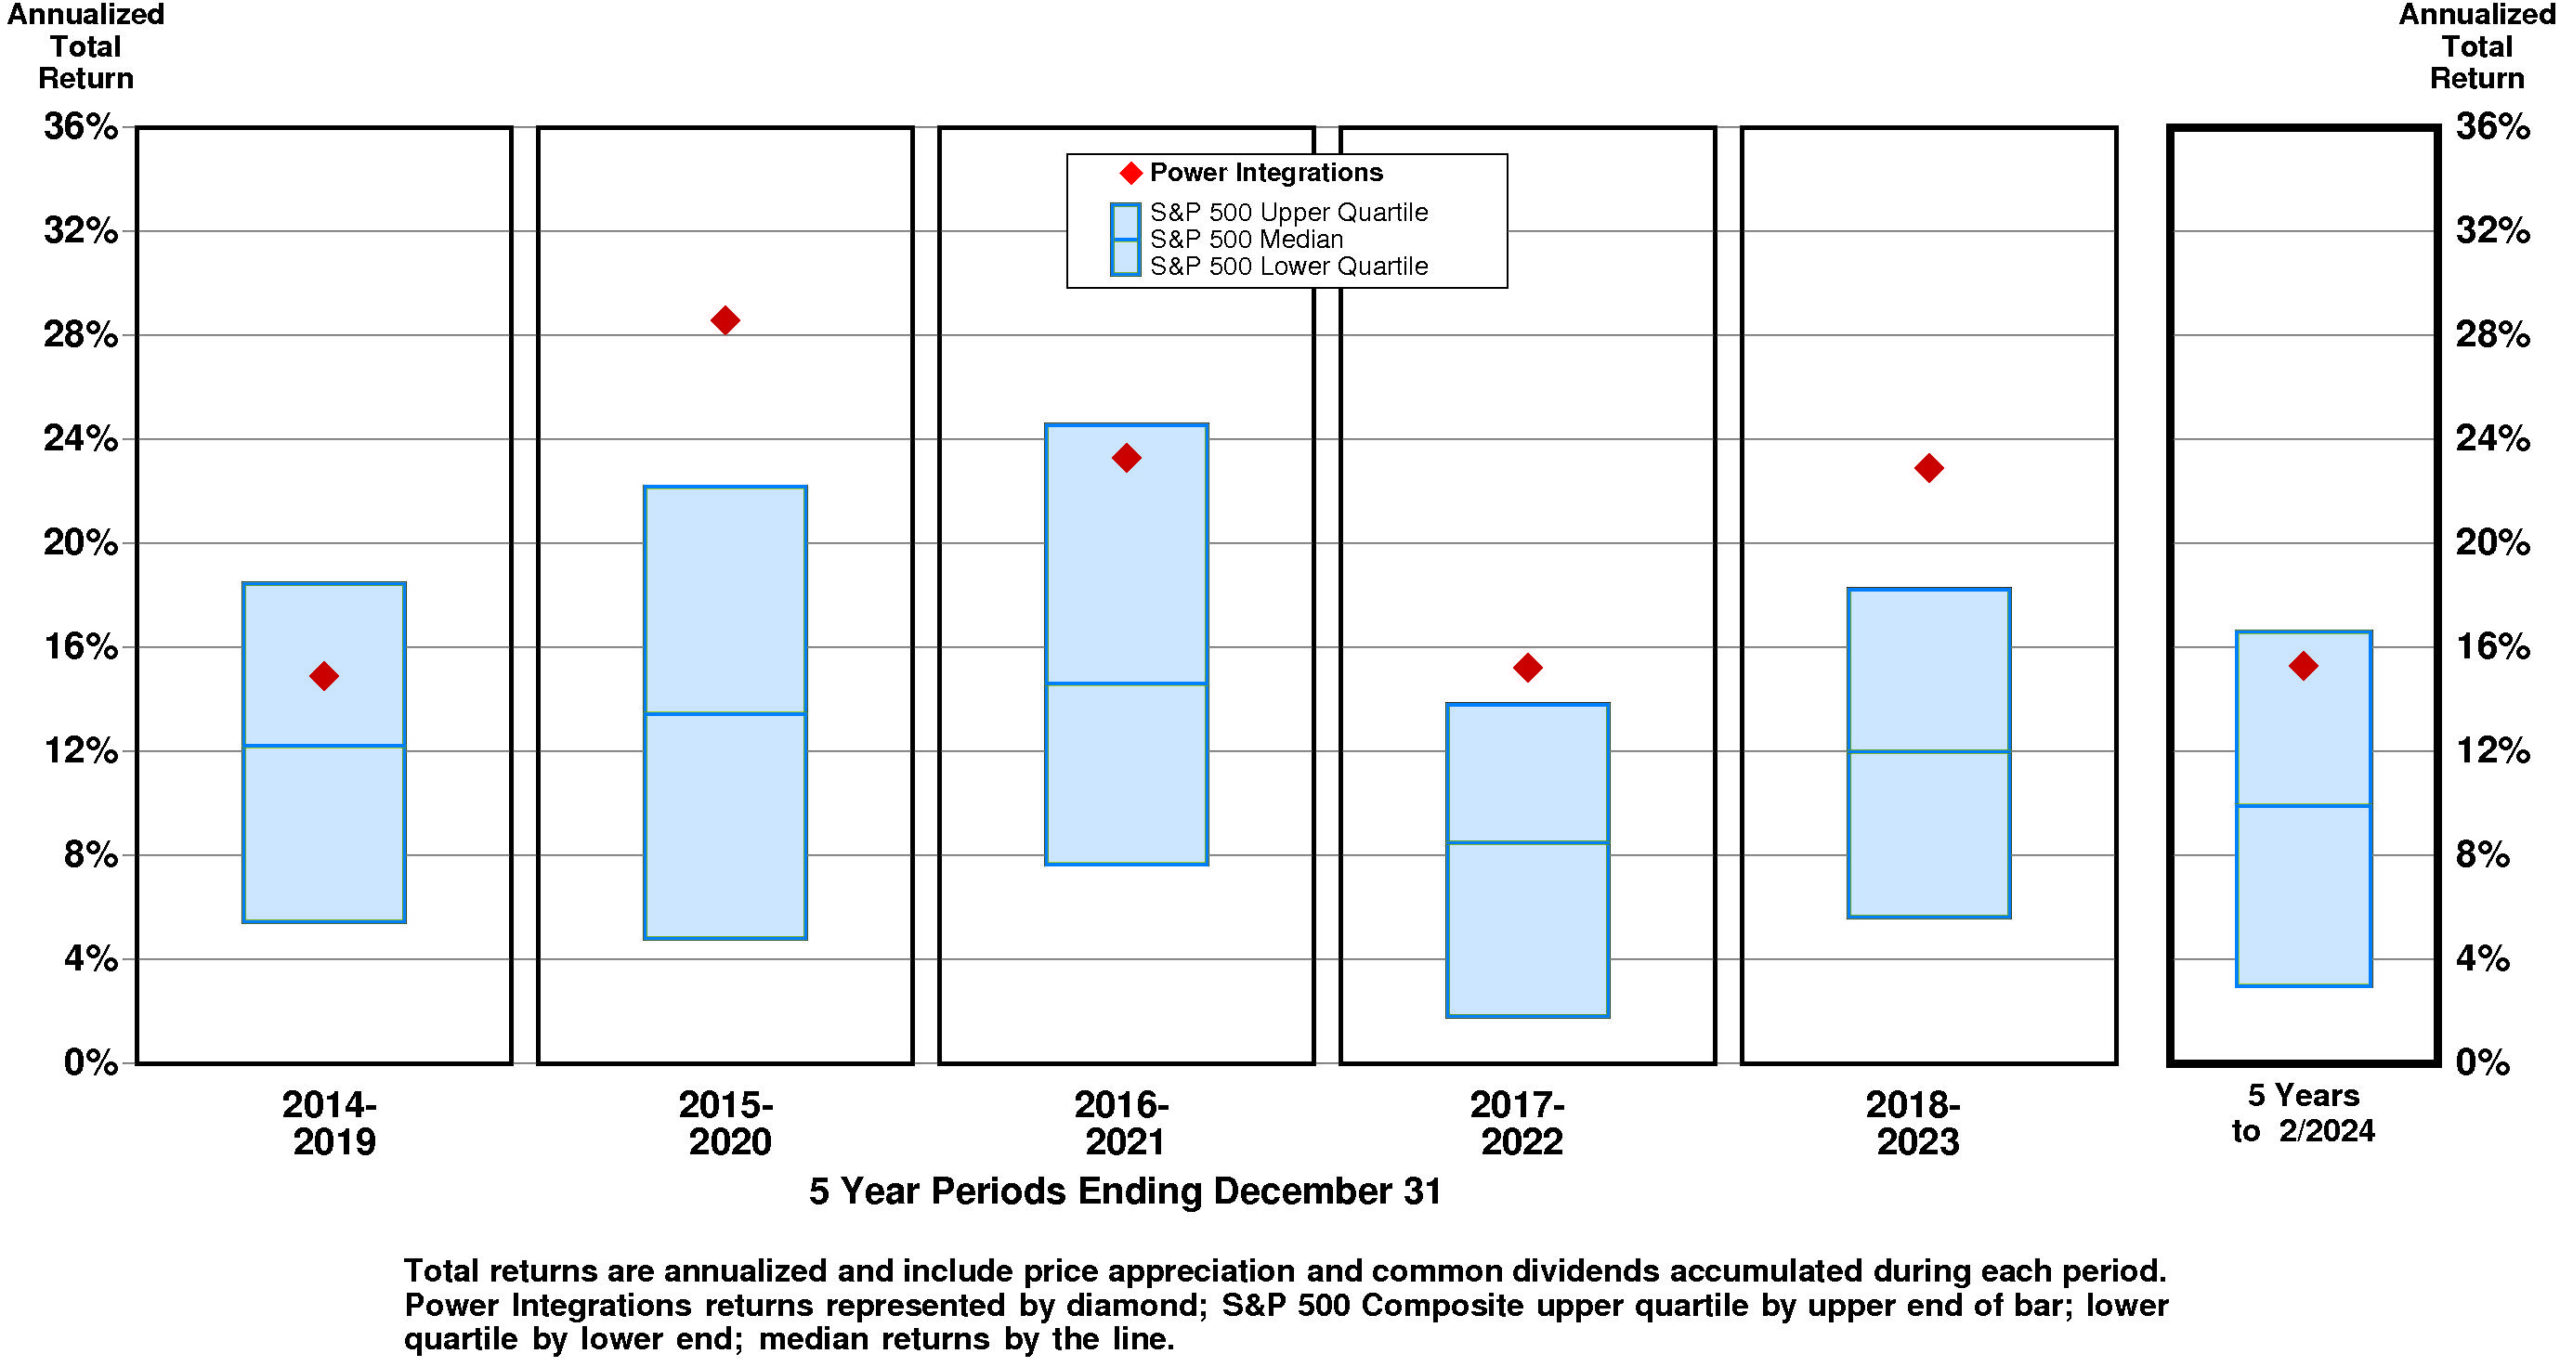
TOTAL INVESTMENT RETURNS
Current annual total return performance of -12.3% is lower quartile relative to the S&P 500 Composite.
In addition to being lower quartile relative to S&P 500 Composite, current annual total return performance through February, 2024 of -12.3% is lower quartile relative to Power Integrations Inc Peer Group.
Current 5-year total return performance of 15.3% is substantially above median relative to the S&P 500 Composite.
Through February, 2024, with substantially above median current 5-year total return of 15.3% relative to S&P 500 Composite, Power Integrations’ total return performance is at the upper quartile relative to Power Integrations Inc Peer Group.
VALUATION BENCHMARKS
Relative to S&P 500 Composite, POWI’s overall valuation is quite high. Four of five factors are upper quartile. The highest factor is the ratio of enterprise value/earnings before interest and taxes, followed by the ratio of enterprise value/assets, then by the price/earnings ratio, then by the ratio of enterprise value/revenue. The lowest factor, price/equity ratio, is above median.
Relative to Power Integrations Peer Group, POWI’s overall valuation is exceptionally high. All five factors are upper quartile. The highest factor is the ratio of enterprise value/earnings before interest and taxes, followed by the price/earnings ratio, then by the ratio of enterprise value/revenue, then by the ratio of enterprise value/assets. The lowest factor is the price/equity ratio.
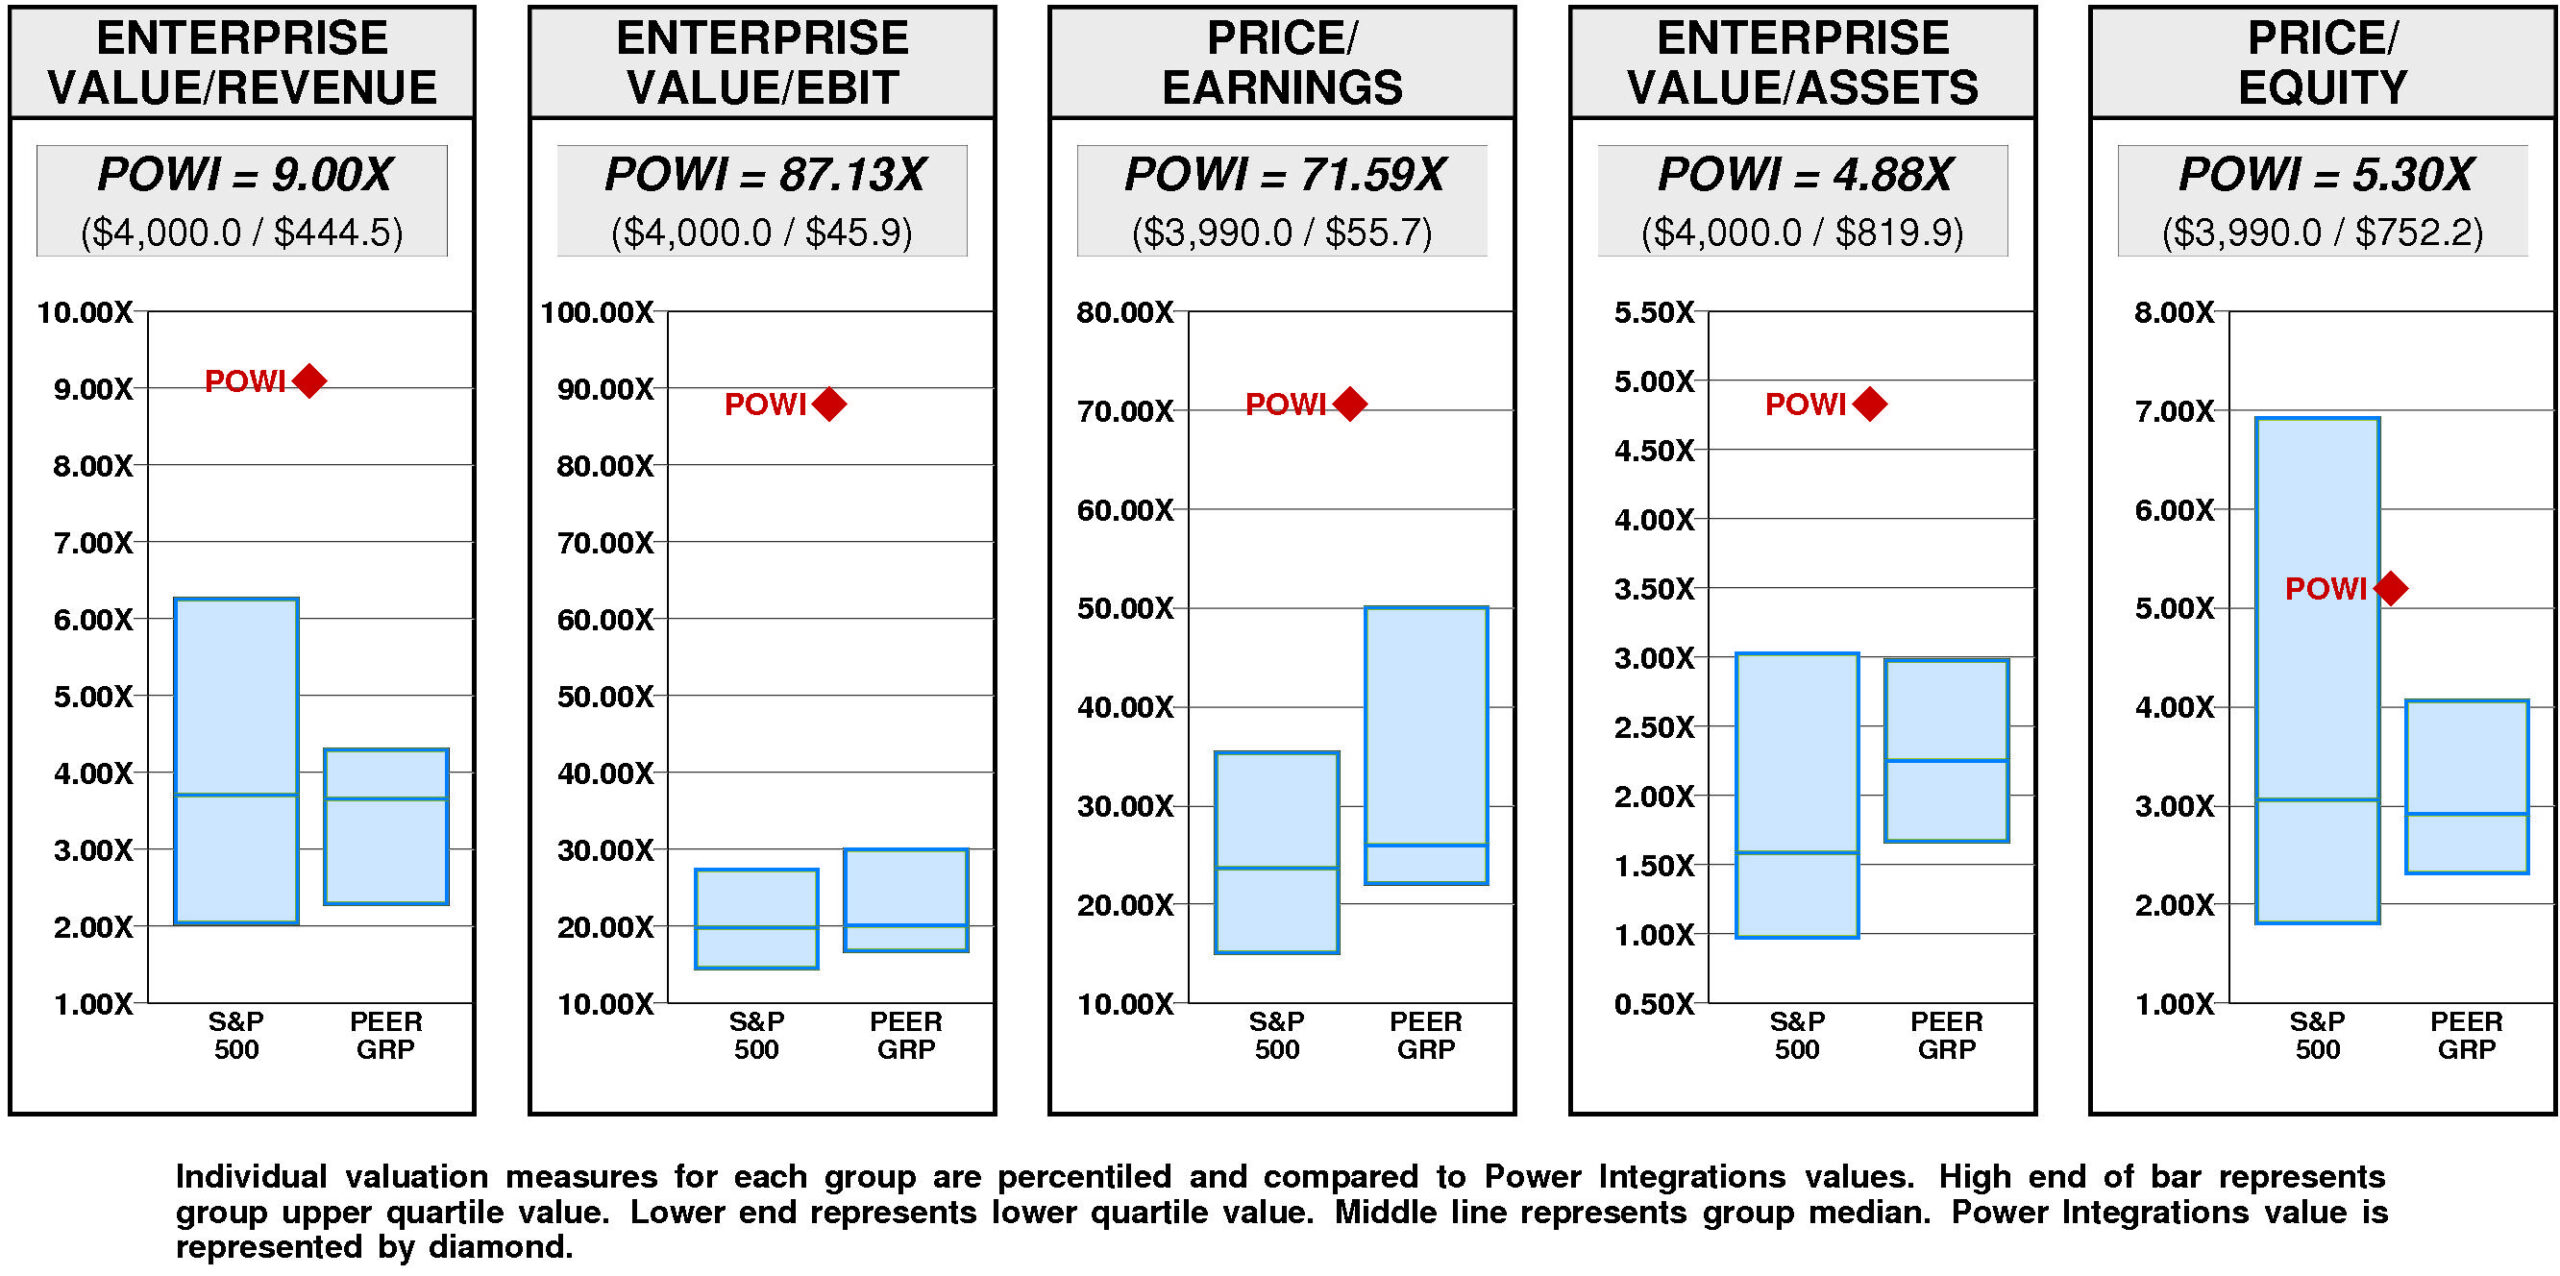
Power Integrations has a major value gap compared to the median valuation. For POWI to achieve median valuation, its current ratio of enterprise value/revenue would have to fall from the current level of 9.00X to 3.66X. If POWI’s ratio of enterprise value/revenue were to fall to 3.66X, its stock price would be lower by $-42 to $28.
For POWI to fall to lower quartile valuation relative to the Power Integrations Peer Group, its current ratio of enterprise value/revenue would have to fall from the current level of 9.00X to 2.30X. If POWI’s ratio of enterprise value/revenue were to fall to 2.30X, its stock price would decline by $-52 from the current level of $70.
VALUE TARGETS
POWI is expected to continue to be an important Value Builder reflecting capital returns that are forecasted to be above the cost of capital.
Power Integrations’ current Price Target of $26 represents a -63% change from the current price of $70.14.
Power Integrations’ very low appreciation potential results in an appreciation score of 8 (92% of the universe has greater appreciation potential.)
Reinforcing this low Appreciation Score of 8, the low Power Rating of 28 contributes to an Value Trend Rating of F.
Power Integrations’ current Price Target is $26 (-32% from the 2023 Target of $38 and -63% from the 03/14/24 price of $70.14). This dramatic fall in the Target is the result of a -4% decrease in the equity base and a -29% decrease in the price/equity multiple. The forecasted decline in growth has a very large negative impact on the price/equity multiple and the forecasted increase in cost of equity has a very large negative impact as well. Partially offsetting these Drivers, the forecasted increase in return on equity has a very large positive impact.
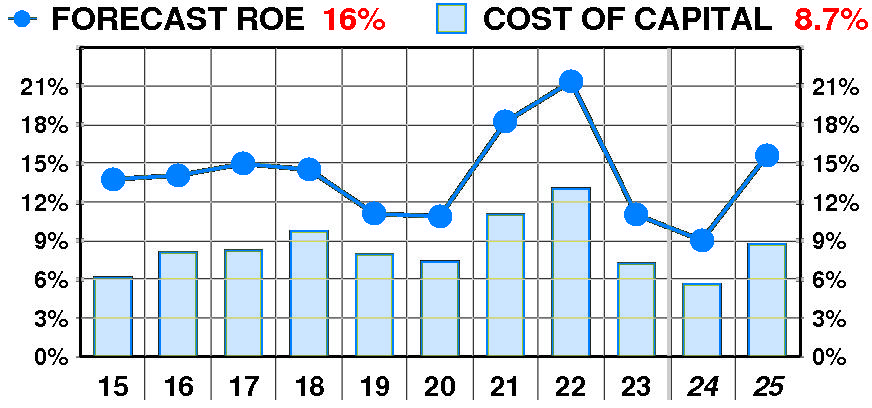
PTR’s return on equity forecast is 15.6% — slightly above our recent forecasts. Forecasted return on equity exhibited a slight, erratic increase between 2015 and 2023. The current forecast is well below the 2022 peak of 21%.
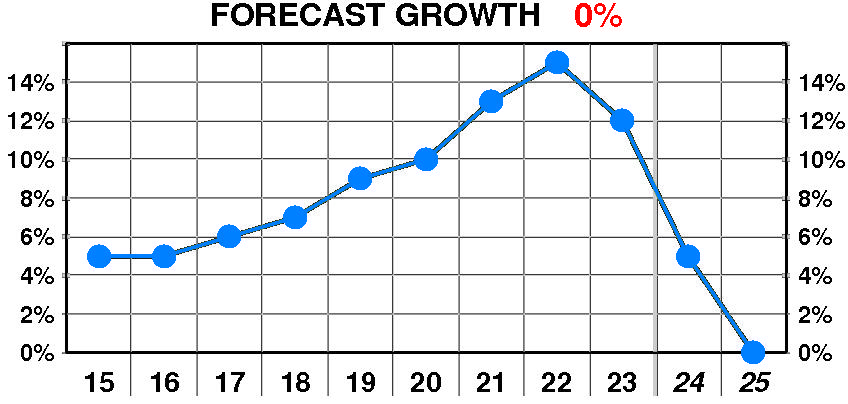
PTR’s growth forecast is 0.0% — significantly below our recent forecasts. Forecasted growth enjoyed a dramatic, steady increase between 2015 and 2023. The current forecast is significantly below the 2022 peak of 15%.
PTR’s cost of equity forecast is 8.7% — in line with recent levels. Forecasted cost of equity suffered a dramatic, erratic increase between 2015 and 2023. The current forecast is below the 2022 peak of 13.0%.
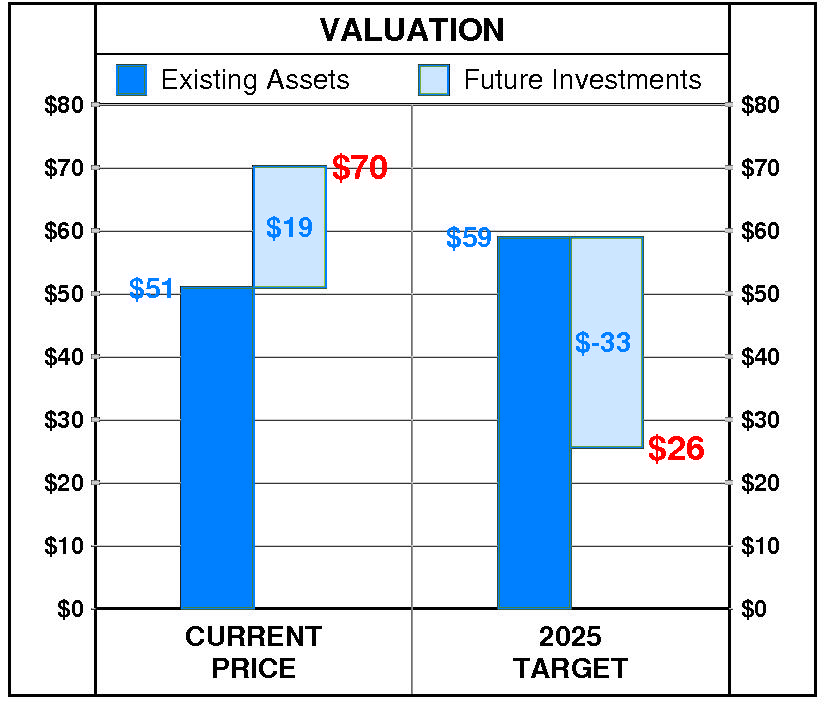
At Power Integrations’ current price of $70.14, investors are placing a positive value of $19 on its future investments. This view is consistent with the company’s most recent performance that reflected a growth rate of 12.0% per year, and a return on equity of 11.0% versus a cost of equity of 7.2%.
PTR’s 2025 Price Target of $26 is based on these forecasts and reflects an estimated value of existing assets of $59 and a value of future investments of $-33.
Be the first to comment