![]()
BUSINESS
Hammond Manufacturing Company Limited, together with its subsidiaries, designs, manufactures, and sells electrical and electronic components in Canada, the United States, and internationally. The company offers electrical enclosures, including mild and stainless steel, aluminum, non-metallic, disconnect, modular freestanding, operator interface, and commercial enclosures; wireway and trough, climate control, and data communication infrastructure products; and general accessories. It also provides small enclosures, such as diecast, plastic, extruded, rock mounted, and industrial enclosures; and general purpose metal and development board products, chassis, and handles and accessories.
INVESTMENT RATING
HMM.A’s future returns on capital are forecasted to exceed the cost of capital. Accordingly, the company is expected to continue to be a modest Value Builder.
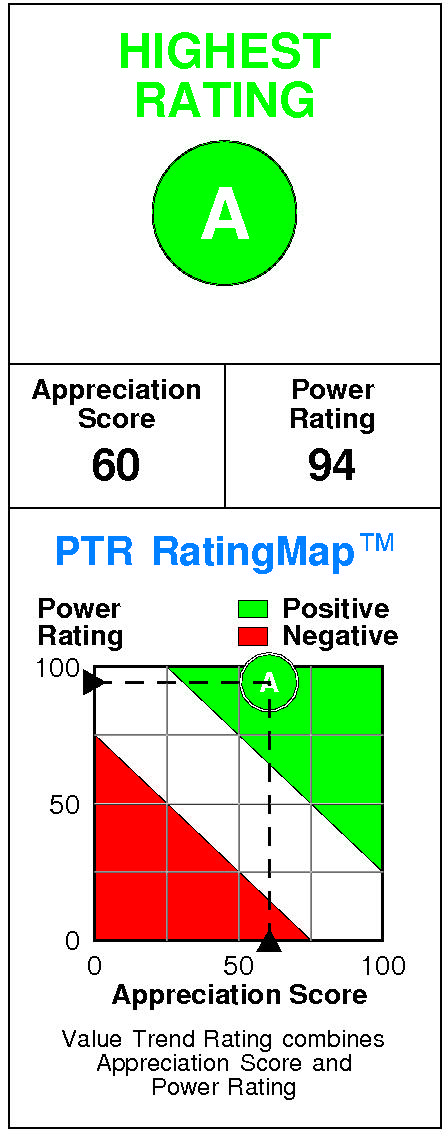
Hammond Manufacturing has a current Value Trend Rating of A (Highest Rating).
The Value Trend Rating reflects complementary signals from PTR’s two proprietary measures of a stock’s attractiveness. Hammond Manufacturing has a slightly positive Appreciation Score of 60 and a very high Power Rating of 94, leading to the Highest Value Trend Rating.
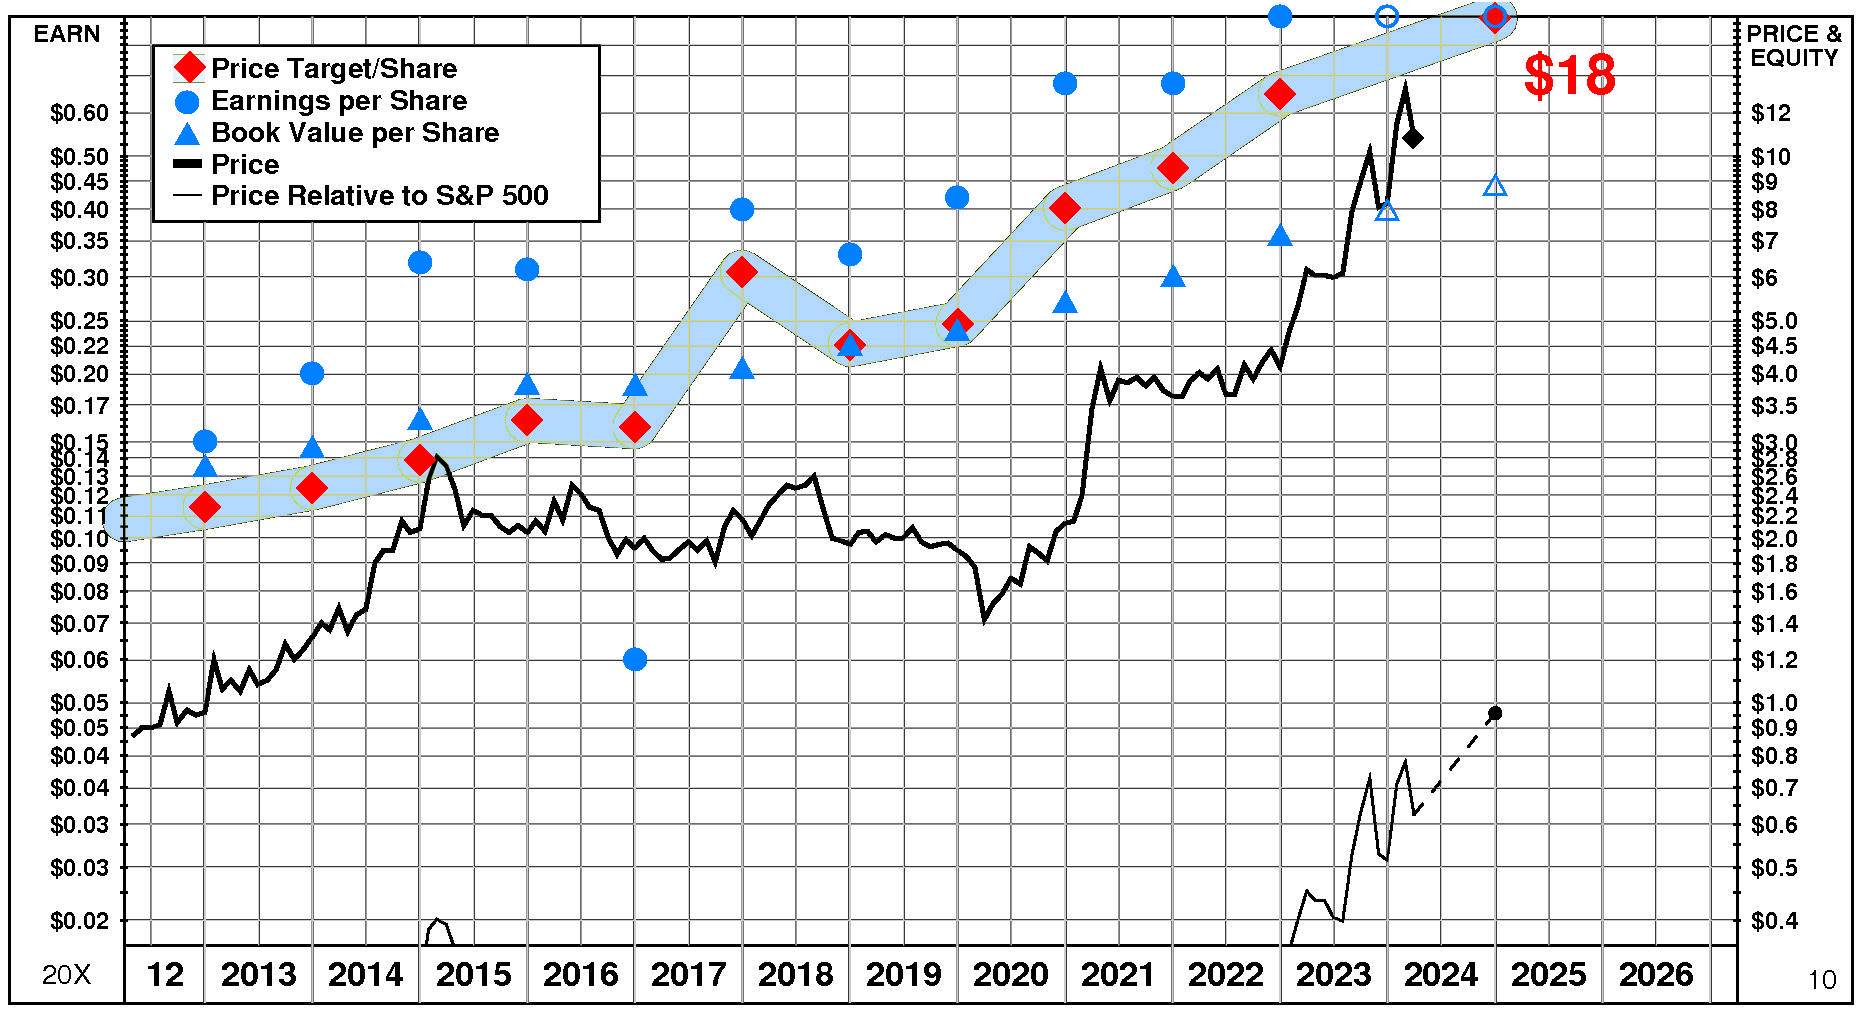
Hammond Manufacturing’s stock is selling well below targeted value. The current stock price of $10.82 compares to targeted value 12 months forward of $18.
This moderately high appreciation potential results in an appreciation score of 60 (only 40% of the universe has greater appreciation potential.)
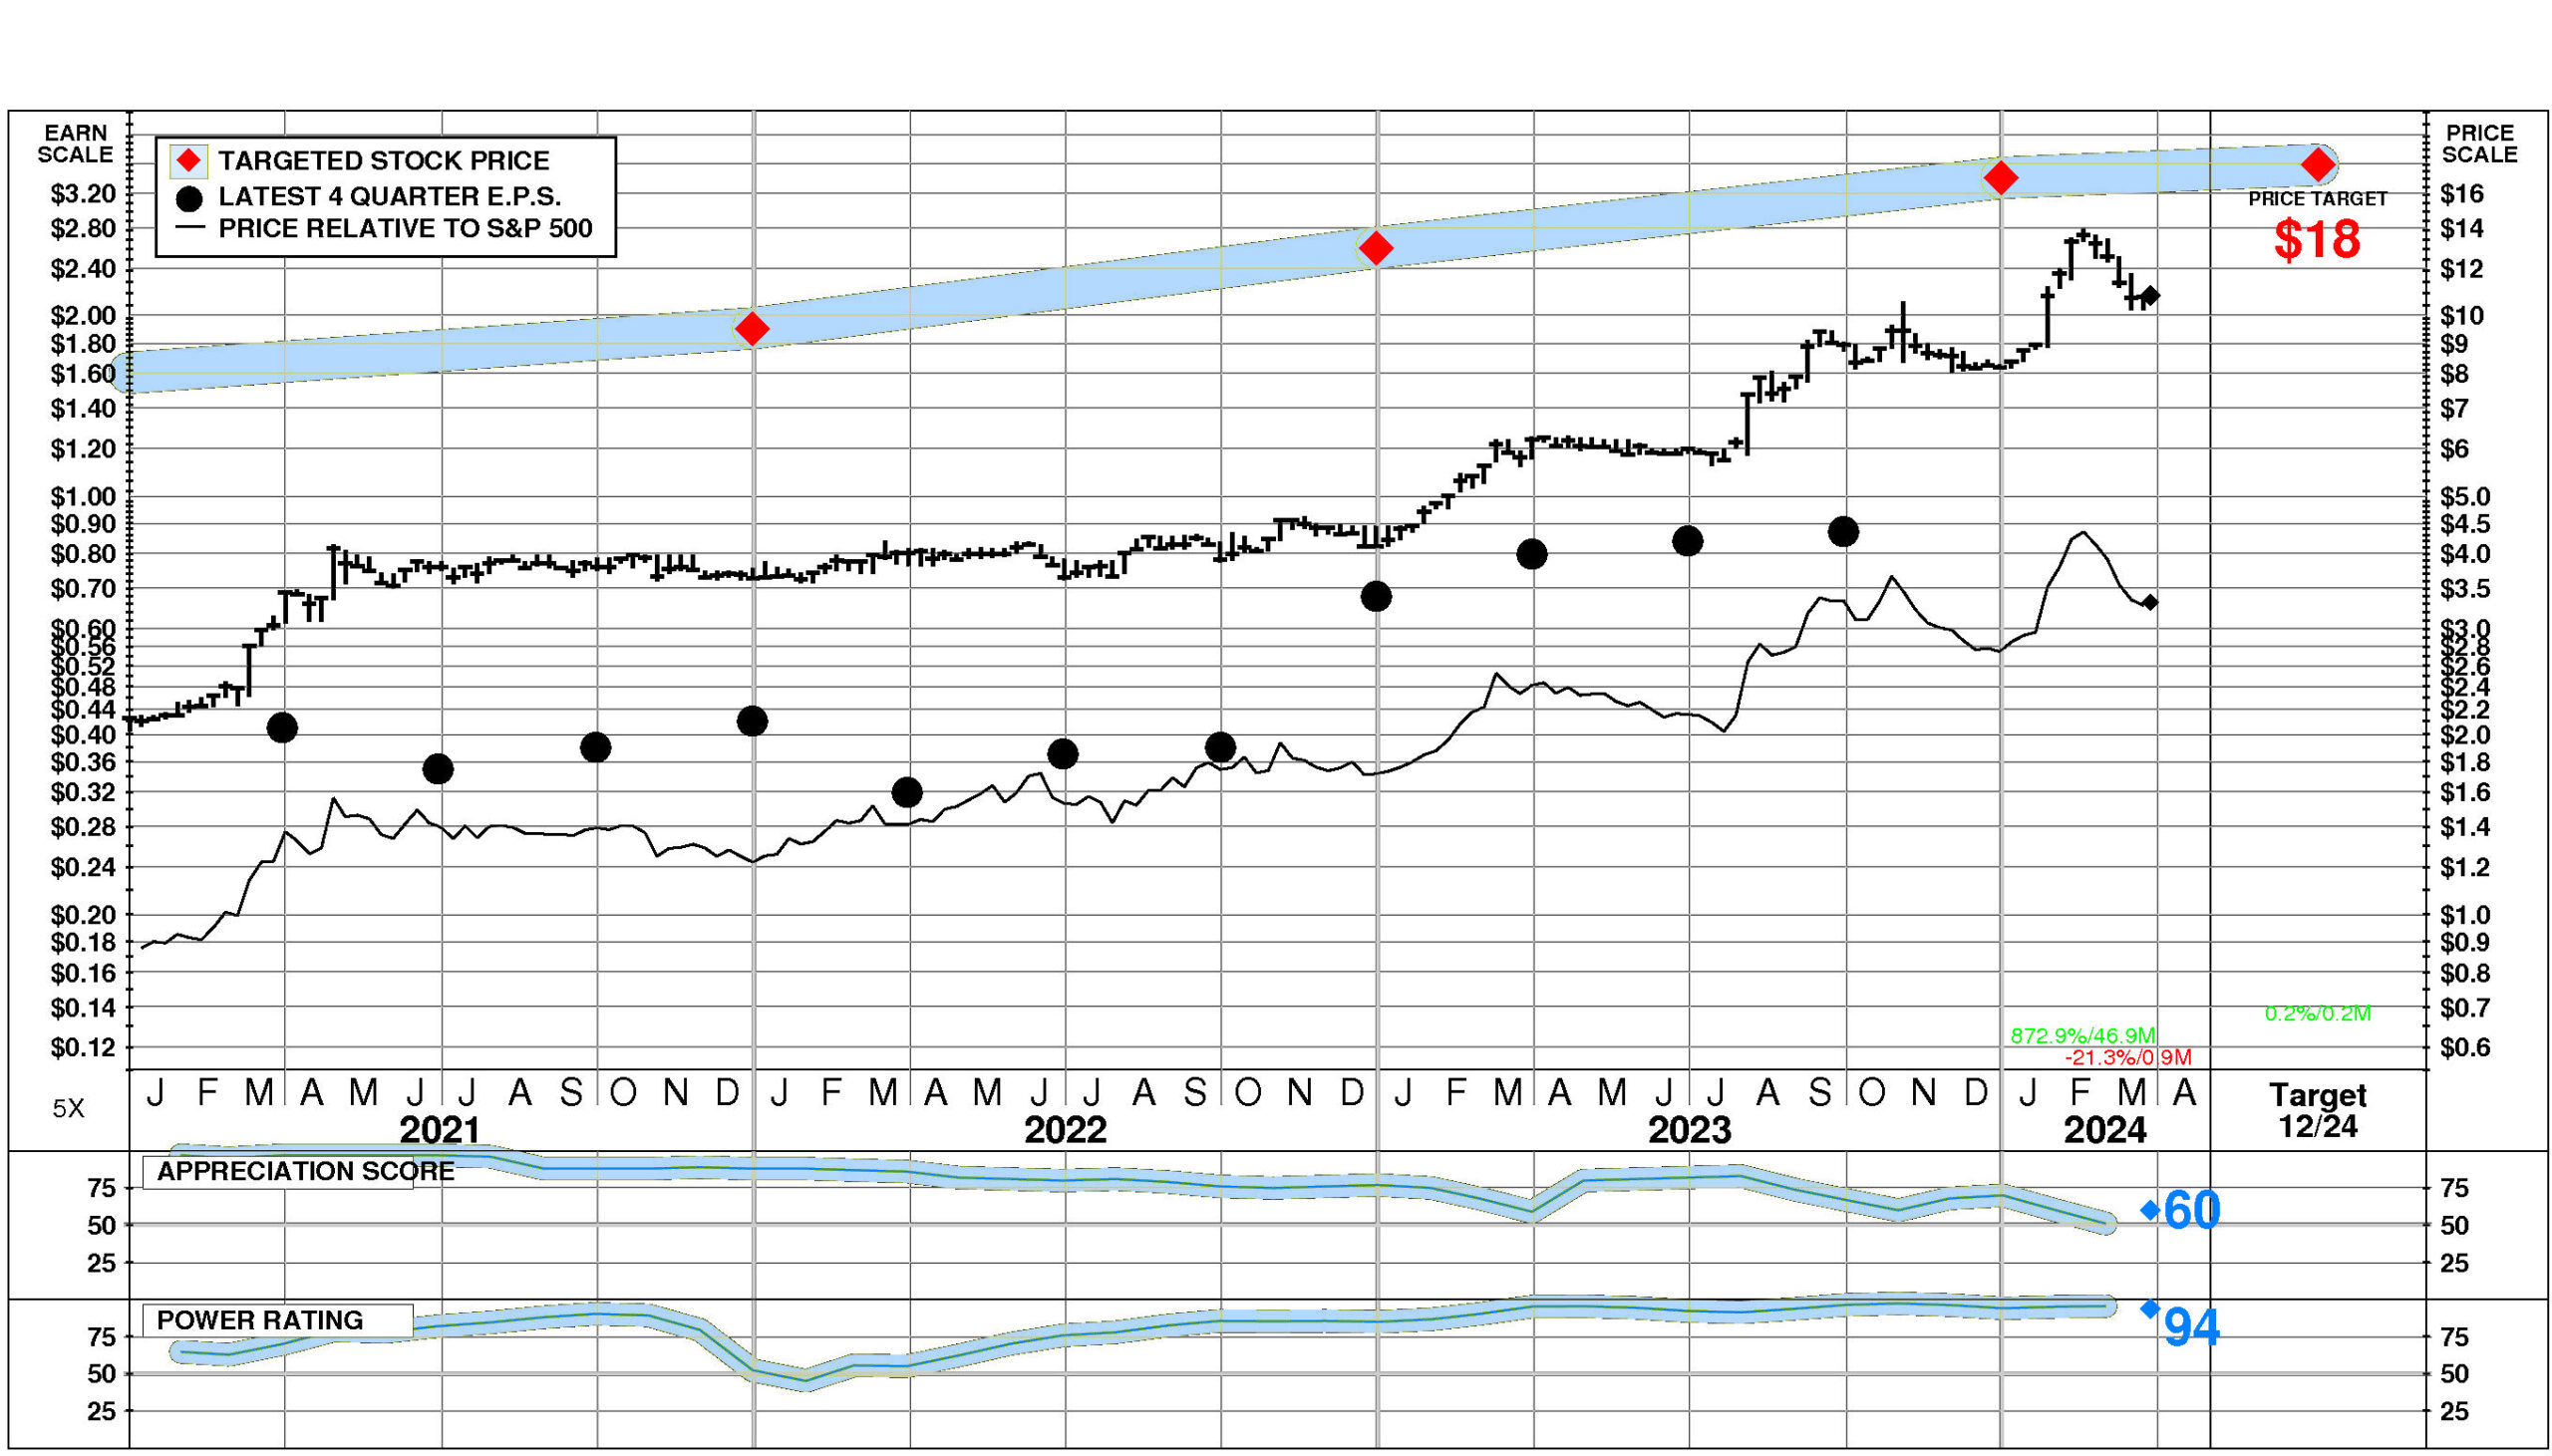
Hammond Manufacturing has a Power Rating of 94. (HMM.A’s very high Power Rating indicates that it has a higher likelihood of achieving favorable investment performance over the near to intermediate term than all but 6% of companies in the universe.)
Factors contributing to this very high Power Rating include: recent price action has been extremely favorable; and the Electric Lighting, Wiring Equipment comparison group is currently in a modestly favorable position.
INVESTMENT PROFILE
HMM.A’s financial strength is high. Financial strength rating is 71.
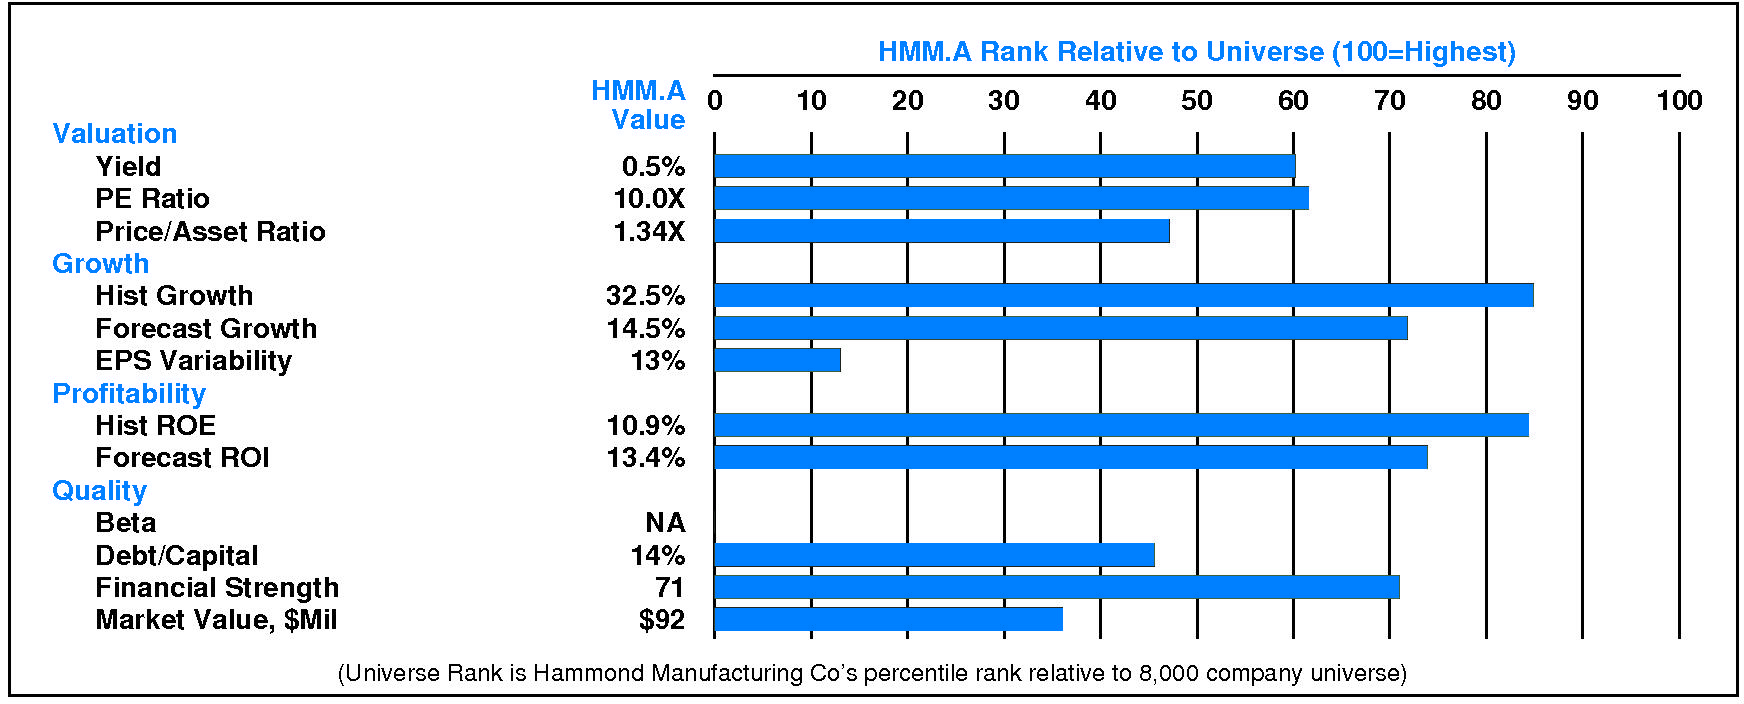
Relative to the S&P 500 Composite, Hammond Manufacturing Co Ltd has neutral Growth/Value characteristics; its appeal is likely to be to investors neutral towards Income; the perception is that HMM.A is lower risk. All factors are relative strengths. HMM.A’s valuation is low: low dividend yield, low P/E ratio, and low price/book ratio. HMM.A has unusually low market capitalization.
CURRENT SIGNALS
Hammond Manufacturing’s current operations are strong. Return on equity is rising, reflecting: widening pretax margins; and rising leverage.
Hammond Manufacturing’s current technical position is mixed. The stock price is in a 0.9 month down move. The stock has declined 17.6% from its prior high. The 200 day moving average is in an uptrend. The stock price is below its 200 day moving average.
ALERTS
Modest change in Hammond Manufacturing Co’s fundamentals has recently occurred: significant quarterly earnings acceleration.
The stock is currently rated A.
Hammond Manufacturing Co Ltd (TSE: HMM.A) stock rose modestly by 0.9% on 3/22/24. The stock closed at $10.74. However, exceptionally low trading volume at 26% of normal accompanied the advance. Relative to the market the stock has been exceptionally strong over the last nine months but has declined -1.6% during the last week.
CASH FLOW
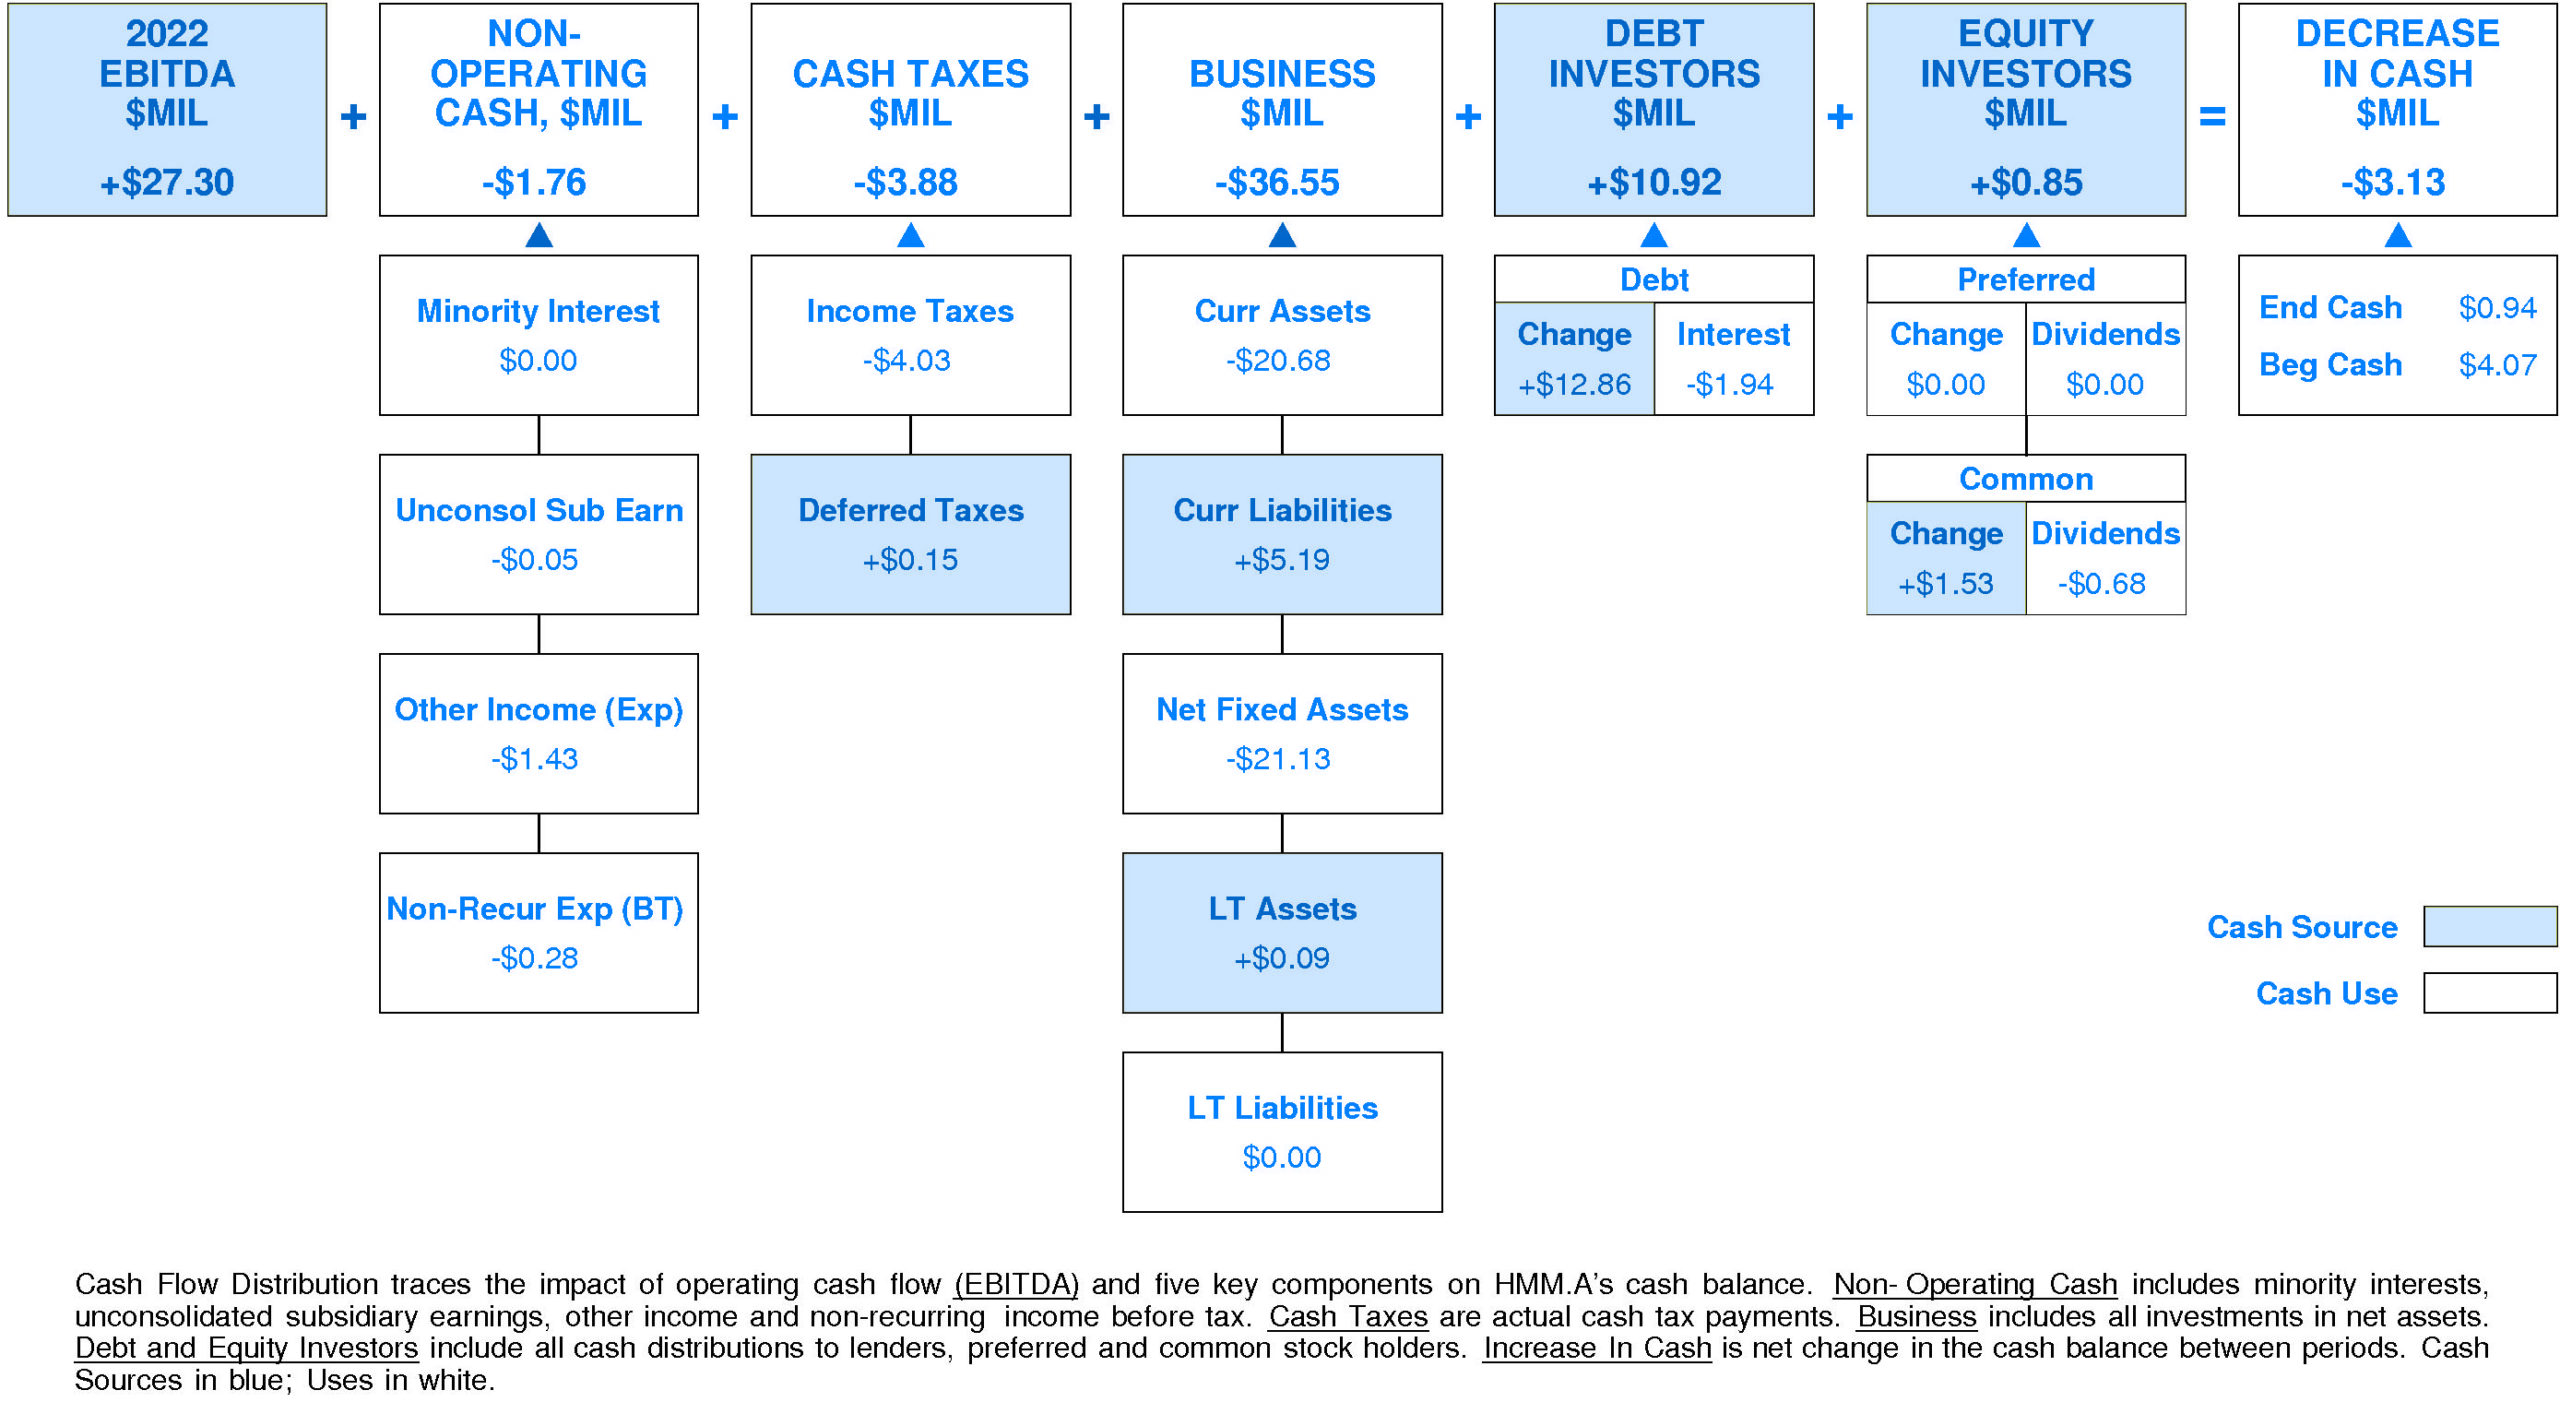
In 2022, Hammond Manufacturing Co experienced a very significant reduction in cash of -$3.13 million (-77%). Sources of cash were much lower than uses. Cash generated from 2022 EBITDA totaled +$27.30 million. Non-operating uses consumed -$1.76 million (-6% of EBITDA). Cash taxes consumed -$3.88 million (-14% of EBITDA). Re-investment in the business amounted to -$36.55 million (-134% of EBITDA). On a net basis, debt investors provided +$10.92 million (+40% of EBITDA) while equity investors provided +$0.85 million (+3% of EBITDA).
HMM.A’s Non-operating Income, %EBITDA has exhibited a volatile overall uptrend over the period. This improvement was accompanied by stability for the Hammond Manufacturing Co Peer Group. In most years, Hammond Manufacturing Co was in the top quartile and second quartile. Currently, Hammond Manufacturing Co is at median at -6% of EBITDA (-$1.76 million).
HMM.A’s Cash Taxes, %EBITDA has exhibited a volatile overall uptrend over the period. This improvement was accompanied by stability for the Hammond Manufacturing Co Peer Group. In most years, Hammond Manufacturing Co was in the top quartile and third quartile. Currently, Hammond Manufacturing Co is at median at -14% of EBITDA (-$3.88 million).
HMM.A’s Business Re-investment, %EBITDA has experienced a downtrend over the period. This downtrend was accompanied by a similar trend for the Hammond Manufacturing Co Peer Group. (Since 2020 Business Re-investment, %EBITDA has accelerated very sharply.) In most years, Hammond Manufacturing Co was in the third quartile and lower quartile. Currently, Hammond Manufacturing Co is lower quartile at -134% of EBITDA (-$36.55 million).
HMM.A’s Debt Investors, %EBITDA has exhibited a volatile overall uptrend over the period. This improvement was accompanied by stability for the Hammond Manufacturing Co Peer Group. (Since 2020 Debt Investors, %EBITDA has accelerated very sharply.) In most years, Hammond Manufacturing Co was in the top quartile and lower quartile. Currently, Hammond Manufacturing Co is upper quartile at +40% of EBITDA (+$10.92 million).
HMM.A’s Equity Investors, %EBITDA has experienced a downtrend over the period. This downtrend was accompanied by an opposite trend for the Hammond Manufacturing Co Peer Group. (Since 2019 Equity Investors, %EBITDA has experienced a very sharp recovery.) In most years, Hammond Manufacturing Co was in the top quartile and second quartile. Currently, Hammond Manufacturing Co is at the upper quartile at +3% of EBITDA (+$0.85 million).
HMM.A’s Change in Cash, %EBITDA has exhibited little to no overall change over the period. This stability was accompanied by an uptrend for the Hammond Manufacturing Co Peer Group. (Since 2020 Change in Cash, %EBITDA has experienced a very sharp decline.) In most years, Hammond Manufacturing Co was in the second quartile and third quartile. Currently, Hammond Manufacturing Co is lower quartile at -11% of EBITDA (-$3.13 million).
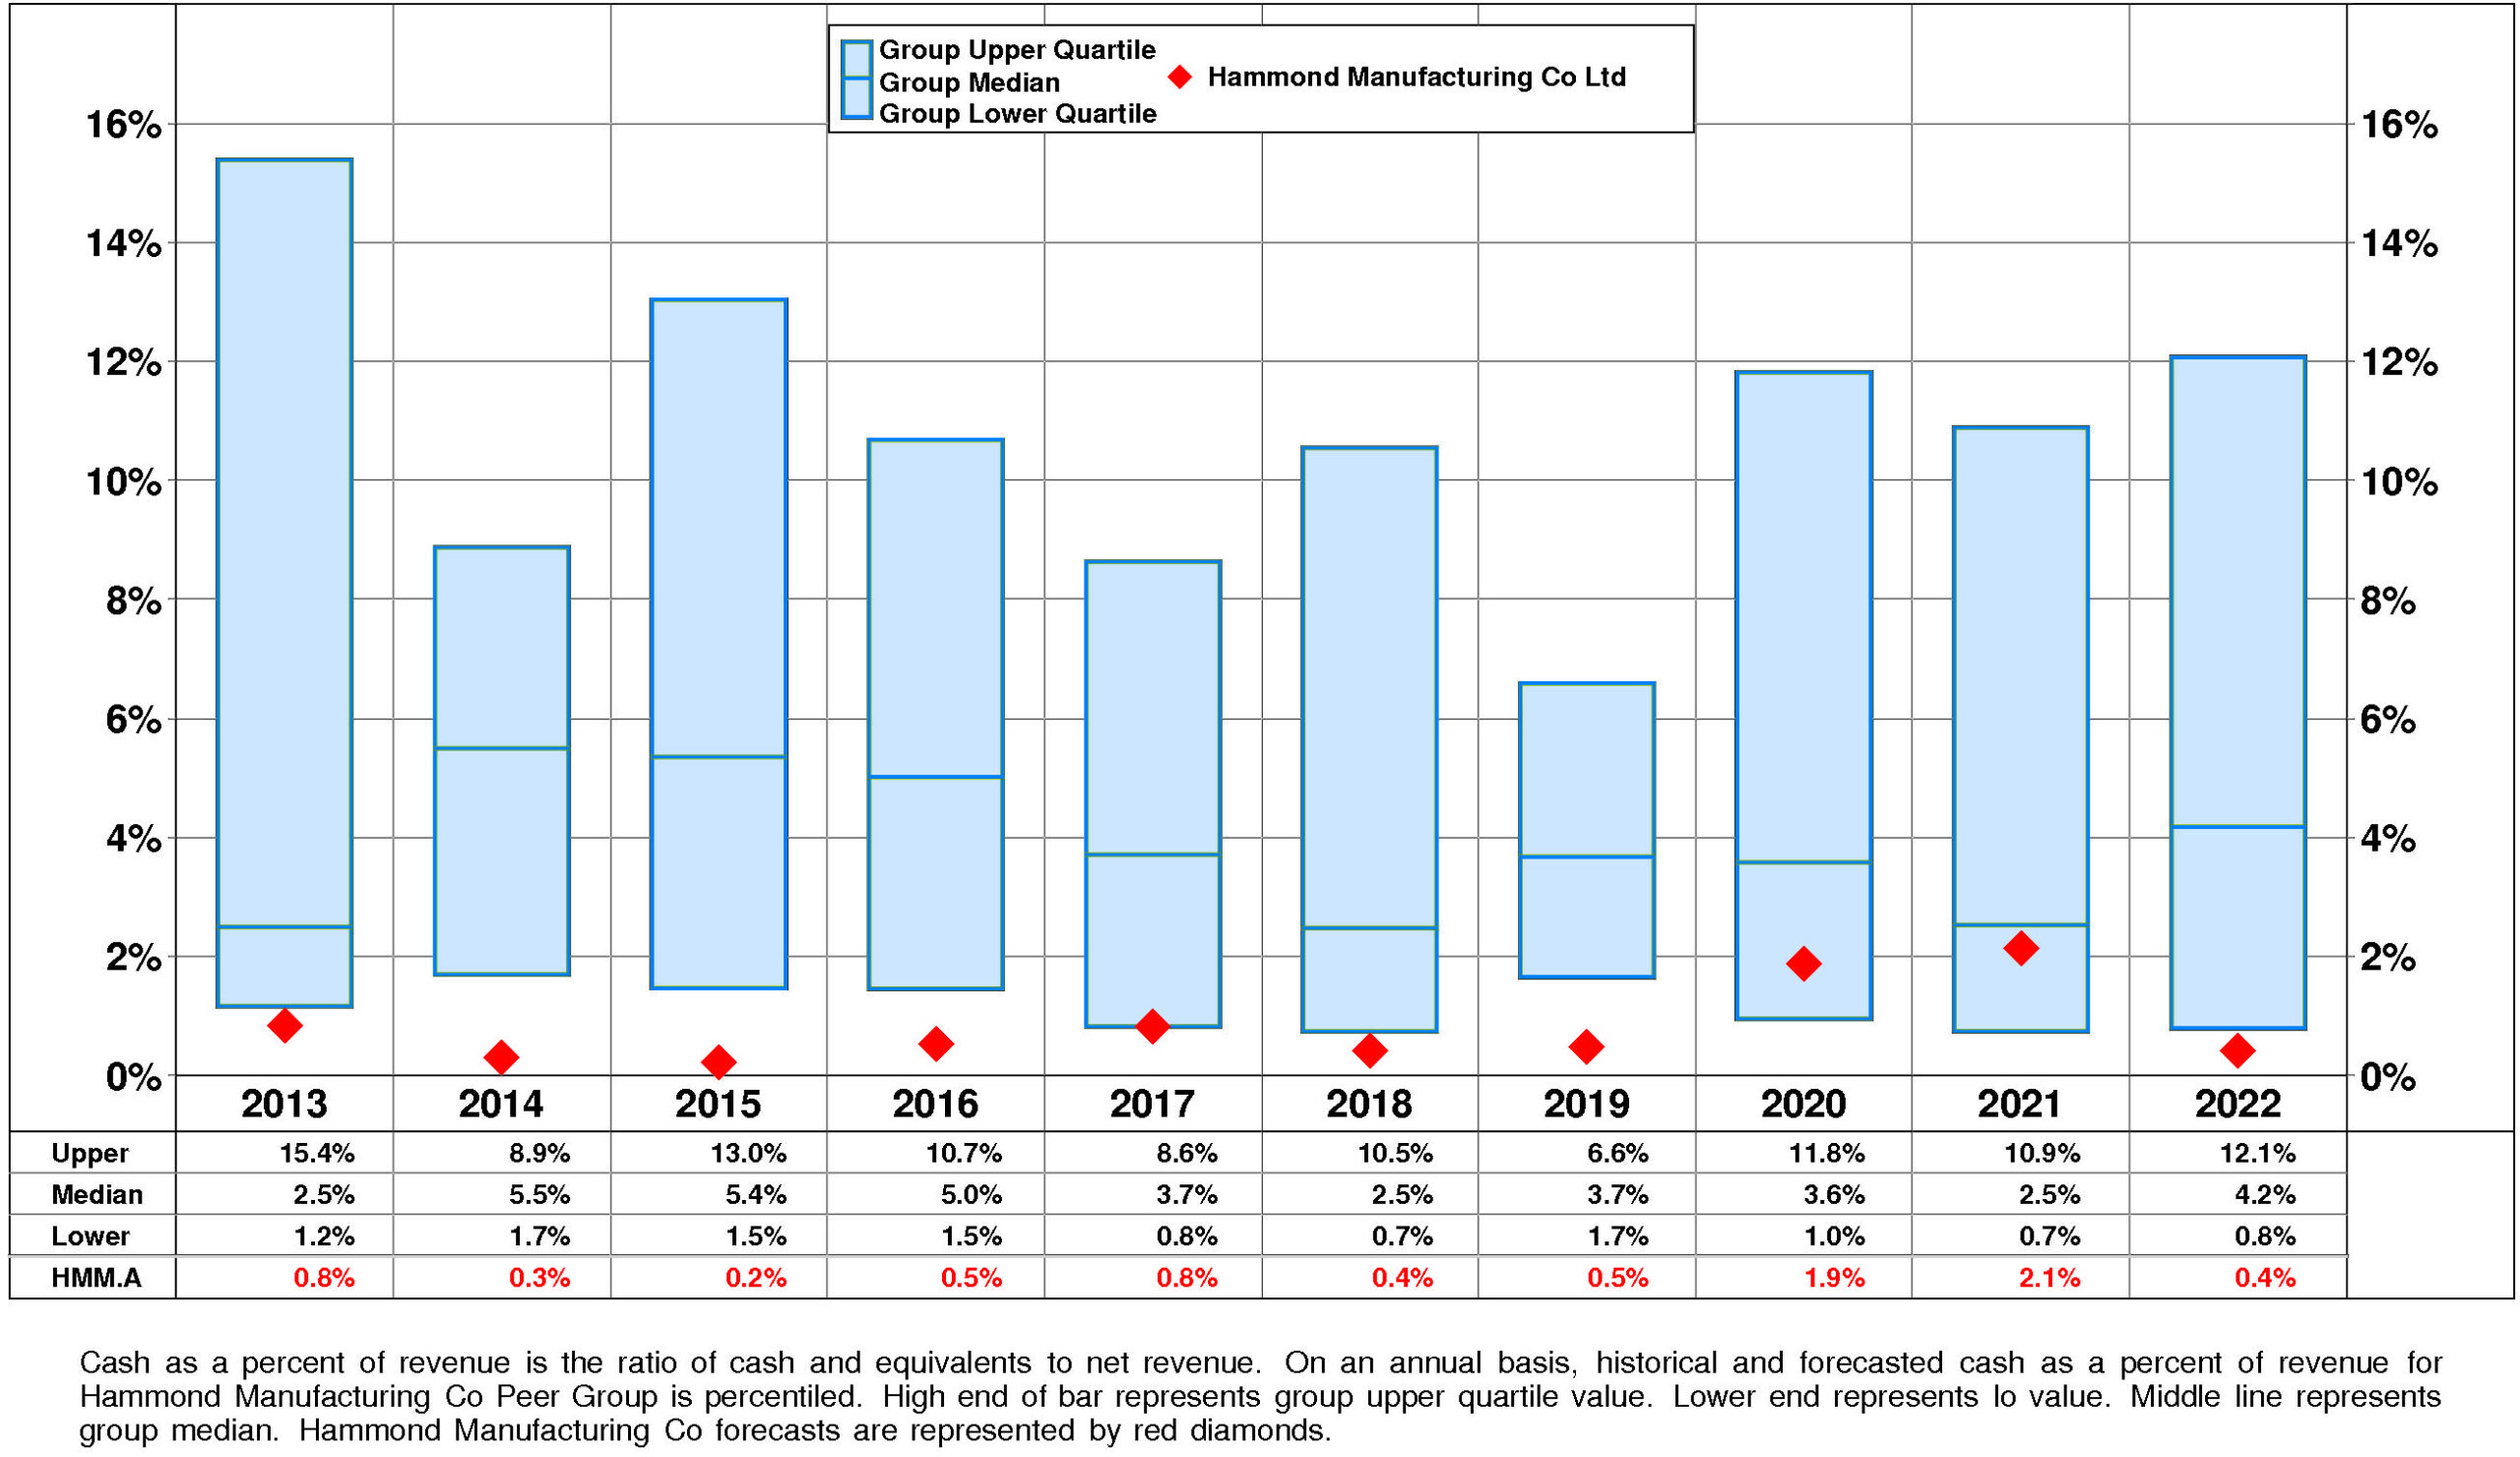
HMM.A’s Cash, %Revenue has exhibited little to no overall change over the period. This stability was accompanied by stability for the Hammond Manufacturing Co Peer Group as well. In most years, Hammond Manufacturing Co was in the lower quartile and third quartile. Currently, Hammond Manufacturing Co is lower quartile at +0%.
PROFITABILITY
HMM.A’s return on equity has improved very significantly since 2013. The current level of 19.8% is 2.93X the low for the period and is at the high.
This very significant improvement was due to very strong positive trend in pretax operating return and strong positive trend in non-operating factors.
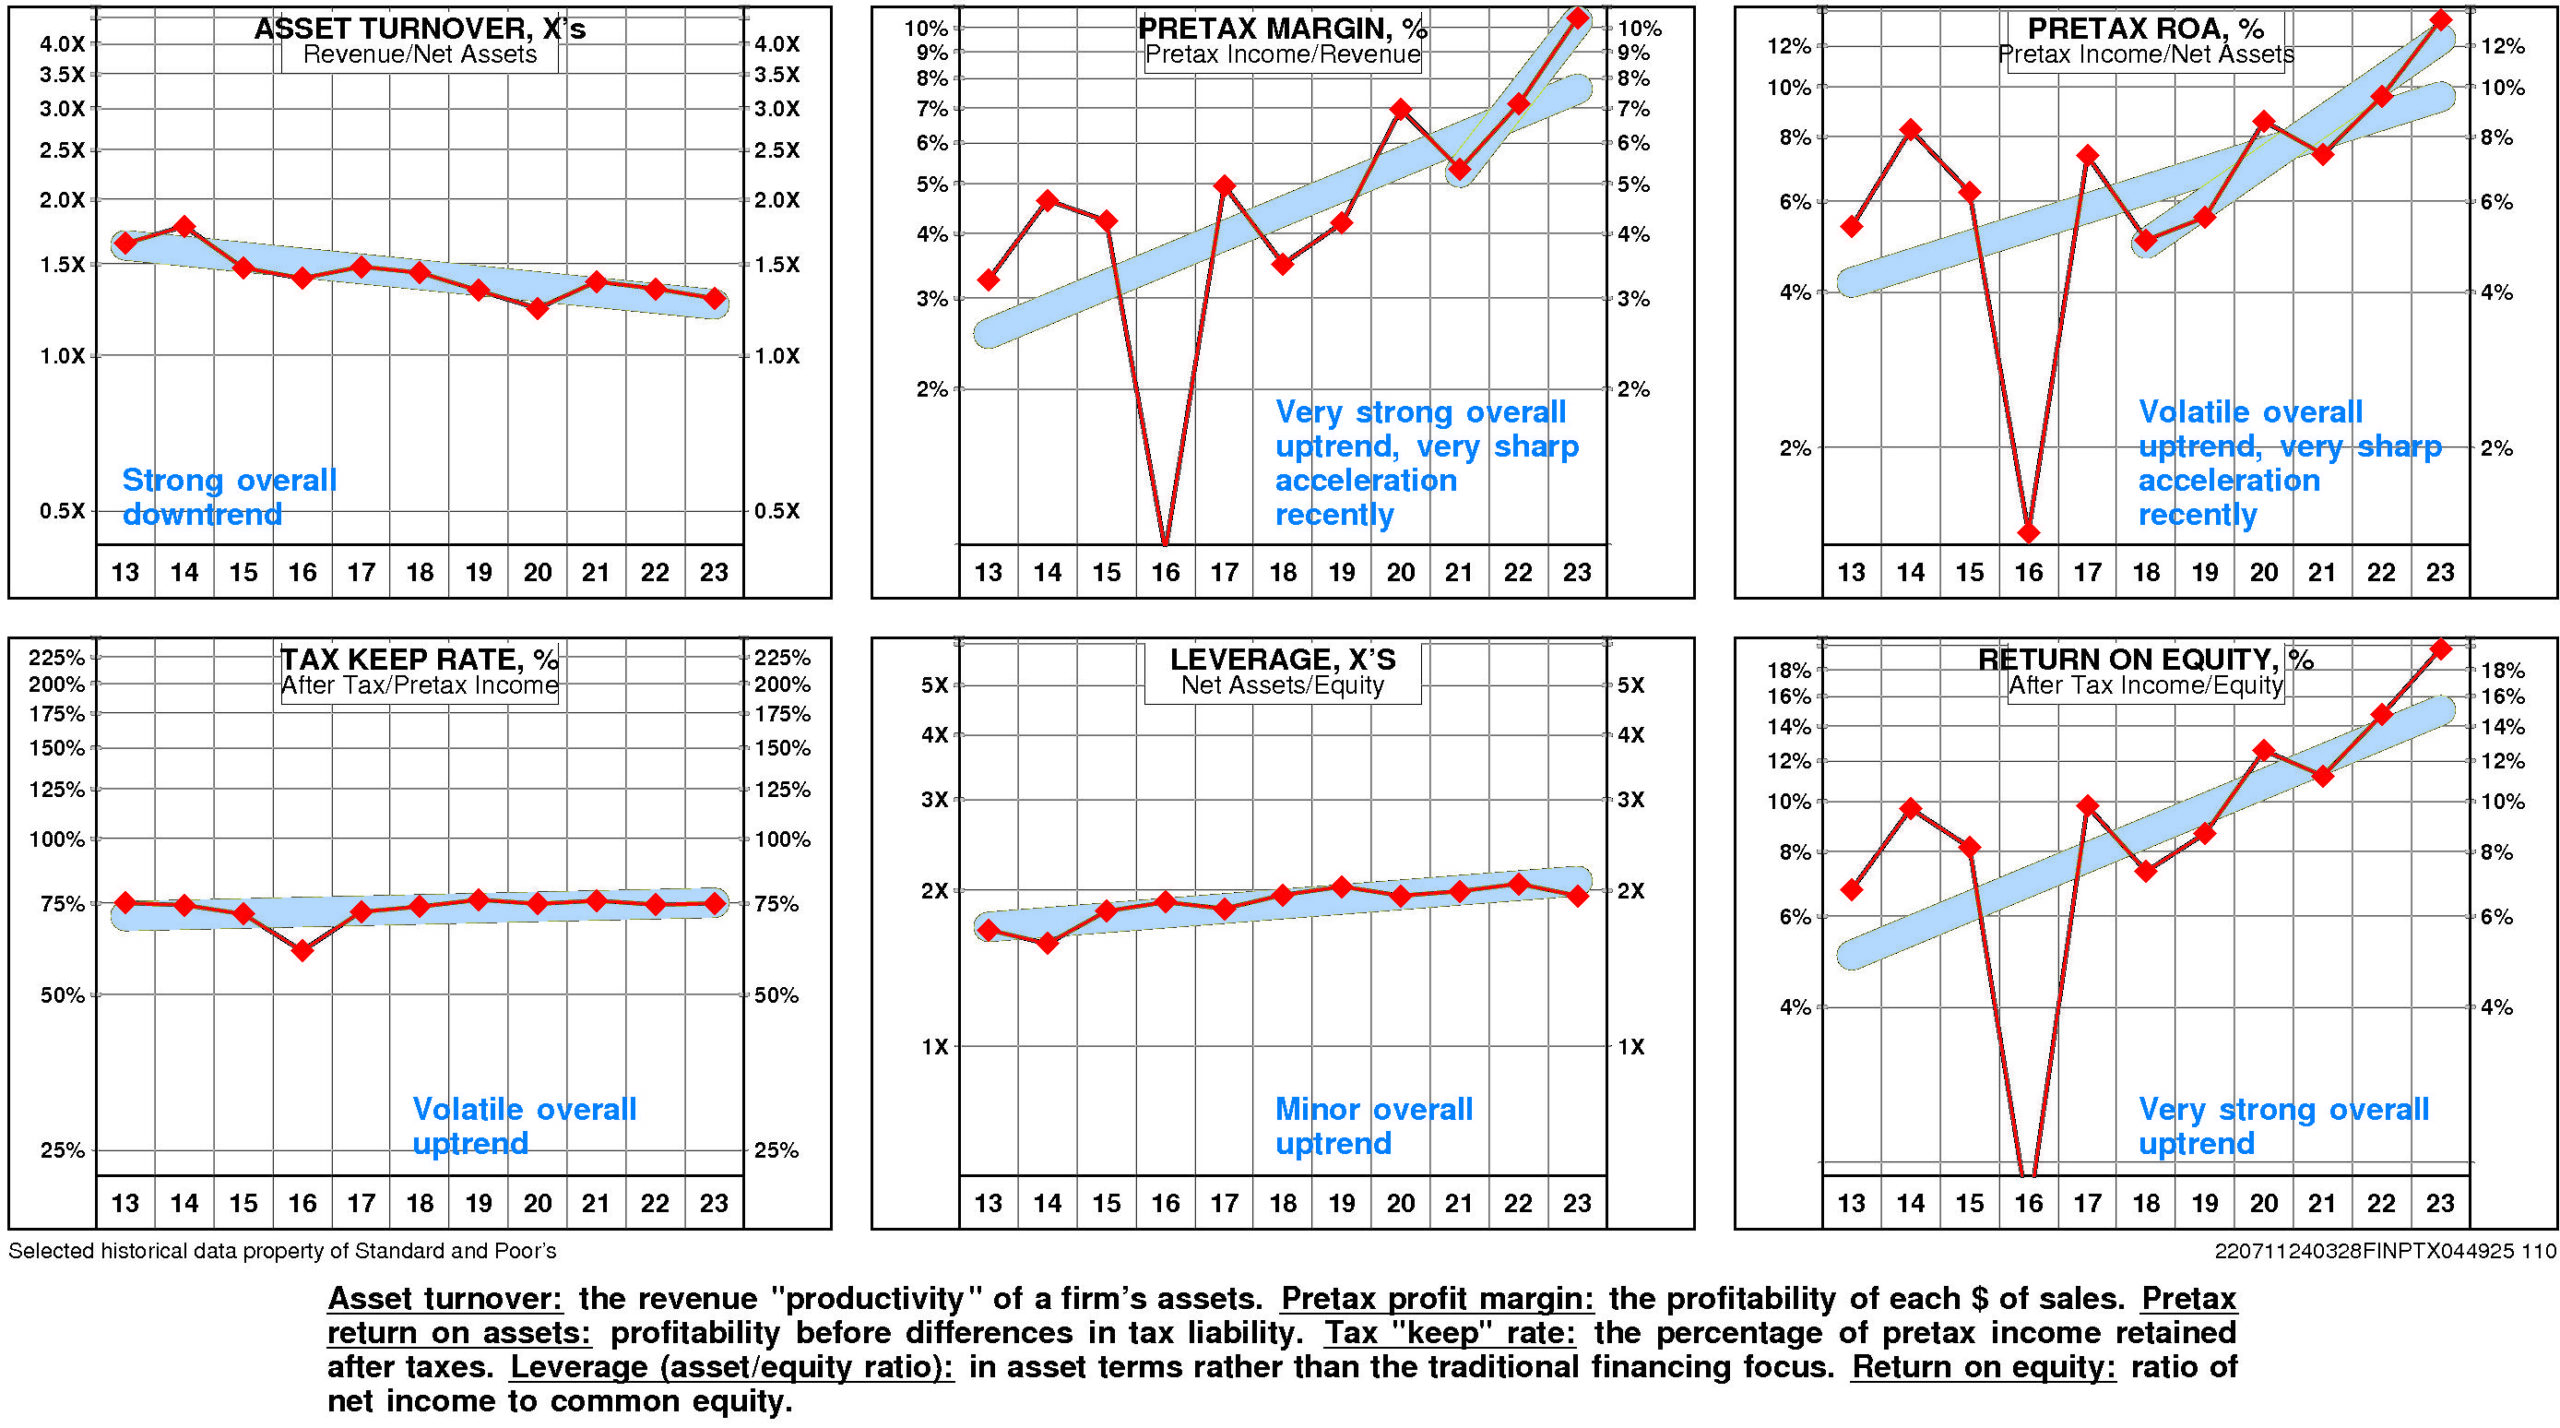
The productivity of HMM.A’s assets declined over the full period 2013-2023: asset turnover has suffered a strong overall downtrend.
More than offsetting this trend, however, pretax margin enjoyed a very strong overall uptrend that accelerated very sharply from the 2021 level.
Non-operating factors (income taxes and financial leverage) had a significant positive influence on return on equity.
HMM.A’s return on equity is upper quartile (19.8%) for the four quarters ended September, 2023.
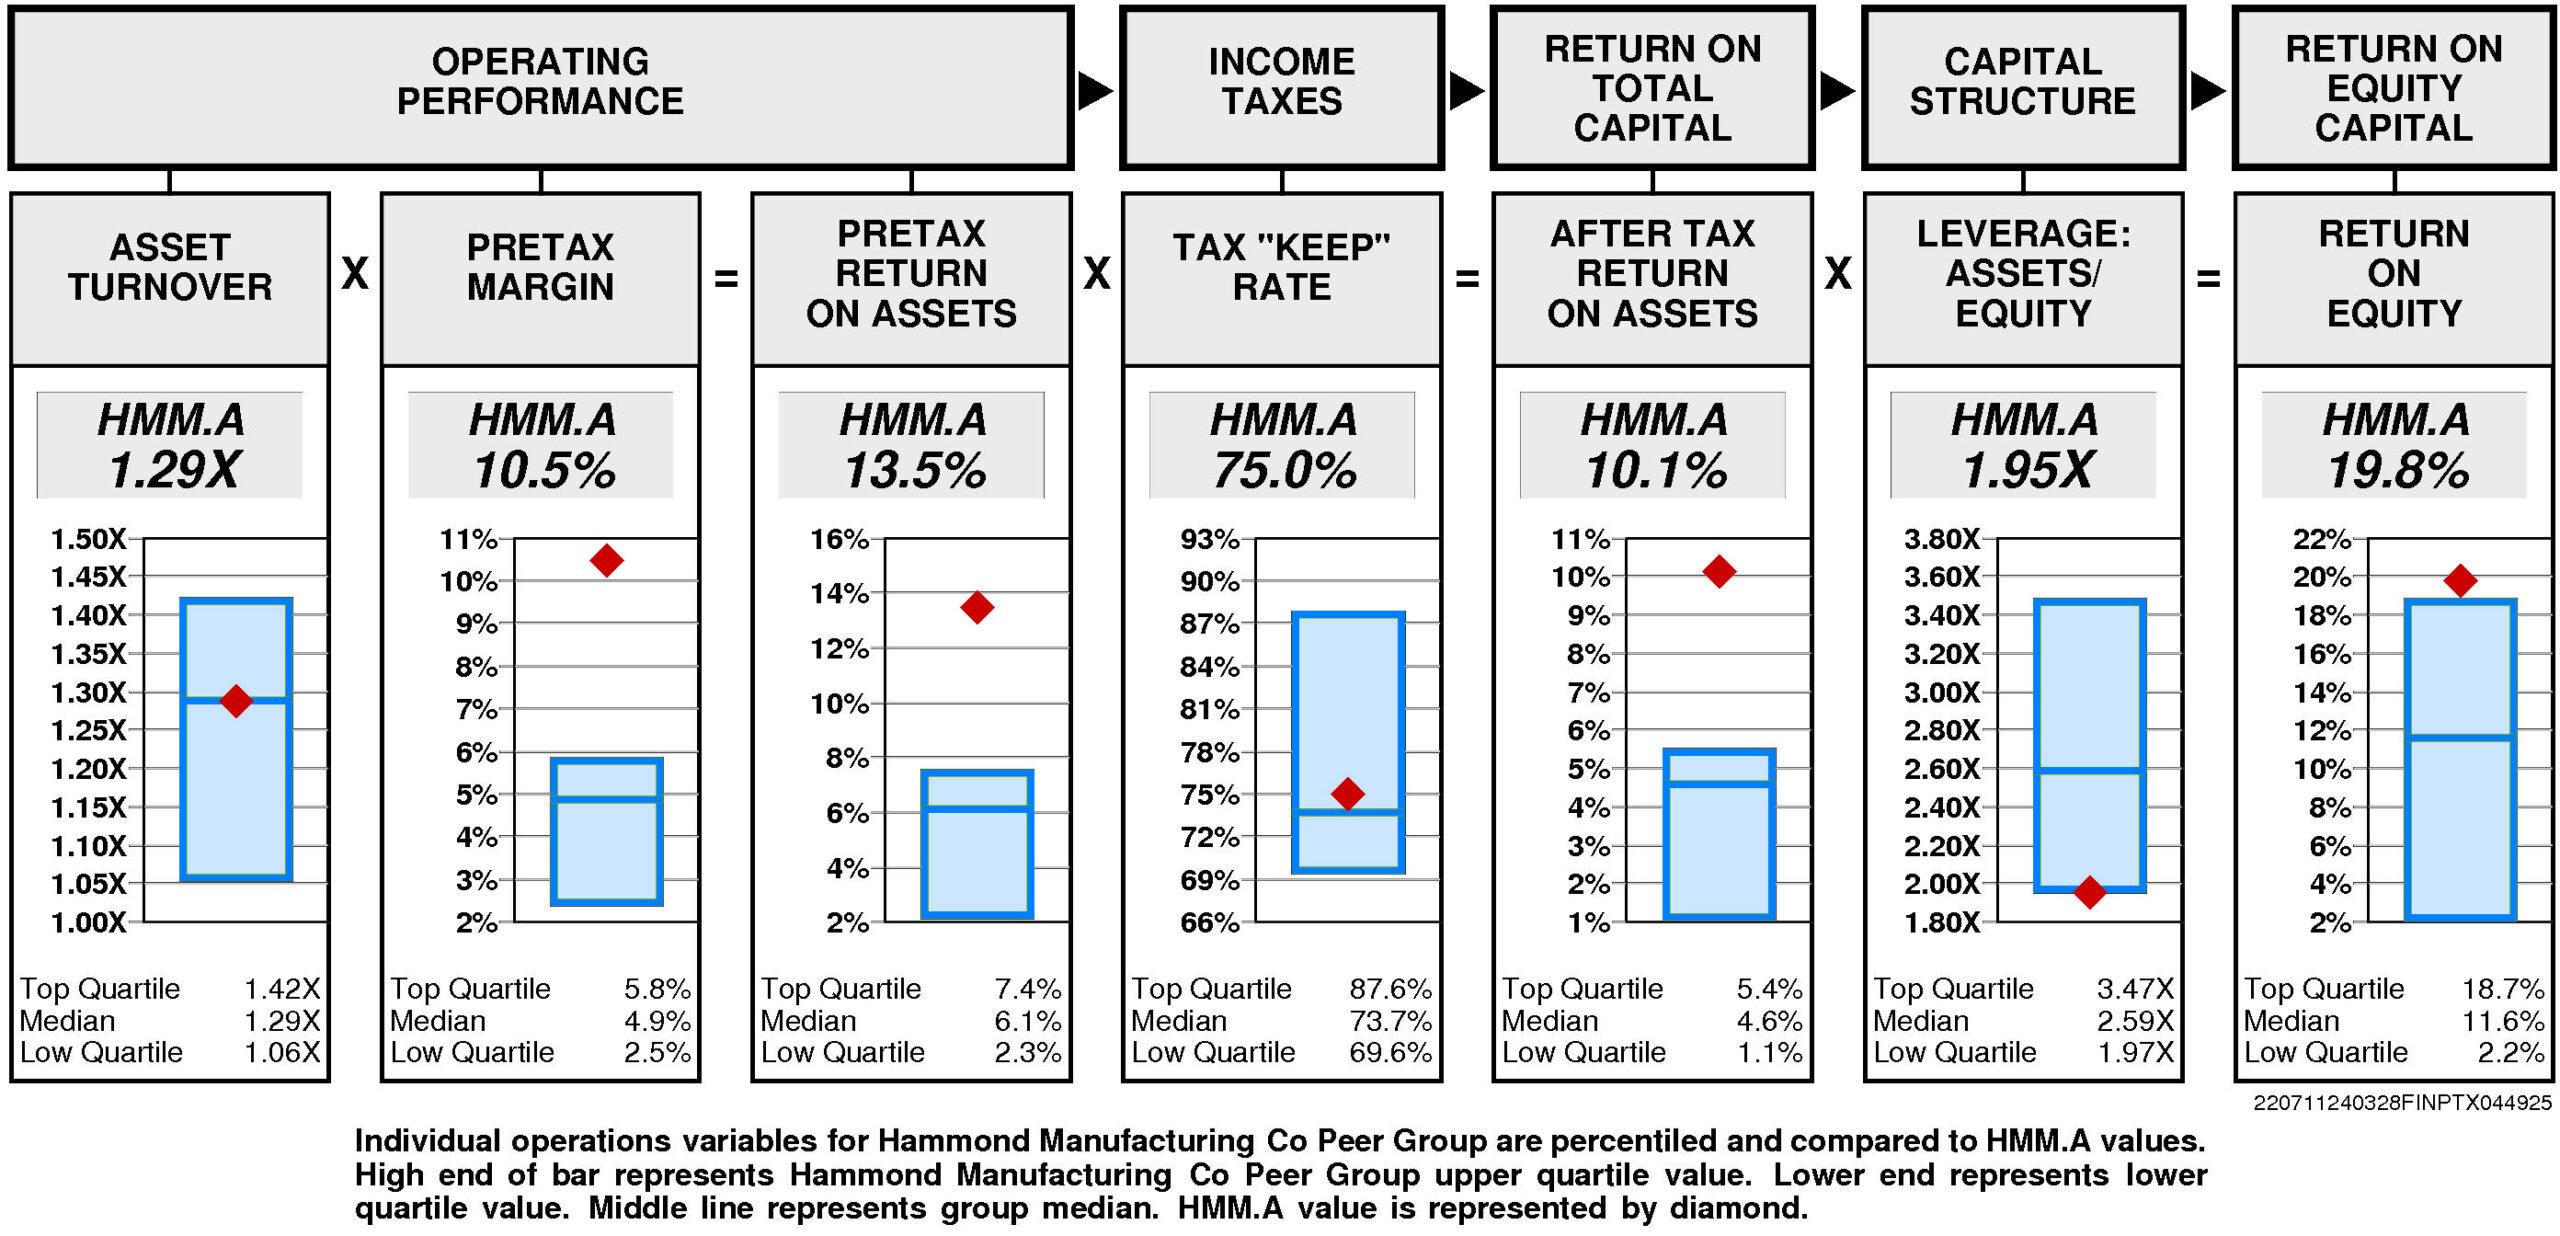
Operating performance (pretax return on assets) is upper quartile (13.5%) reflecting asset turnover that is at median (1.29X) and upper quartile pretax margin (10.5%).
Tax “keep” rate (income tax management) is at median (75.0%) resulting in after tax return on assets that is upper quartile.
Financial leverage (leverage) is at the lower quartile (1.95X).
GROWTH RATES
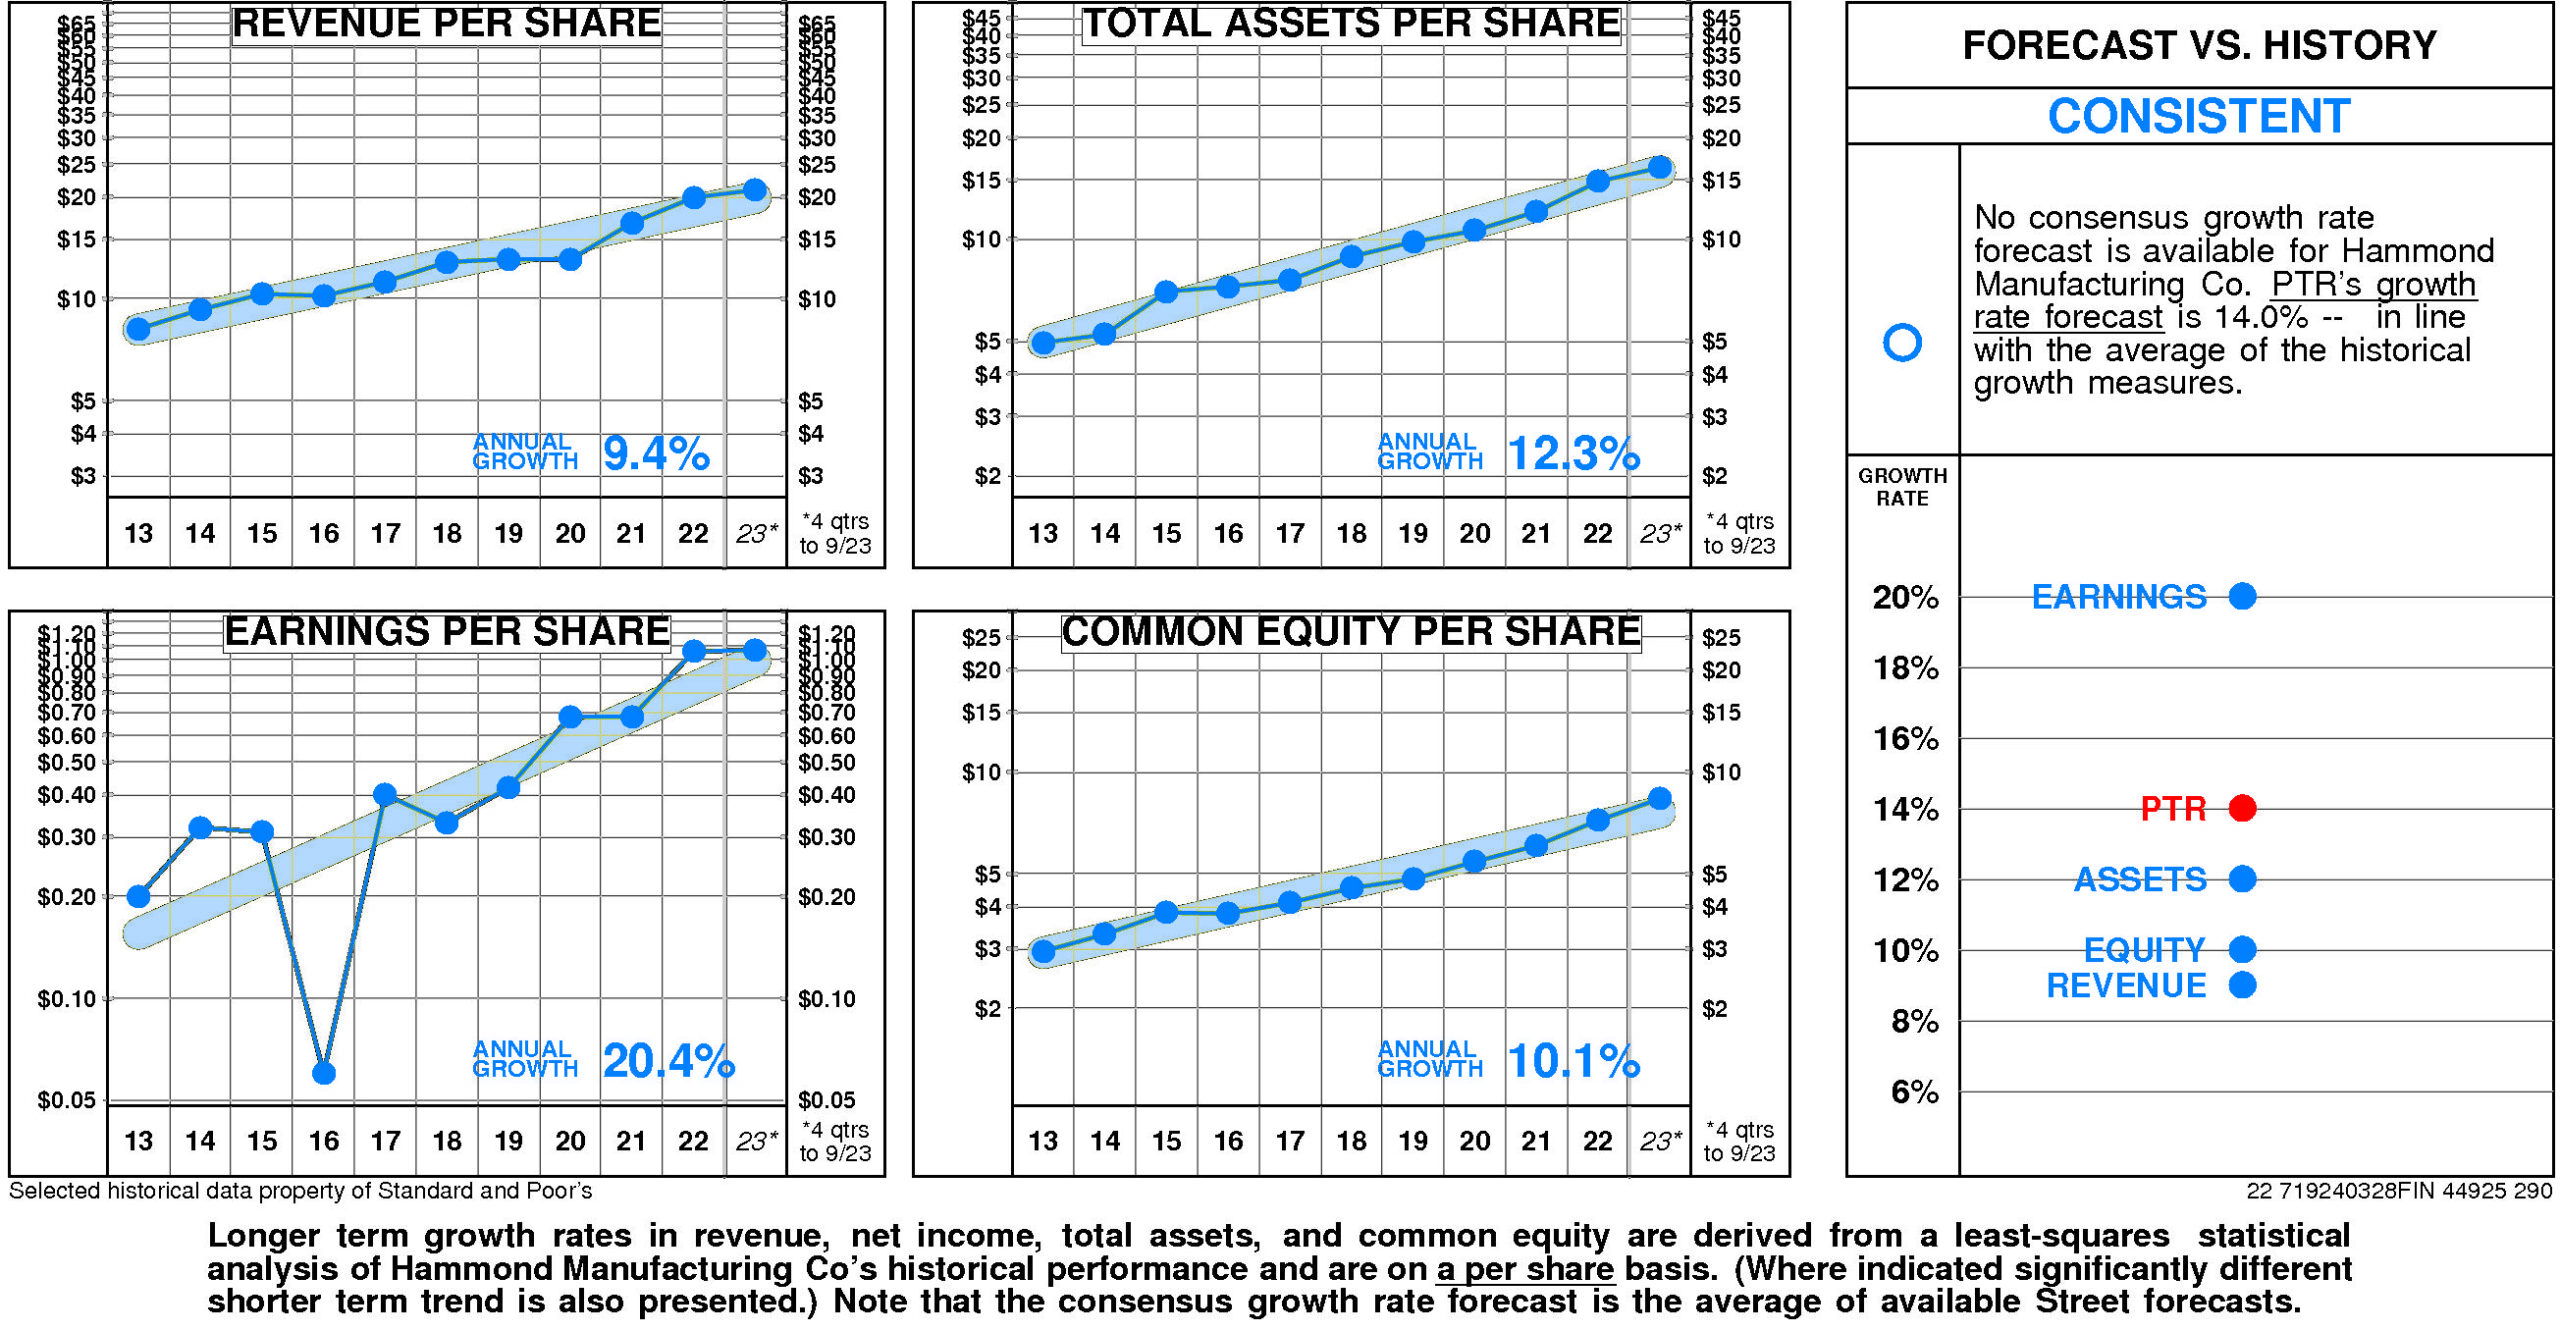
There are no significant differences between Hammond Manufacturing Co’s longer term growth and growth in recent years.
Hammond Manufacturing Co’s historical income statement growth and balance sheet growth have diverged. Revenue growth has paralleled asset growth; earnings growth has exceeded equity growth.
Annual revenue growth has been 9.4% per year.
Total asset growth has been 12.3% per year.
Annual E.P.S. growth has been 20.4% per year.
Equity growth has been 10.1% per year.
No consensus growth rate forecast is available for Hammond Manufacturing Co.
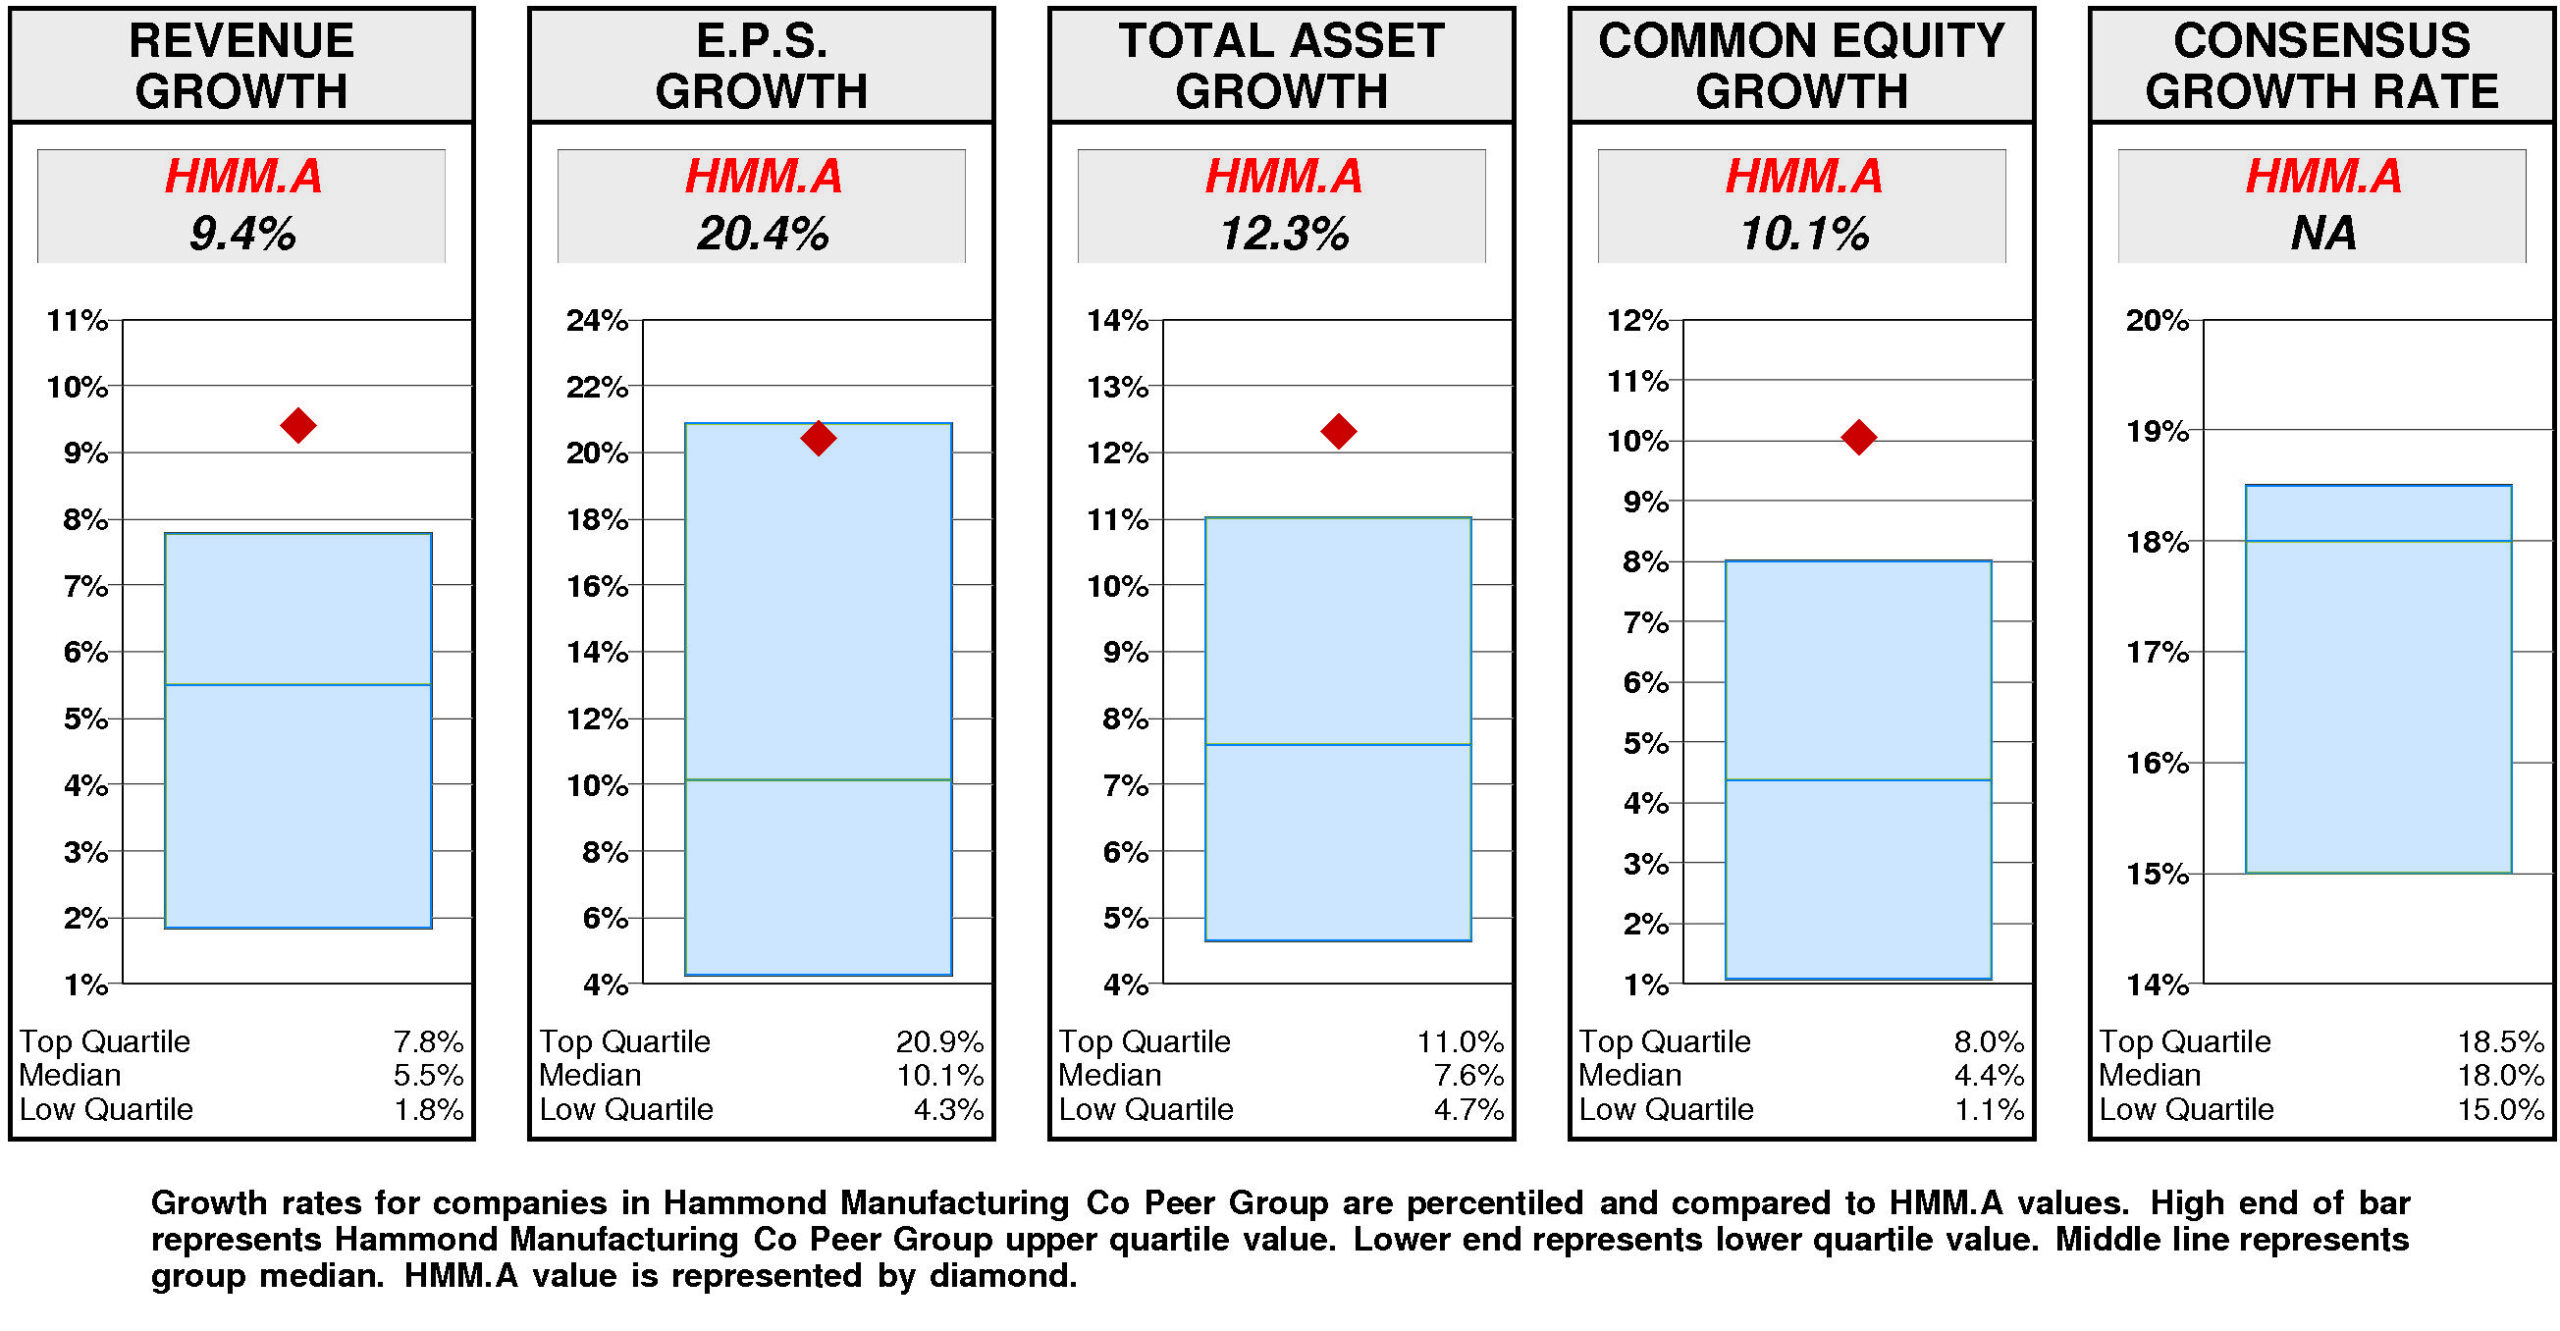
Relative to the Hammond Manufacturing Co Peer Group, Hammond Manufacturing Co’s historical growth measures are generally top quartile. Revenue growth (9.4%) has been upper quartile. Total asset growth (12.3%) has been upper quartile. Equity growth (10.1%) has been upper quartile. E.P.S. growth (20.4%) has been substantially above median.
Consensus growth forecast is unavailable.
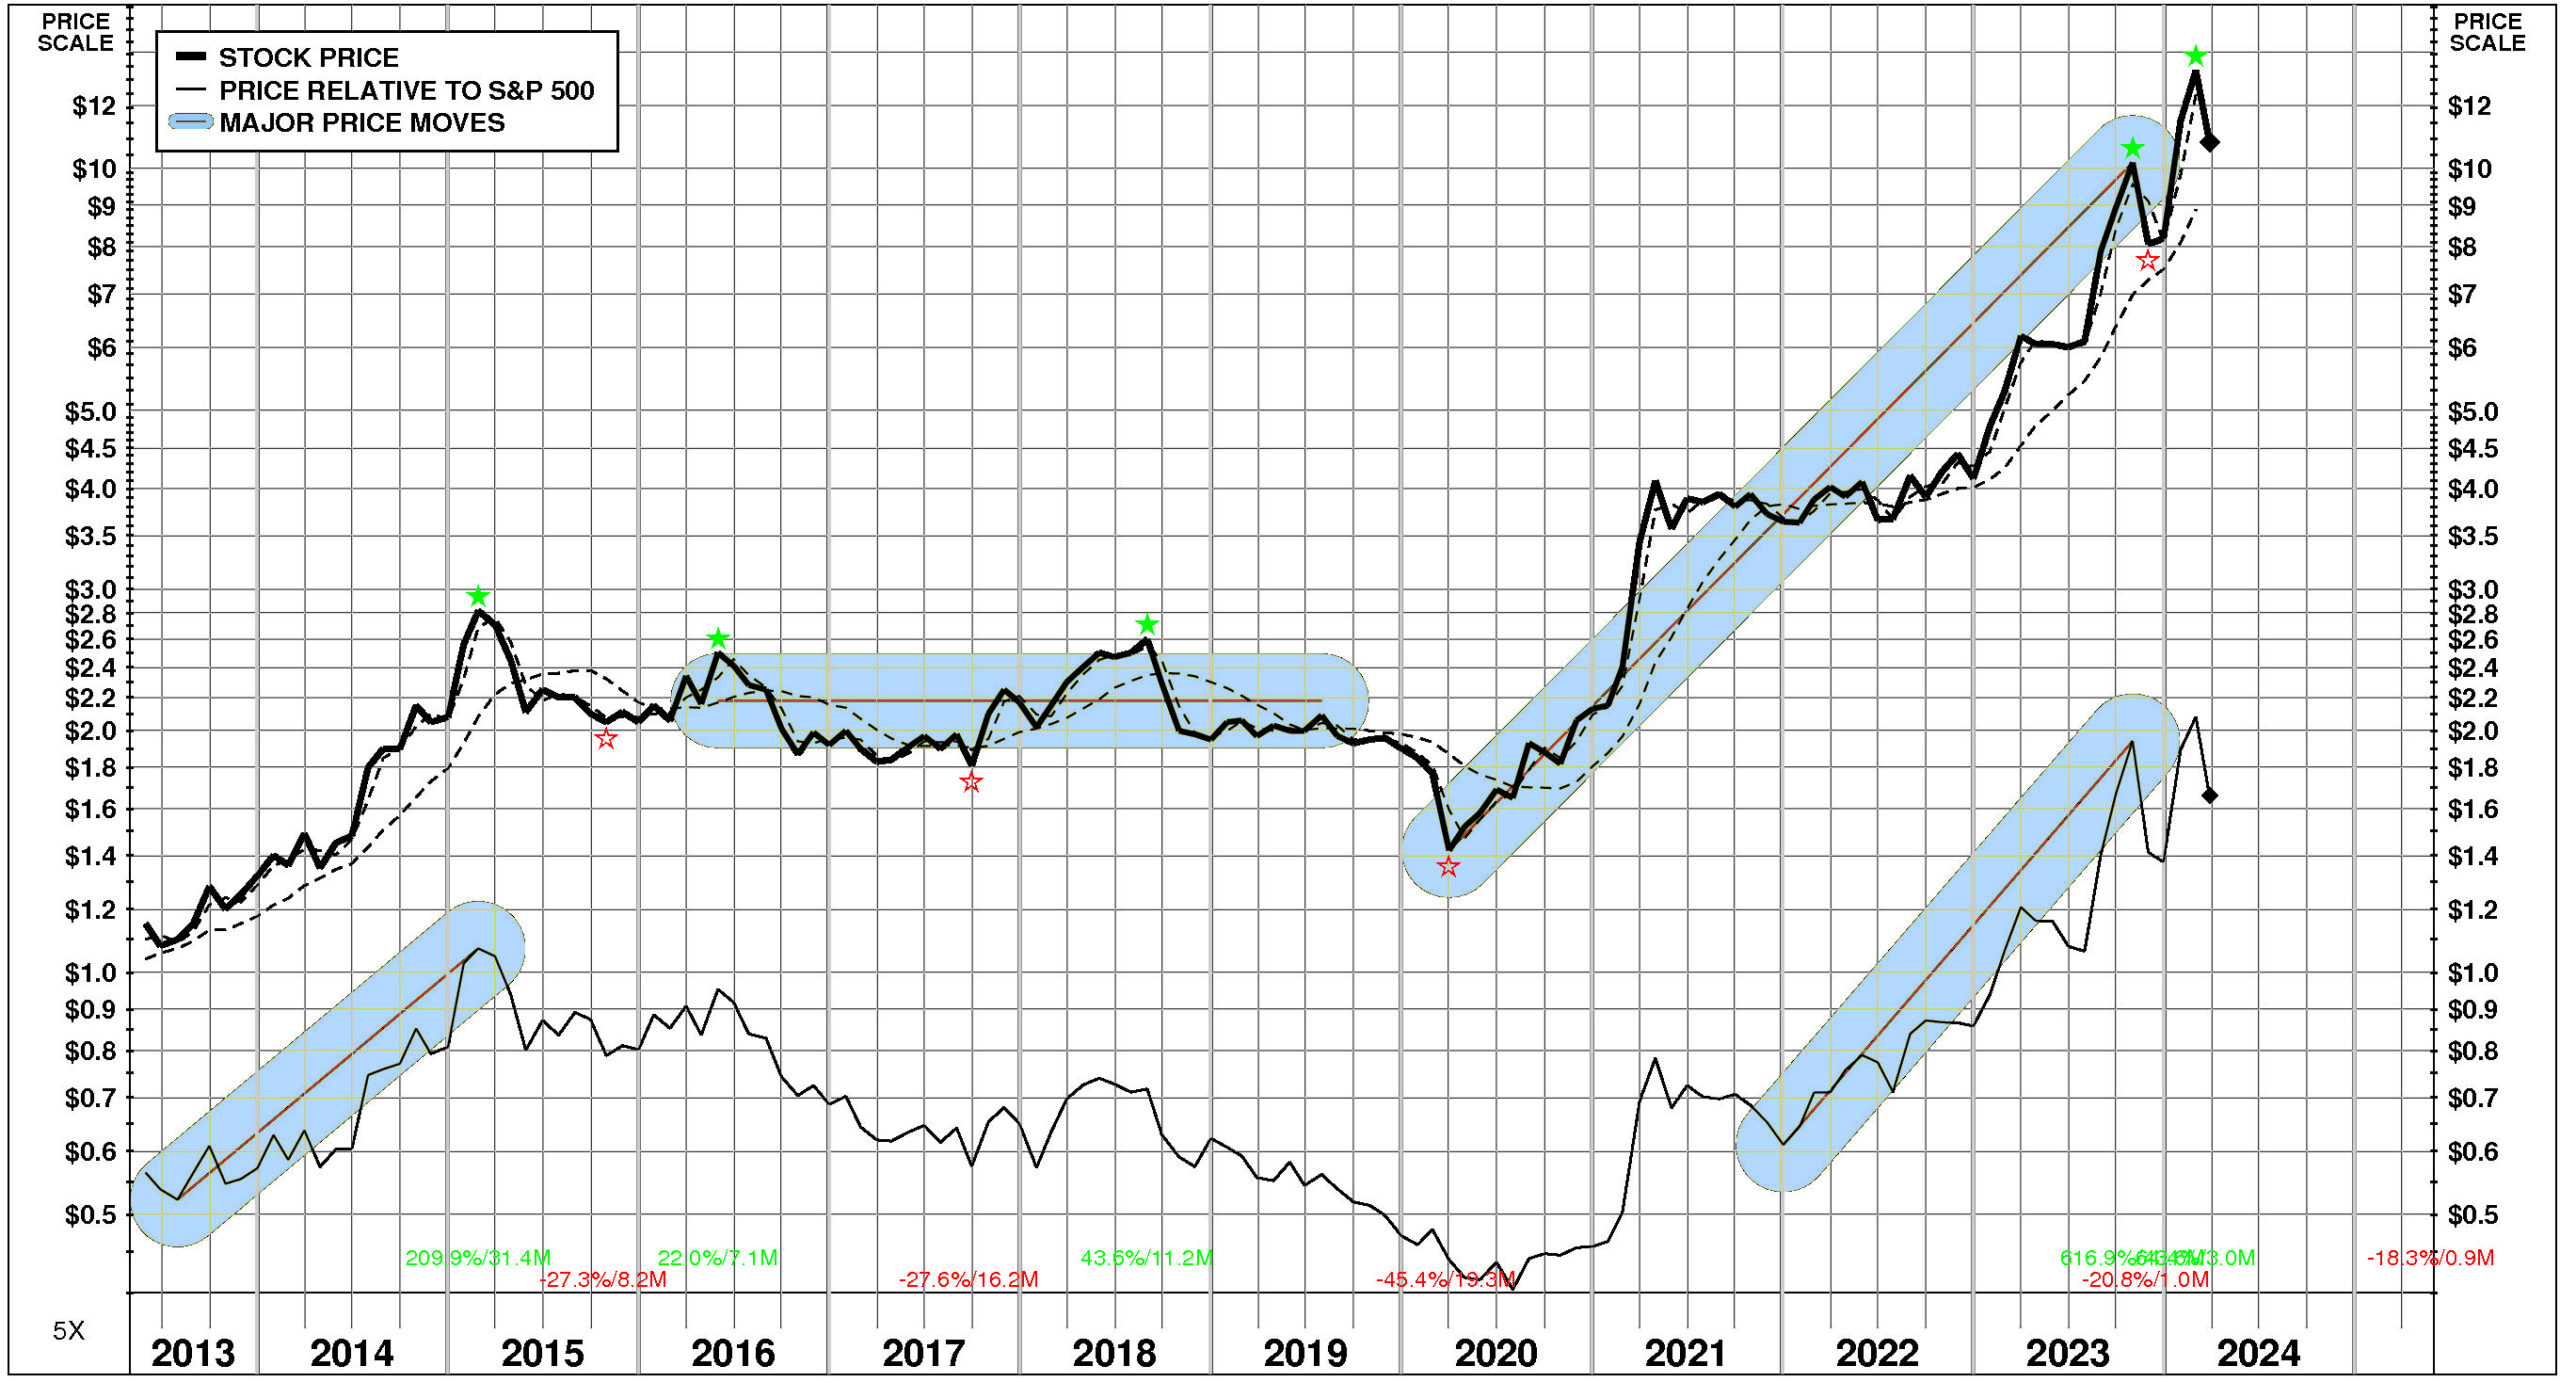
PRICE HISTORY
Over the full time period, Hammond Manufacturing Co’s stock price performance has been variable and exceptional. Between May, 2013 and March, 2024, Hammond Manufacturing Co’s stock price rose +841%; relative to the market, this was a +195% gain. Significant price move during the period: 1) March, 2020 – October, 2023: +617%.
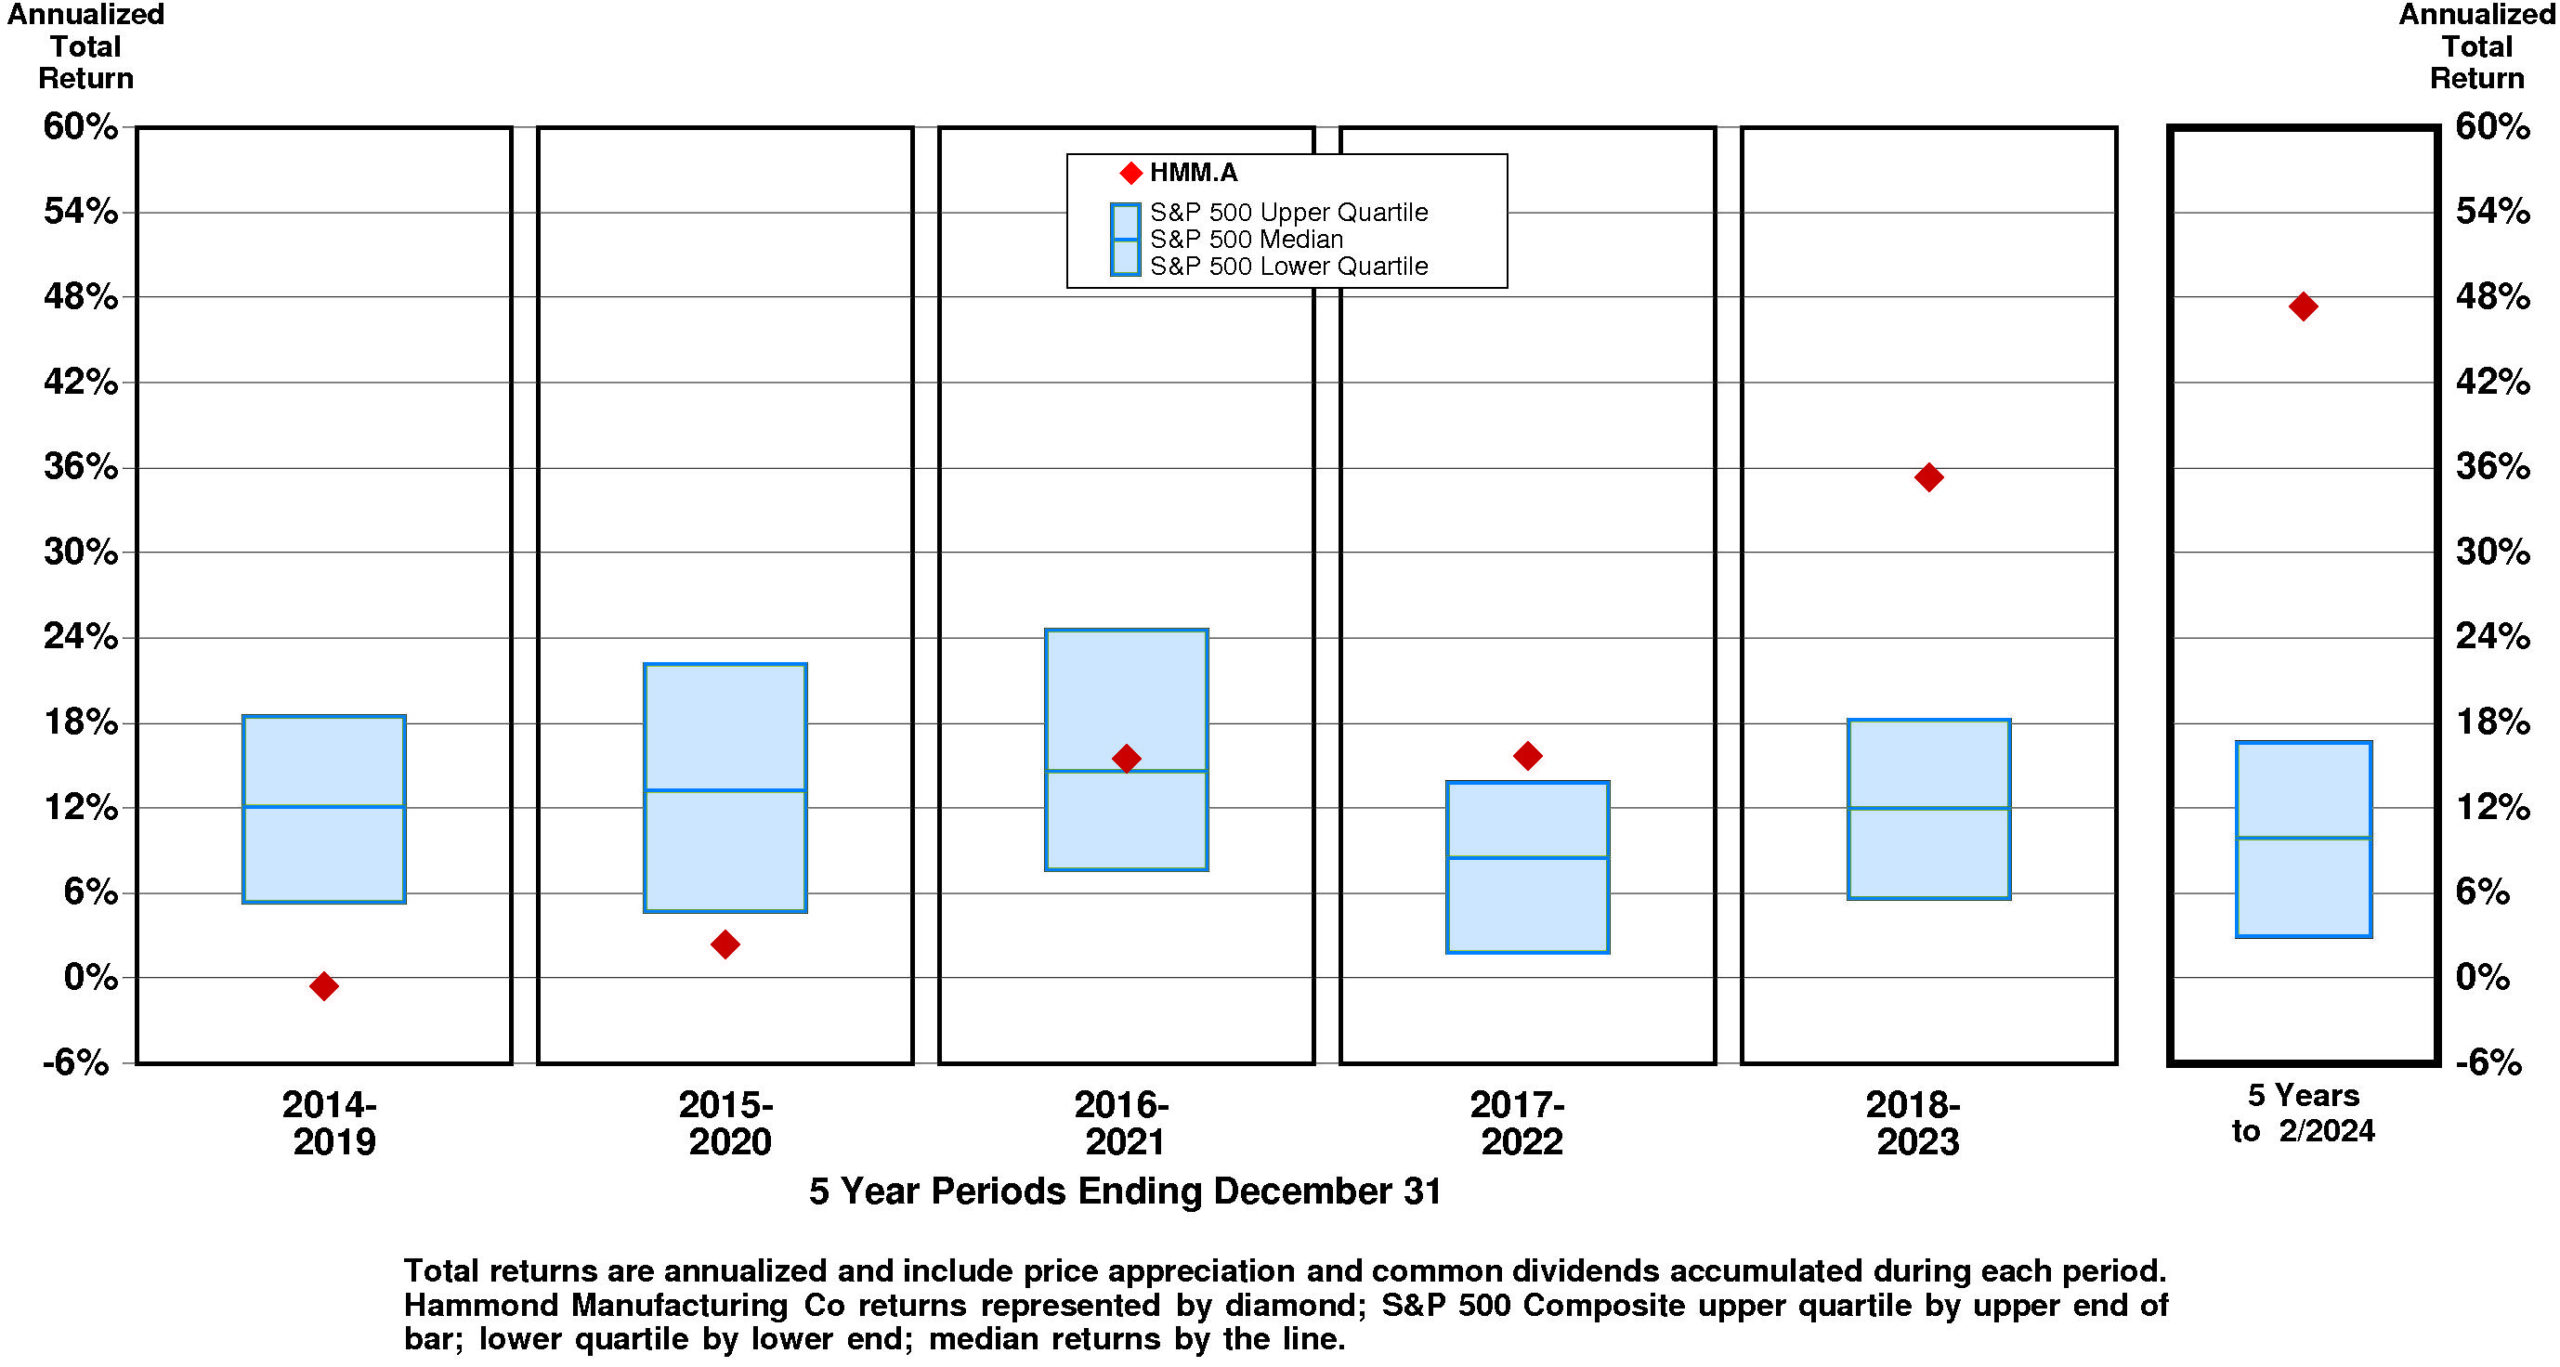
TOTAL INVESTMENT RETURNS
Current annual total return performance of 152.6% is upper quartile relative to the S&P 500 Composite.
In addition to being upper quartile relative to S&P 500 Composite, current annual total return performance through February, 2024 of 152.6% is upper quartile relative to Hammond Manufacturing Co Ltd Peer Group.
Current 5-year total return performance of 47.4% is upper quartile relative to the S&P 500 Composite.
Through February, 2024, with upper quartile current 5-year total return of 47.4% relative to S&P 500 Composite, Hammond Manufacturing Co’s total return performance is upper quartile relative to Hammond Manufacturing Co Ltd Peer Group.
VALUATION BENCHMARKS
Relative to S&P 500 Composite, HMM.A’s overall valuation is exceptionally low. All five factors are lower quartile. The highest factor is the ratio of enterprise value/assets, followed by the price/equity ratio, then by the ratio of enterprise value/earnings before interest and taxes, then by the price/earnings ratio. The lowest factor is the ratio of enterprise value/revenue.
Relative to Hammond Manufacturing Co Peer Group, HMM.A’s overall valuation is quite low. The highest factor, the ratio of enterprise value/assets, is at the lower quartile. Price/equity ratio is lower quartile. Ratio of enterprise value/revenue is at the lower quartile. Ratio of enterprise value/earnings before interest and taxes is lower quartile. The lowest factor, the price/earnings ratio, is lower quartile.
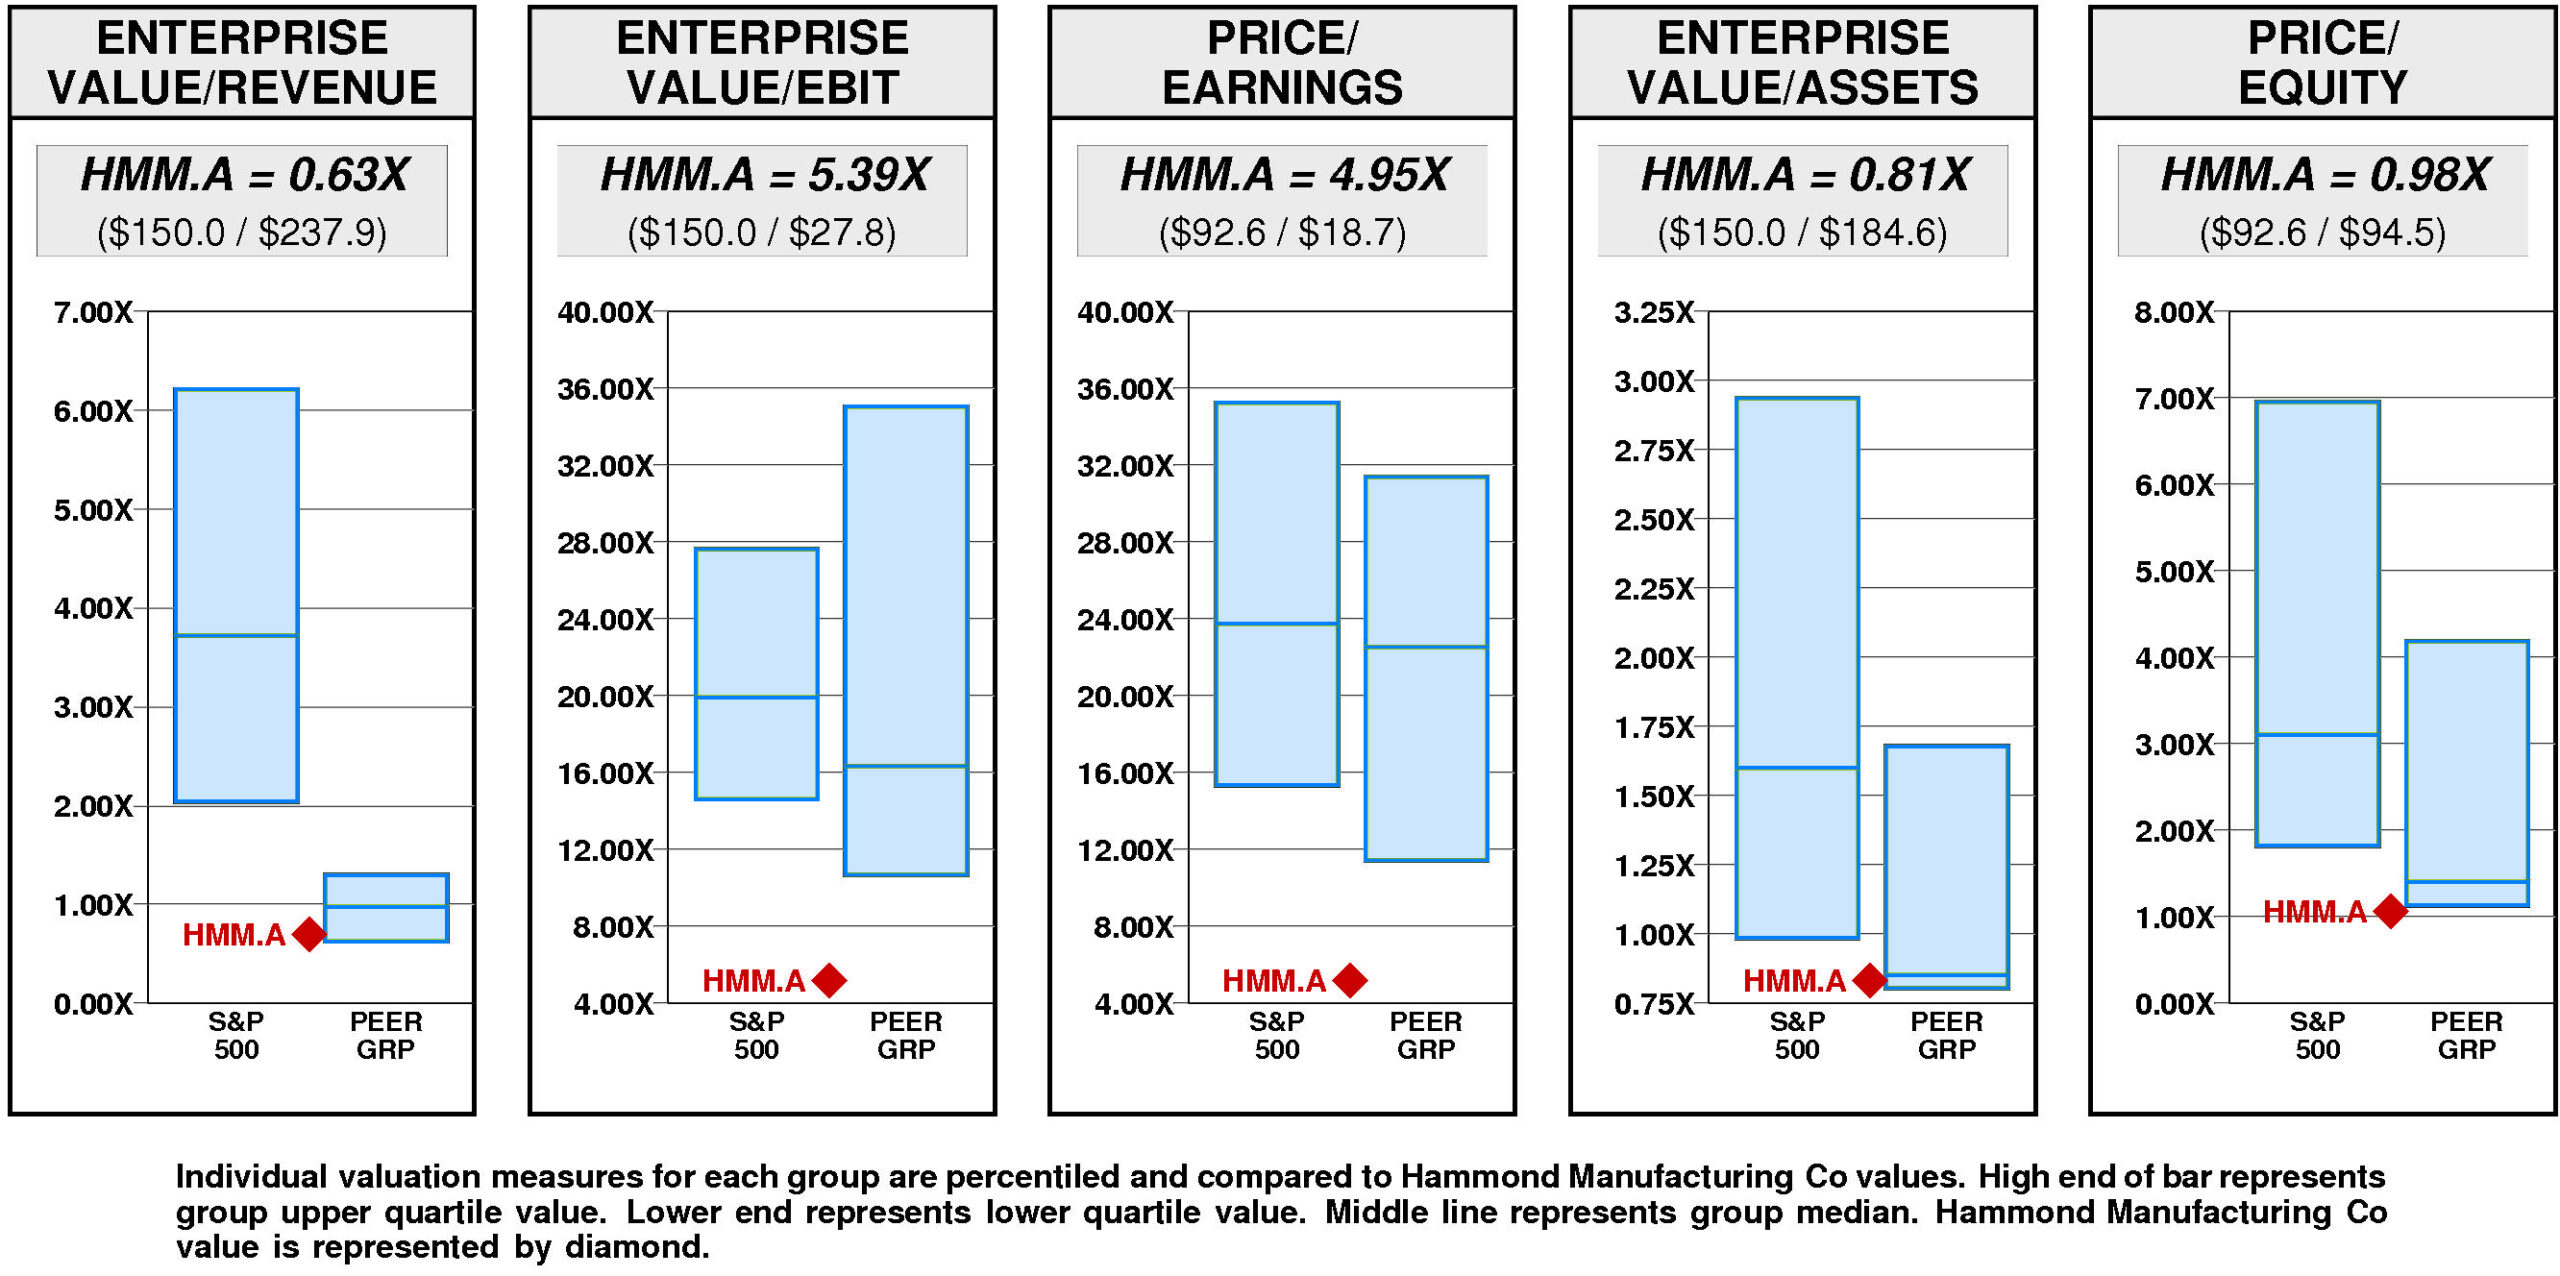
Hammond Manufacturing Co has a major value gap compared to the median valuation. For HMM.A to rise to median valuation, its current ratio of enterprise value/revenue would have to rise from the current level of 0.63X to 0.98X. If HMM.A’s ratio of enterprise value/revenue were to rise to 0.98X, its stock price would be lower by $10 to $20.
For HMM.A to hit lower quartile valuation relative to the Hammond Manufacturing Co Peer Group, its current ratio of enterprise value/revenue would have to fall from the current level of 0.63X to 0.63X. If HMM.A’s ratio of enterprise value/revenue were to fall to 0.63X, its stock price would decline by $-0 from the current level of $11.
VALUE TARGETS
HMM.A’s future returns on capital are forecasted to exceed the cost of capital. Accordingly, the company is expected to continue to be a modest Value Builder.
Hammond Manufacturing Co’s current Price Target of $18 represents a +65% change from the current price of $10.82.
This moderately high appreciation potential results in an appreciation score of 60 (only 40% of the universe has greater appreciation potential.)
Reinforcing this moderately high Appreciation Score of 60, the high Power Rating of 94 contributes to an Value Trend Rating of A.
Hammond Manufacturing Co’s current Price Target is $18 (+38% from the 2022 Target of $13 and +65% from the 03/26/24 price of $10.82). This dramatic rise in the Target is the result of a +23% increase in the equity base and a +12% increase in the price/equity multiple. The forecasted increase in return on equity has a slight positive impact on the price/equity multiple and the forecasted decline in cost of equity has a very slight positive impact as well. The forecasted flat growth has no impact.
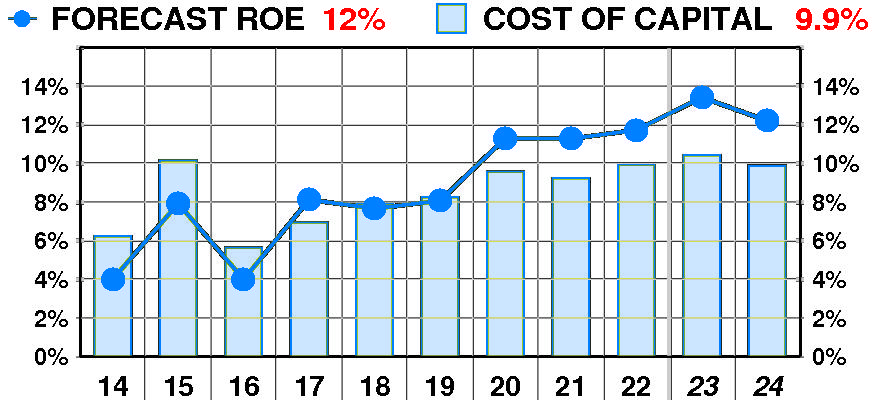
PTR’s return on equity forecast is 12.2% — in line with our recent forecasts. Forecasted return on equity enjoyed a dramatic, variable increase between 2014 and 2022. The current forecast is well above the 2016 low of 4%.
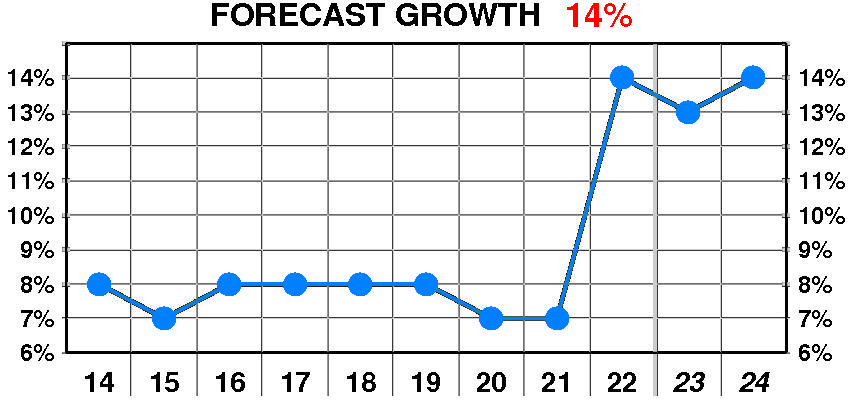
PTR’s growth forecast is 14.0% — in line with our recent forecasts. Forecasted growth enjoyed a dramatic, erratic increase between 2014 and 2022. The current forecast is well above the 2015 low of 7%.
PTR’s cost of equity forecast is 9.9% — in line with recent levels. Forecasted cost of equity suffered a dramatic, erratic increase between 2014 and 2022. The current forecast is above the 2016 low of 5.6%.
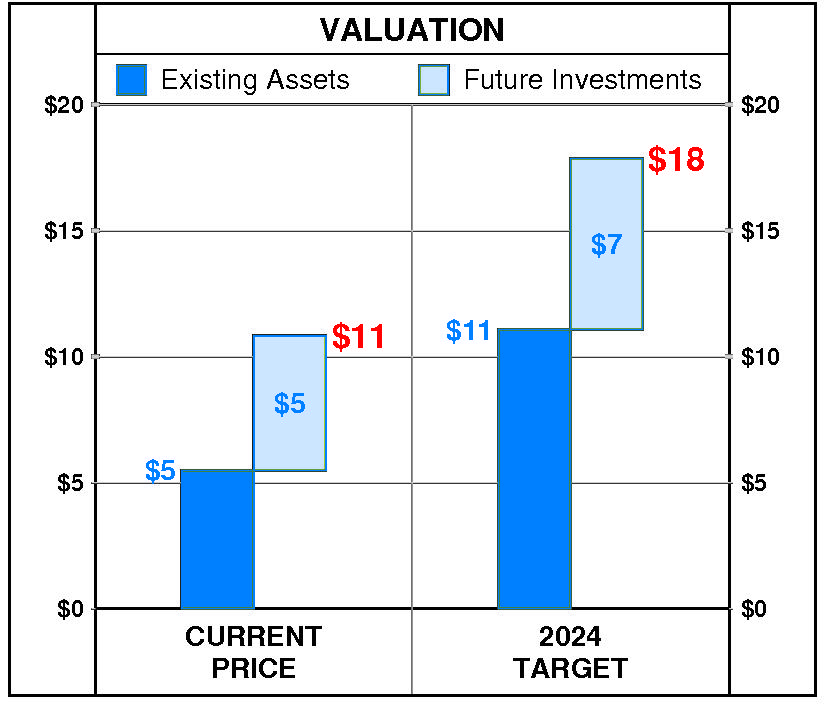
At Hammond Manufacturing Co’s current price of $10.82, investors are placing a positive value of $5 on its future investments. This view is consistent with the company’s most recent performance that reflected a growth rate of 14.0% per year, and a return on equity of 11.7% versus a cost of equity of 9.9%.
PTR’s 2024 Price Target of $18 is based on these forecasts and reflects an estimated value of existing assets of $11 and a value of future investments of $7.
Be the first to comment