![]()
BUSINESS
JOYY Inc., together with its subsidiaries, operates social media platforms that offer users engaging and experience across various video and audio-based social platforms. The company operates Bigo Live, a live streaming platform that allows users to live stream specific moments, such as showcase talents, socialize, and connect with other users worldwide; Likee, a short-form video social platform that focuses on enabling users to create short-form video; Hago, a casual game-oriented social platform; and imo, a chat and instant messaging application with functions, including video calls and other communication tools, such as group calls, document sharing, etc.. It operates in the People’s Republic of China, the United States, the Great Britain, Japan, South Korea, Australia, the Middle East, and Southeast Asia and others.
INVESTMENT RATING

YY’s future returns on capital are forecasted to be in line with the cost of capital. Accordingly, the company is expected to continue to be Value Creation neutral.
JOYY has a current Value Trend Rating of C (High Neutral).
With this rating, PTR’s two proprietary measures of a stock’s current attractiveness are providing very contradictory signals. JOYY has a very high Appreciation Score of 93 but a slightly negative Power Rating of 31, and the High Neutral Value Trend Rating results.
JOYY’s stock is selling well below targeted value. The current stock price of $30.75 compares to targeted value 12 months forward of $136.
JOYY’s very high appreciation potential results in an appreciation score of 93 (only 7% of the universe has greater appreciation potential.)
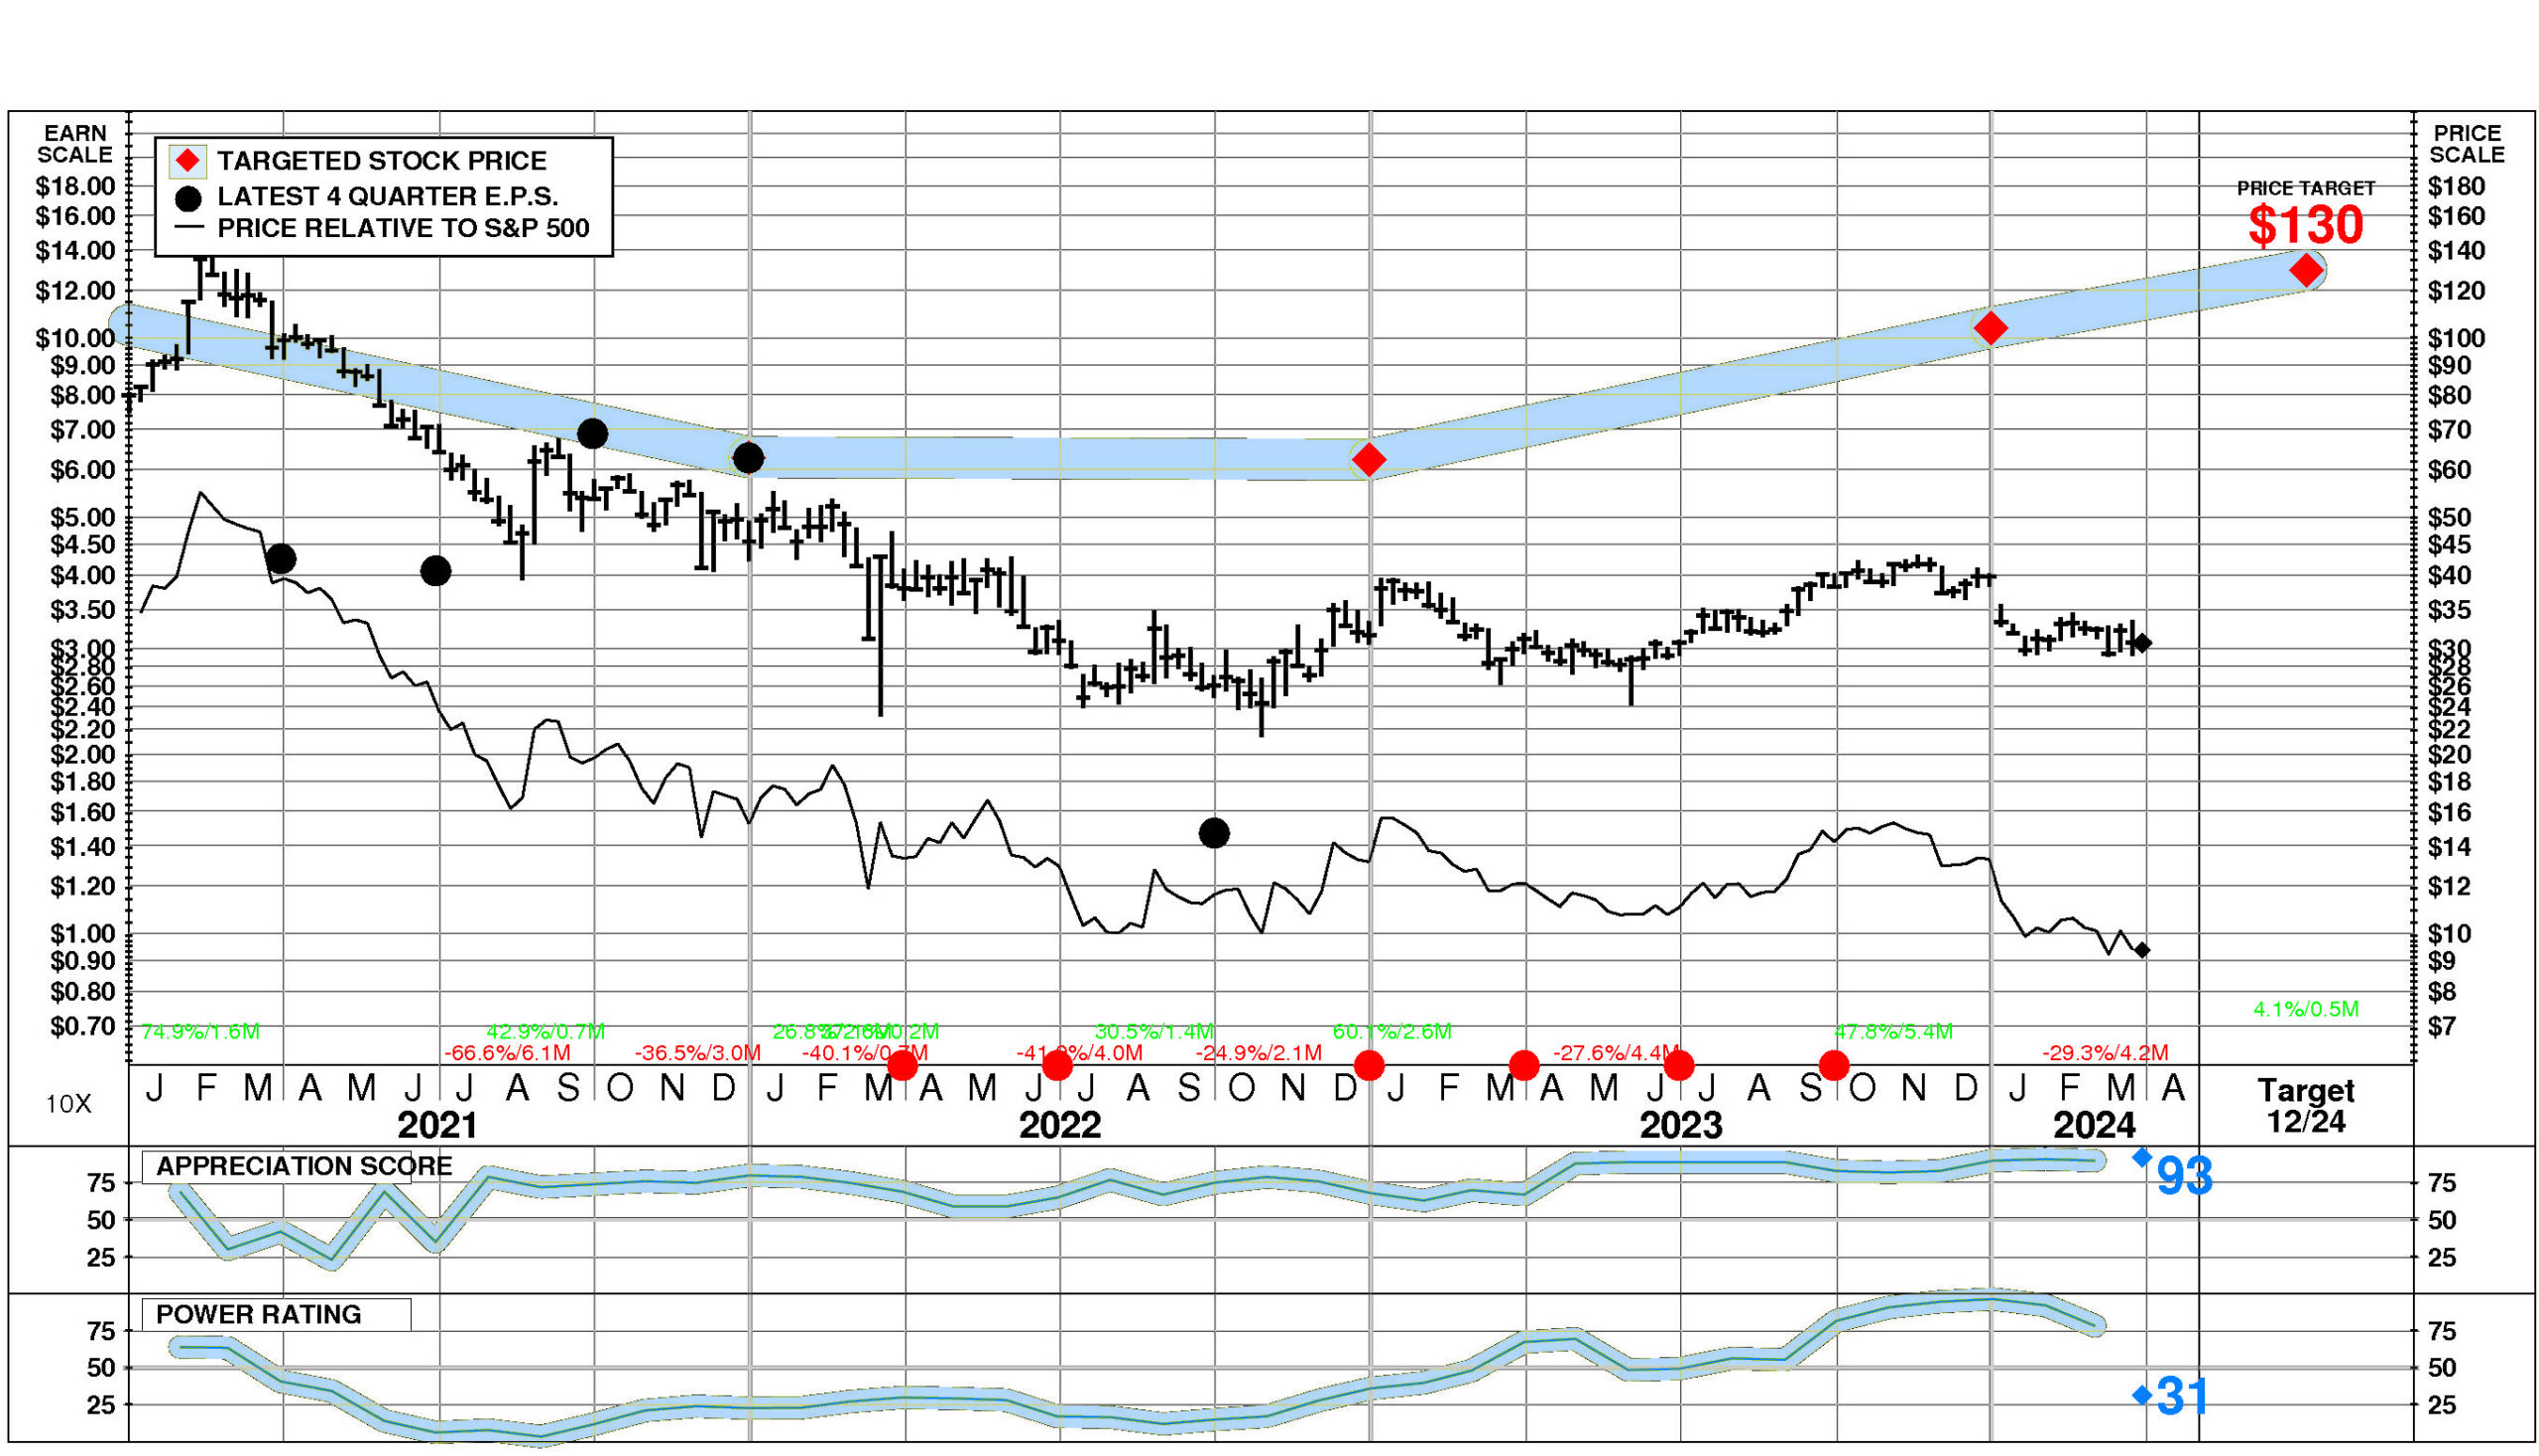
JOYY has a Power Rating of 31. (JOYY’s slightly negative Power Rating indicates that it only has a higher likelihood of achieving favorable investment performance over the near to intermediate term than 31% of companies in the universe.)
Factors contributing to this slightly negative Power Rating include: JOYY’s earnings estimates have fallen very significantly in recent months; recent price action has been neutral; and the Computer Programming, Data Processing comparison group is in a slightly weakened position currently.
INVESTMENT PROFILE
JOYY’s financial strength is high. Financial strength rating is 72.
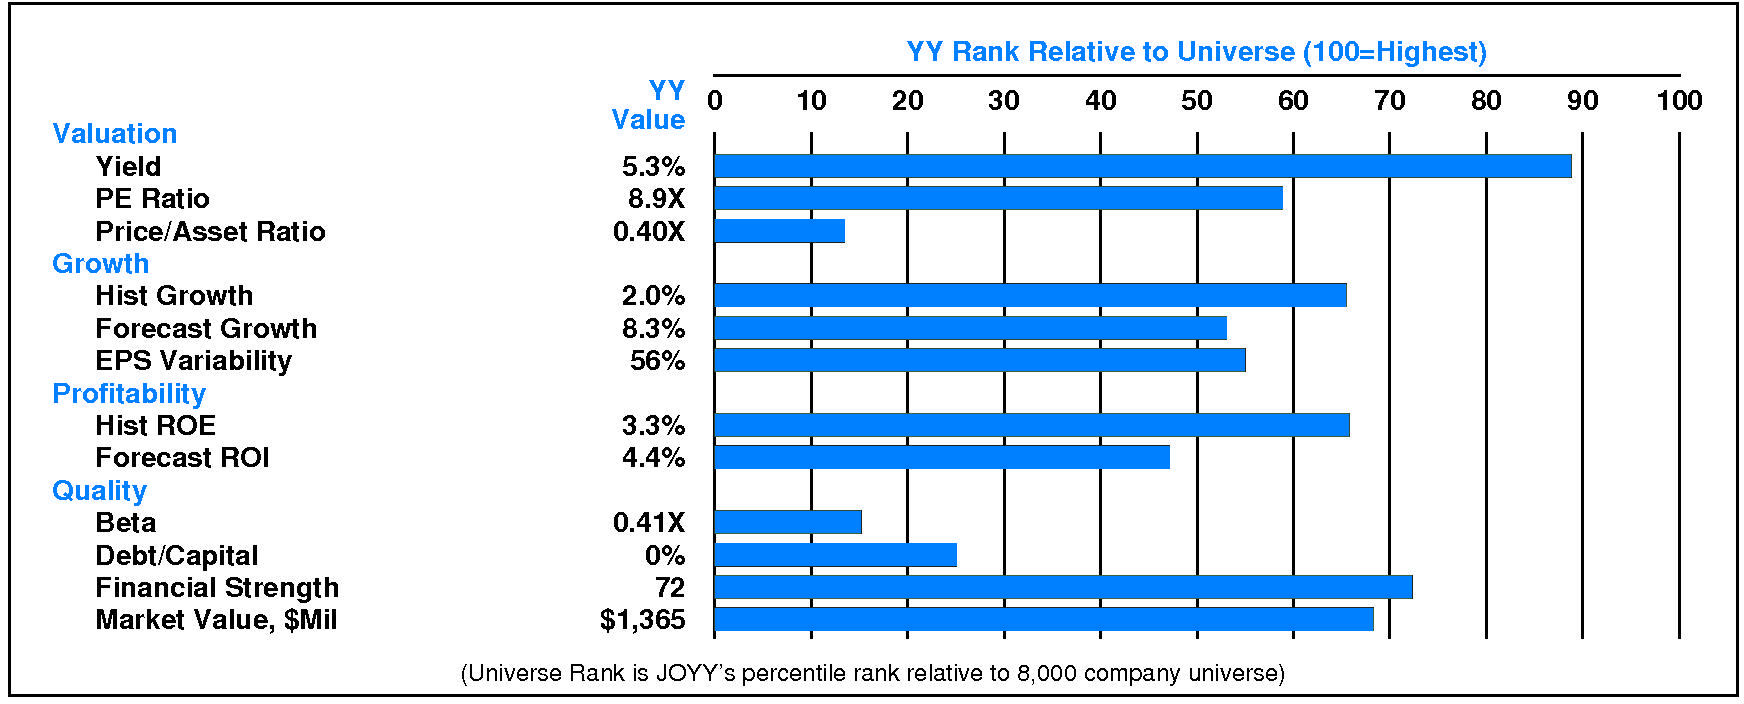
Relative to the S&P 500 Composite, JOYY Inc has significant Value characteristics; its appeal is likely to be to investors heavily oriented toward Income; the perception is that YY is lower risk. Relative weaknesses include: low forecasted profitability, low historical profitability, and low historical growth. JOYY’s valuation is low: high dividend yield, low P/E ratio, and low price/book ratio. YY has unusually low market capitalization.
CURRENT SIGNALS
JOYY’s current operations are eroding. Return on equity is falling, reflecting: falling asset utilization; declining pretax margin; falling tax keep rate; and falling leverage.
JOYY’s current technical position is very weak. The stock price is in a 4.2 month down move. The stock has declined 22.6% from its prior high. The stock price is below its 200 day moving average which is in a downtrend. The 200 day moving average has just turned down.
ALERTS
JOYY Inc (NASDAQ: YY) has recently experienced significant negative changes in investment behavior: its longer term price trend turned down.
Meaningful negative changes in fundamentals have recently occurred for JOYY Inc (NASDAQ: YY): the stock’s power rating fell below 50, and significant quarterly earnings deceleration occurred.
The stock is currently rated C.
On 3/28/24, JOYY Inc (NASDAQ: YY) stock increased 1.7%, closing at $30.75. This advance was accompanied by normal trading volume. The stock has performed in line with the market over the last nine months and has declined -3.6% during the last week.
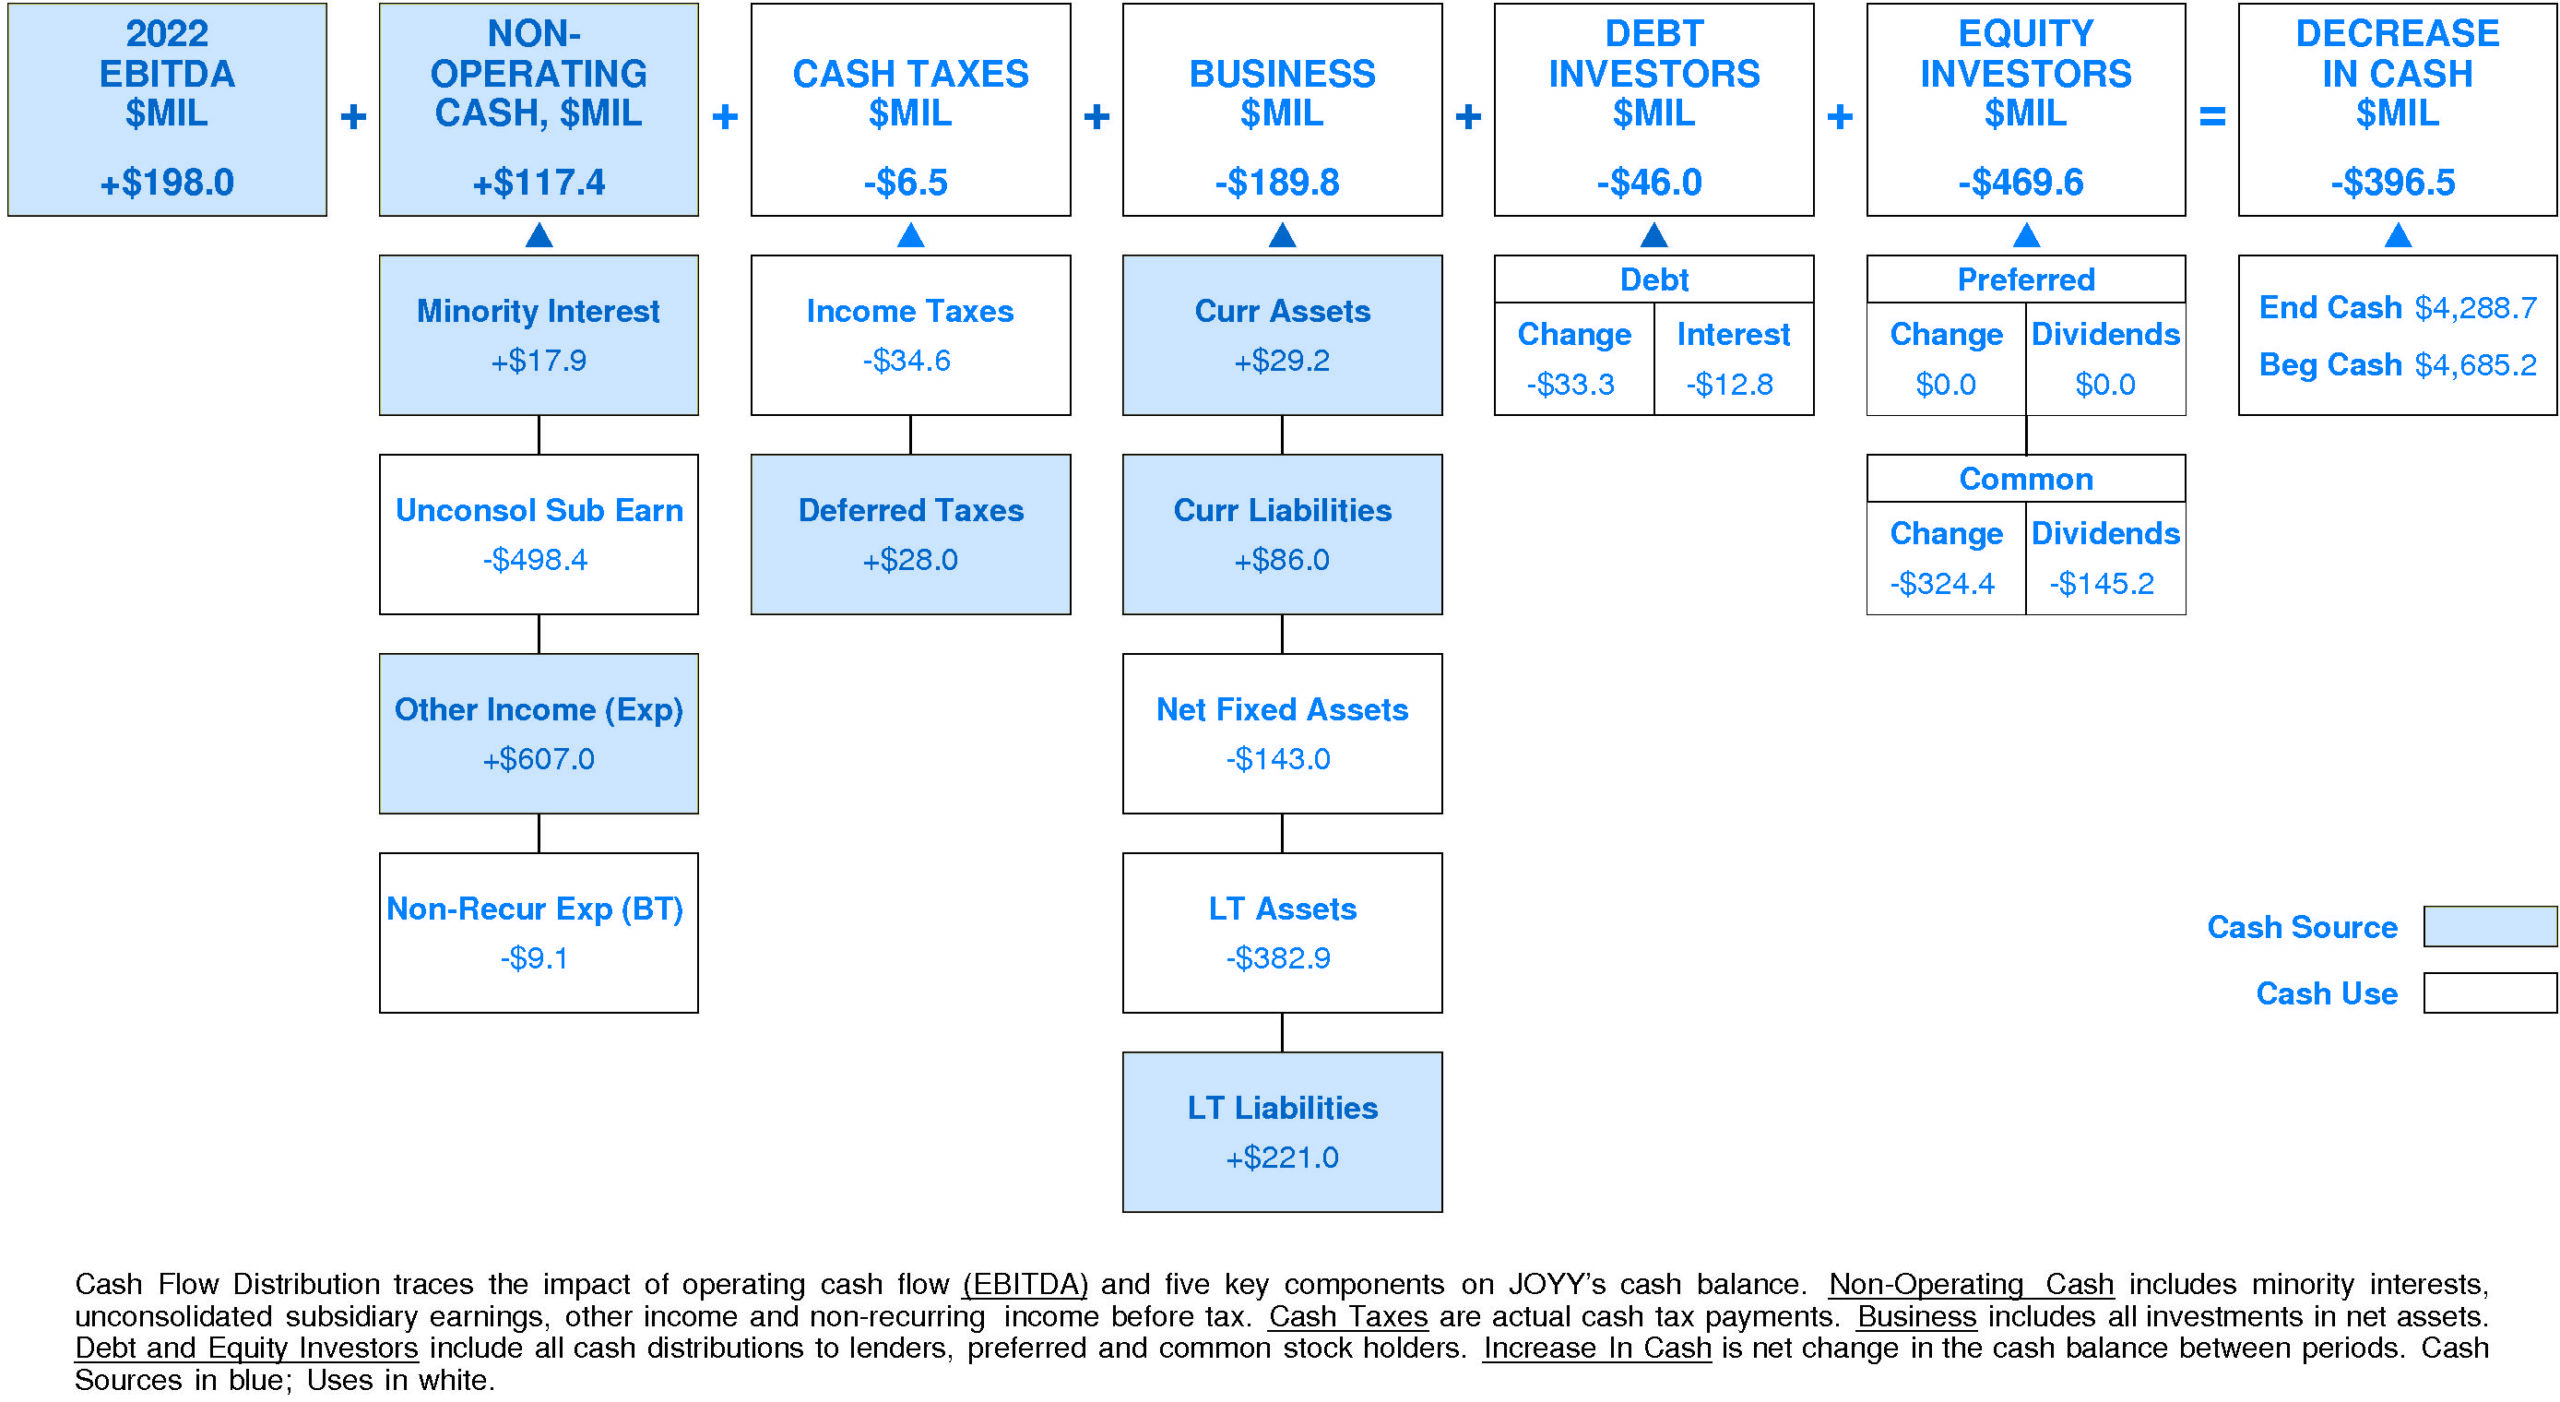
CASH FLOW
In 2022, JOYY experienced a slight decrease in cash of -$396.5 million (-8%). Sources of cash were slightly lower than uses. Cash generated from 2022 EBITDA totaled +$198.0 million. Non-operating sources contributed +$117.4 million (+59% of EBITDA). Cash taxes consumed -$6.5 million (-3% of EBITDA). Re-investment in the business amounted to -$189.8 million (-96% of EBITDA). On a net basis, debt investors pulled out -$46.0 million (-23% of EBITDA) while equity investors removed -$469.6 million (-237% of EBITDA).
JOYY’s Non-operating Income, %EBITDA has exhibited a volatile overall uptrend over the period. This improvement was accompanied by stability for the Joyy Peer Group. In most years, JOYY was in the top quartile. Currently, JOYY is upper quartile at +59% of EBITDA (+$117.4 million).
JOYY’s Cash Taxes, %EBITDA has experienced a downtrend over the period. This downtrend was accompanied by an opposite trend for the Joyy Peer Group. In most years, JOYY was in the top quartile and lower quartile. Currently, JOYY is upper quartile at -3% of EBITDA (-$6.5 million).
JOYY’s Business Re-investment, %EBITDA has enjoyed a volatile overall uptrend over the period. This improvement was accompanied by a similar trend for the Joyy Peer Group. In most years, JOYY was in the top quartile and lower quartile. Currently, JOYY is lower quartile at -96% of EBITDA (-$189.8 million).
JOYY’s Debt Investors, %EBITDA has experienced a volatile overall downtrend over the period. This downtrend was accompanied by stability for the Joyy Peer Group. In most years, JOYY was in the top quartile and third quartile. Currently, JOYY is substantially below median at -23% of EBITDA (-$46.0 million).
JOYY’s Equity Investors, %EBITDA has suffered a volatile overall downtrend over the period. This downtrend was accompanied by a similar trend for the Joyy Peer Group. In most years, JOYY was in the top quartile and lower quartile. Currently, JOYY is lower quartile at -237% of EBITDA (-$469.6 million).
JOYY’s Change in Cash, %EBITDA has experienced a volatile overall uptrend over the period. This improvement was accompanied by an opposite trend for the Joyy Peer Group. In most years, JOYY was in the top quartile. Currently, JOYY is lower quartile at -200% of EBITDA (-$396.5 million).
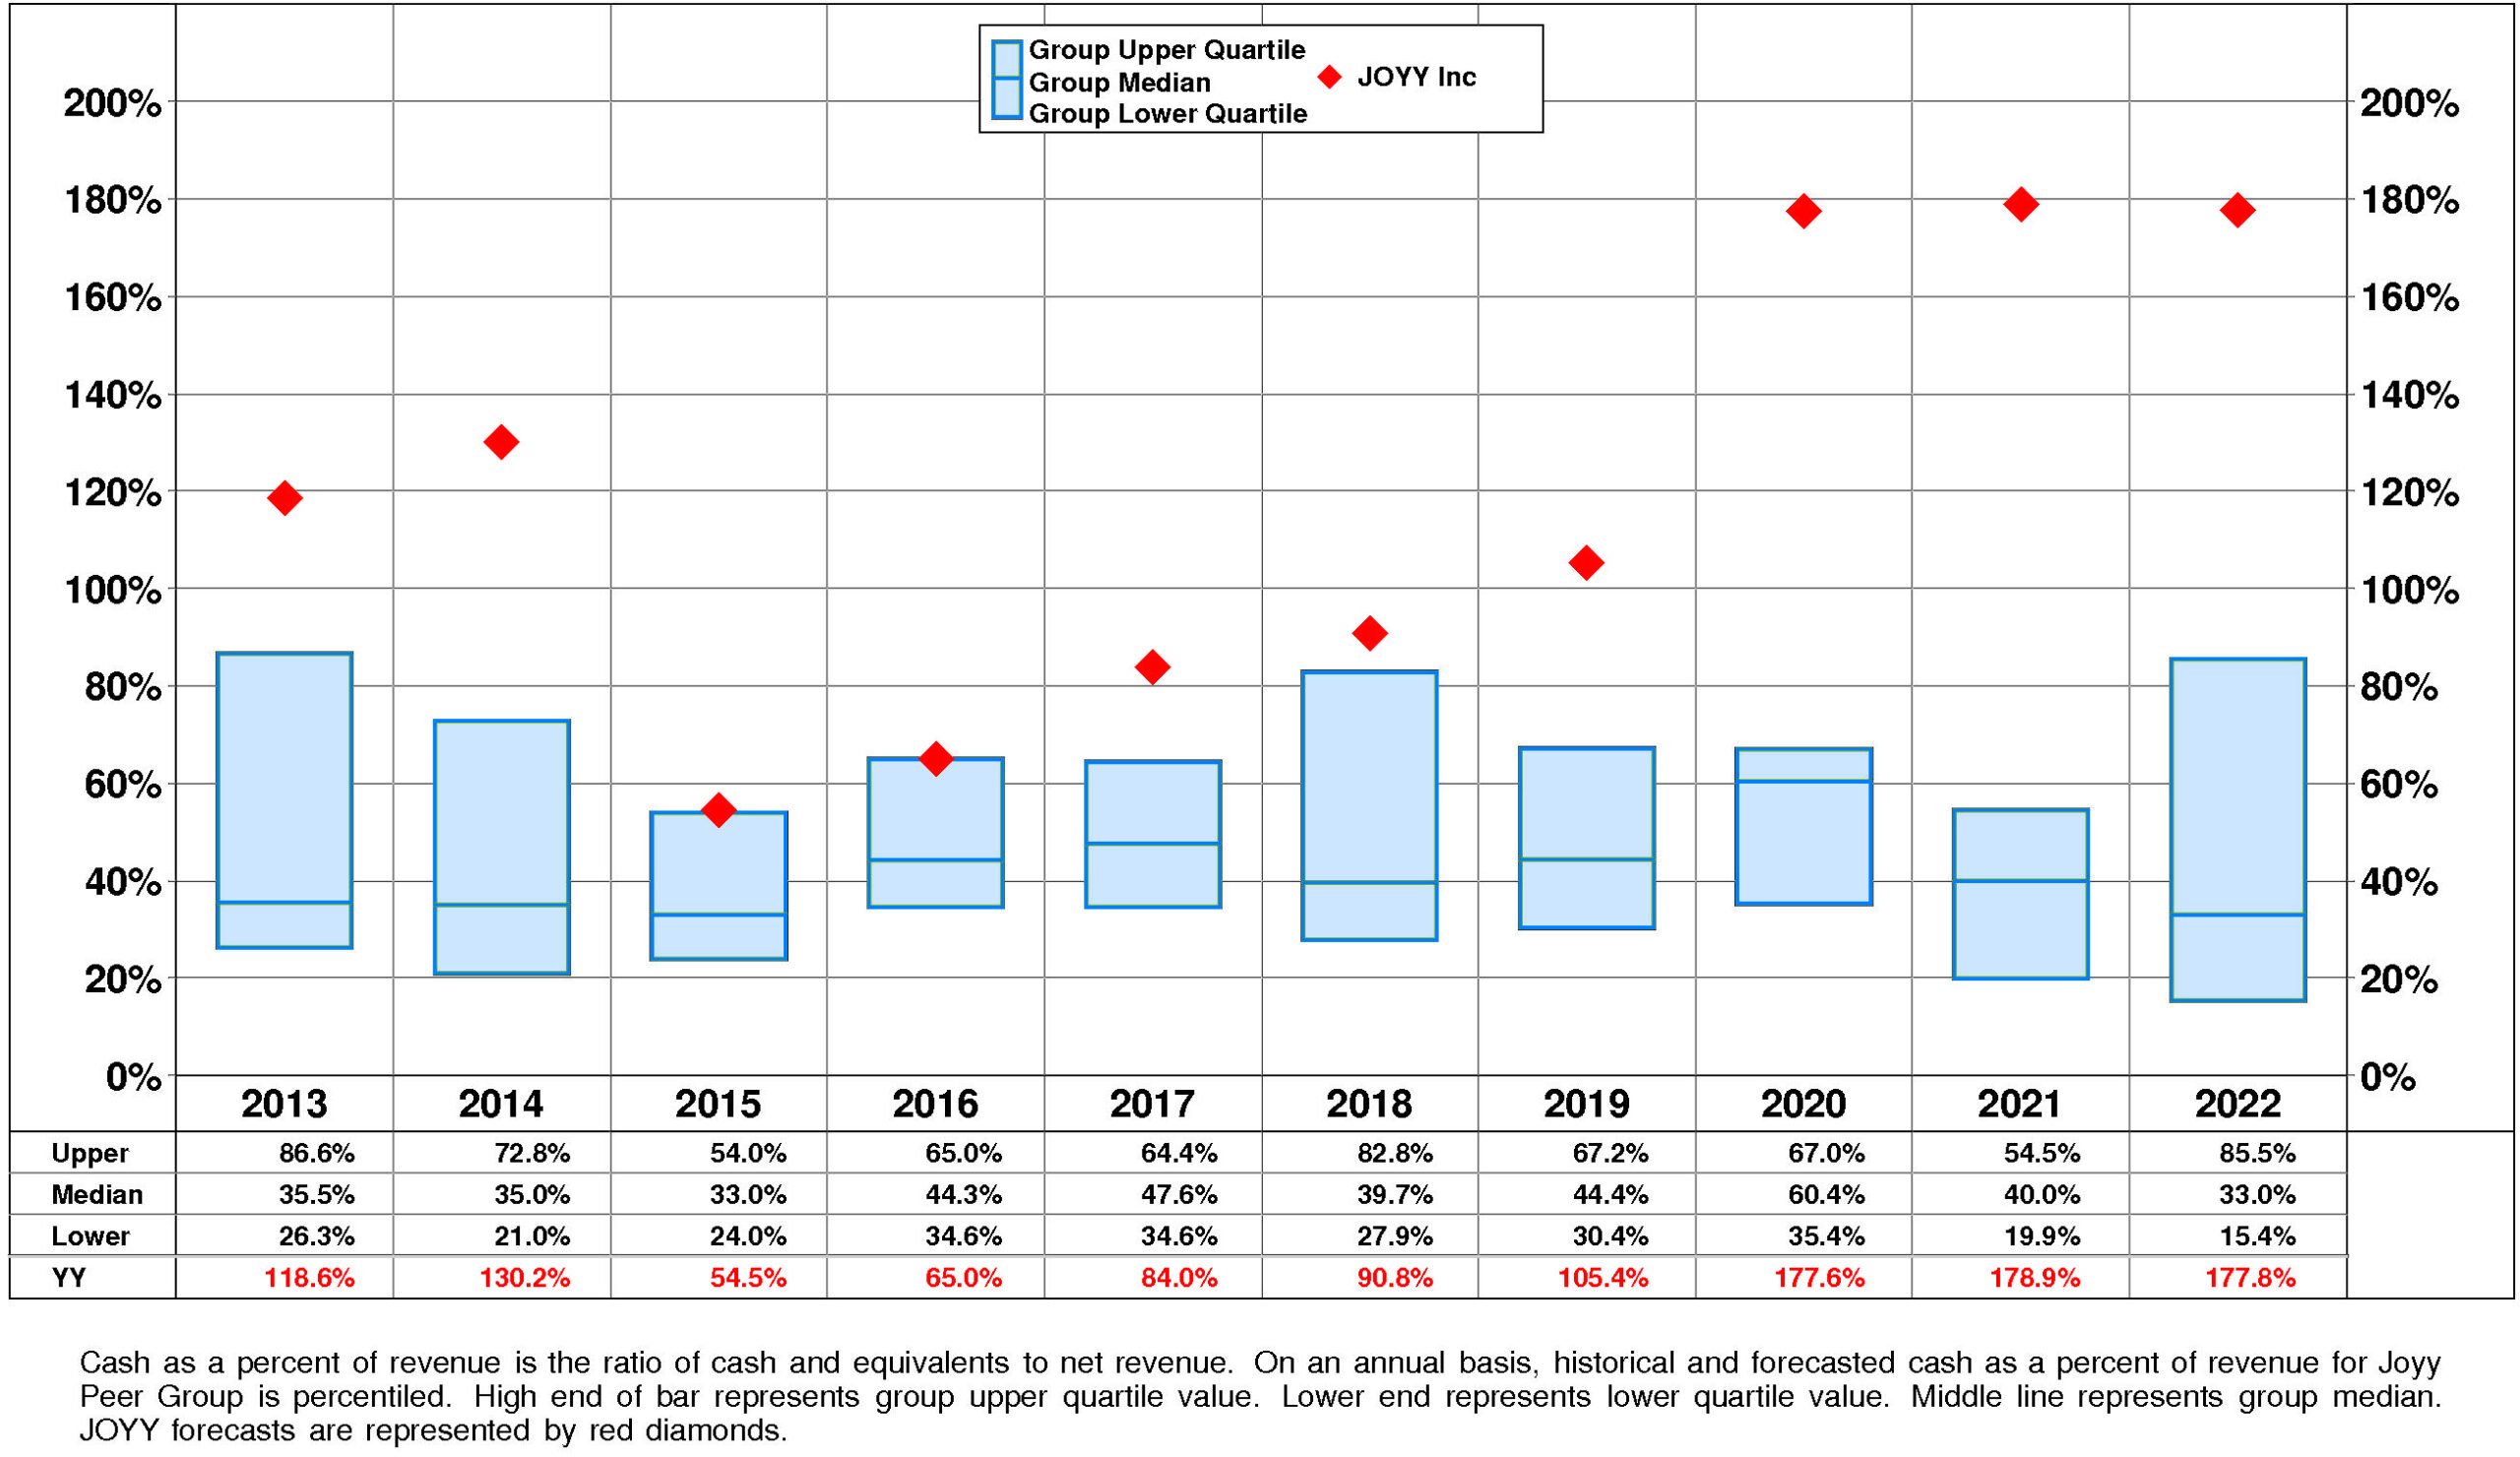
JOYY’s Cash, %Revenue has enjoyed a very strong overall uptrend over the period. This improvement was accompanied by a similar trend for the Joyy Peer Group. (Since 2015 Cash, %Revenue has sharply accelerated.) In most years, JOYY was in the top quartile. Currently, JOYY is upper quartile at +178%.
PROFITABILITY
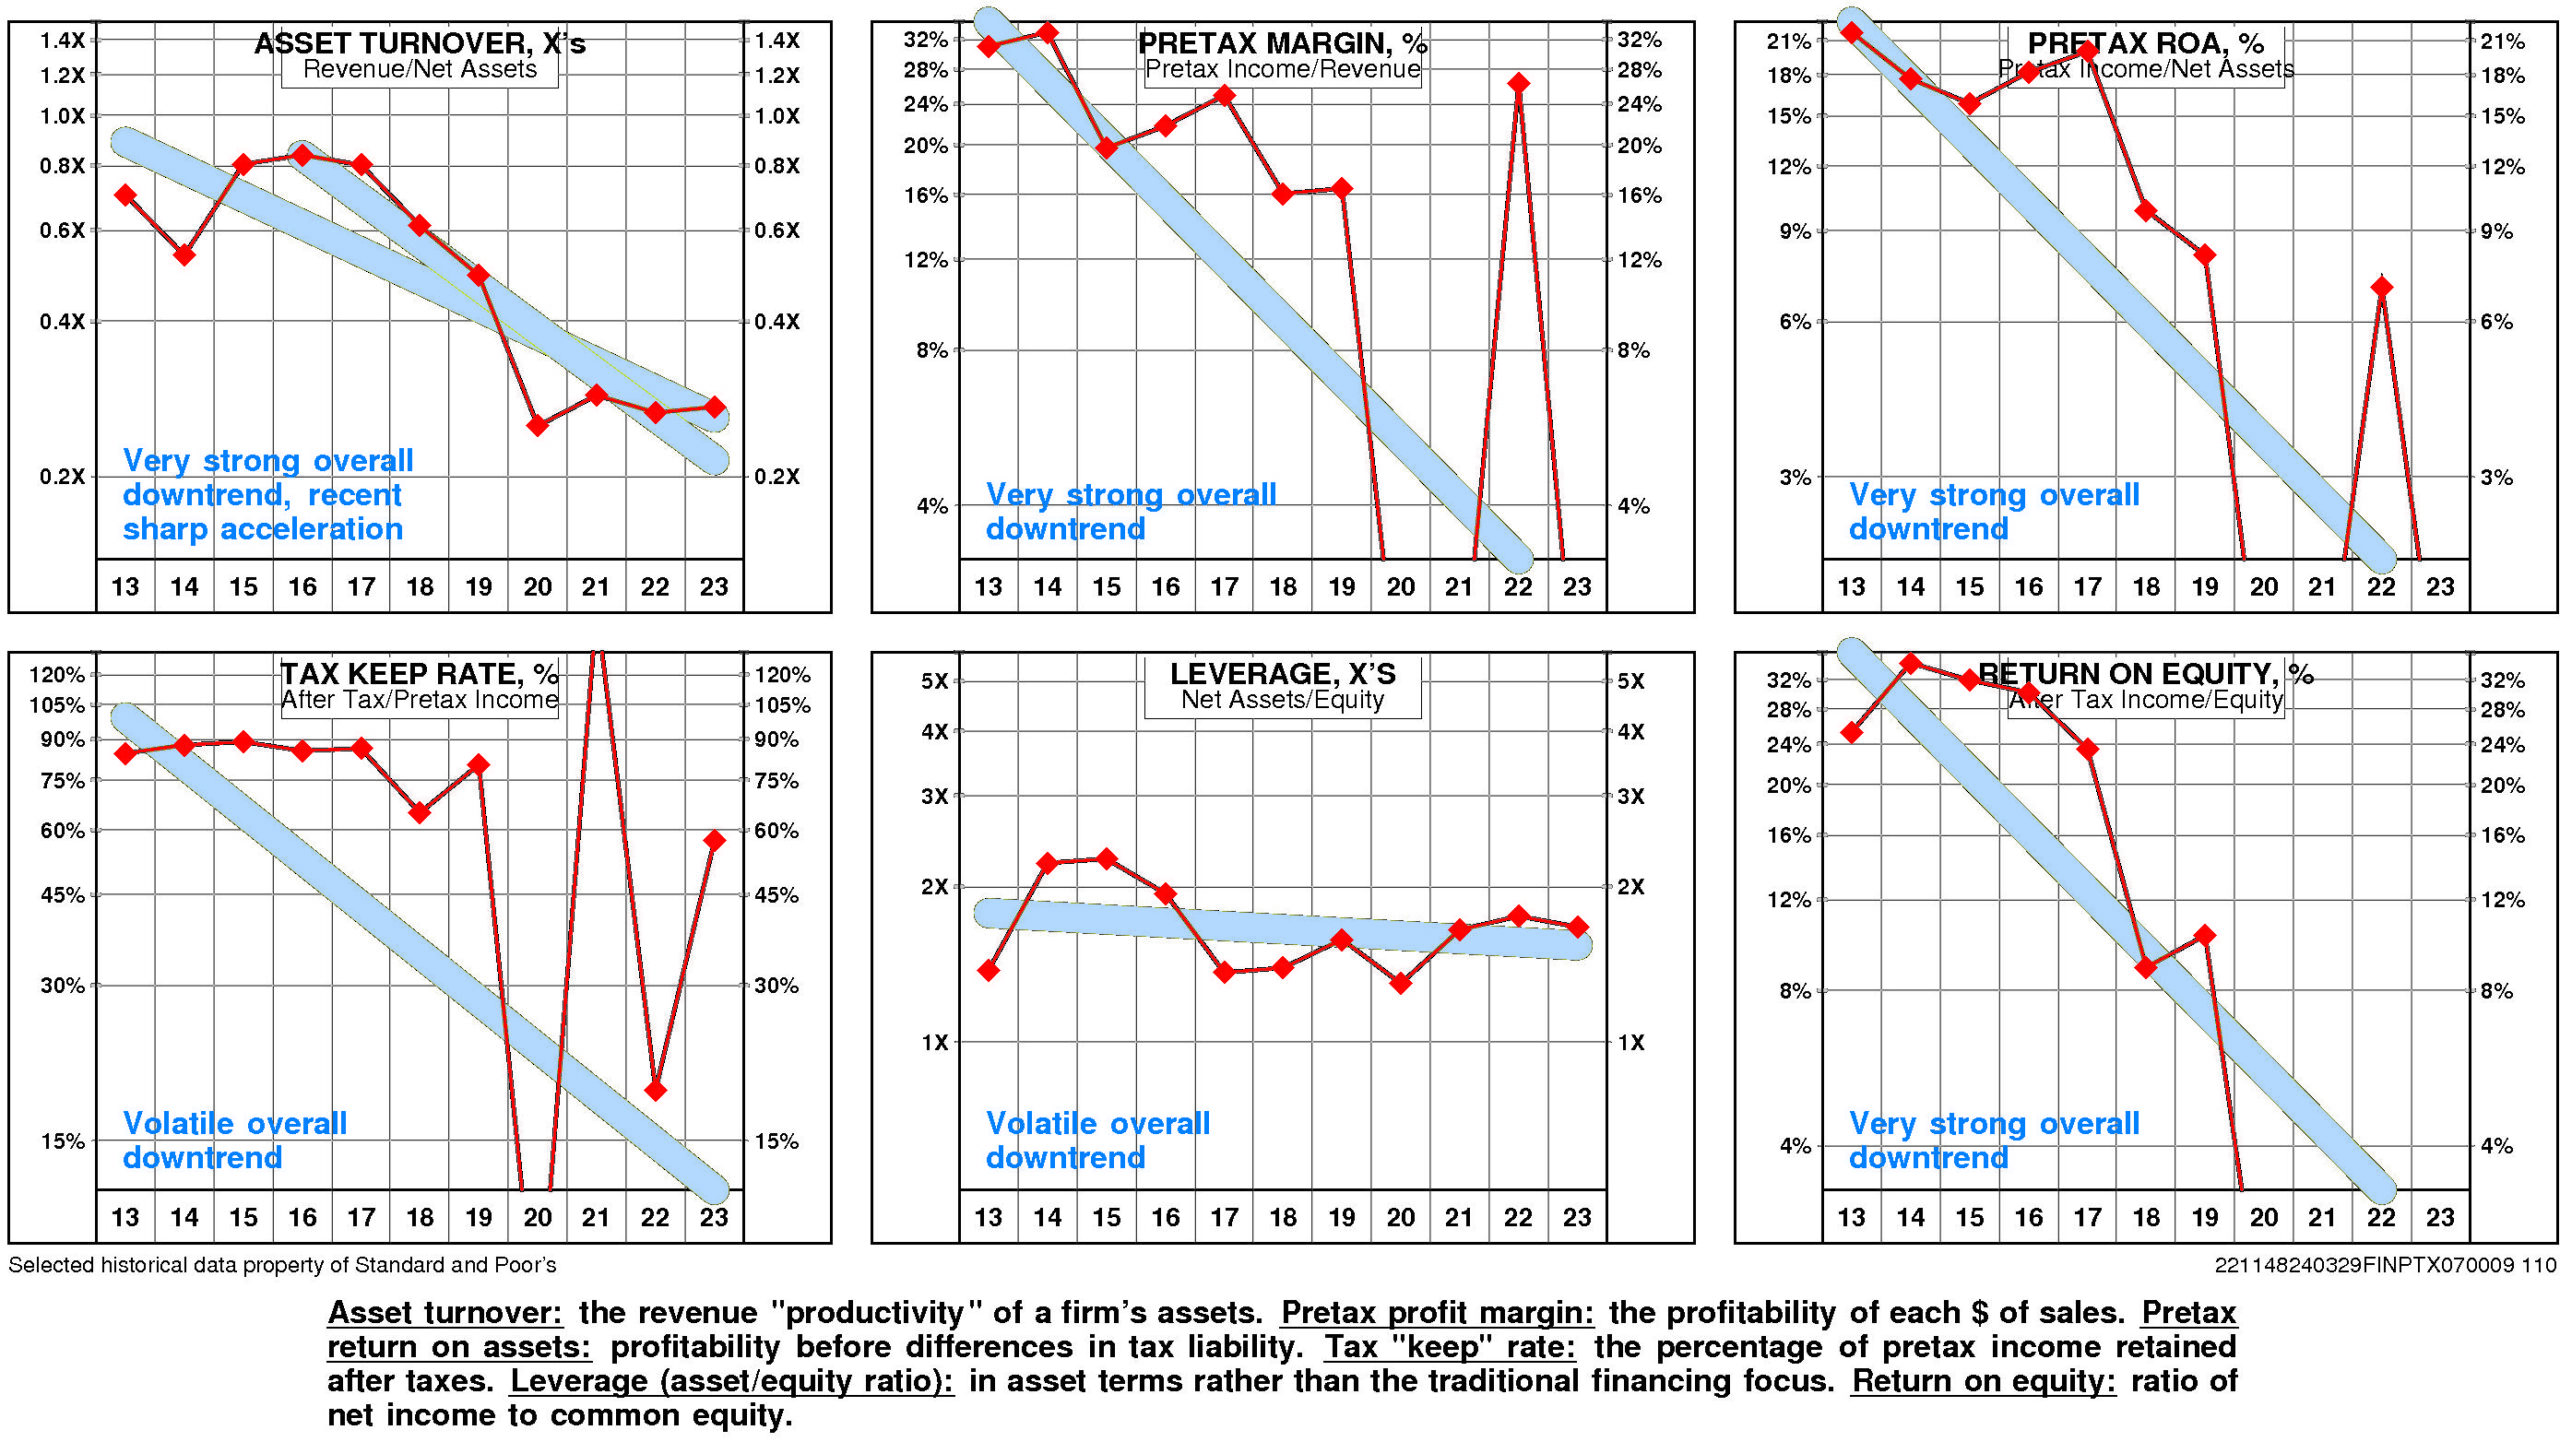
JOYY’s return on equity has eroded very significantly since 2013. The current level is -1.5% versus the high of 25.3% and the low of -2.3%.
A major analytical focus for YY is a very strong negative trend in pretax operating return significantly augmented by a very strong negative trend in non-operating factors.
The productivity of JOYY’s assets declined over the full period 2013-2023: asset turnover has suffered a very strong overall downtrend that accelerated sharply after the 2016 level.
JOYY’s pretax margin experienced a very strong overall downtrend over the period 2013-2023.
Non-operating factors (income taxes and financial leverage) had a significant negative influence on return on equity.
JOYY’s return on equity is lower quartile (-1.5%) for the four quarters ended September, 2023.
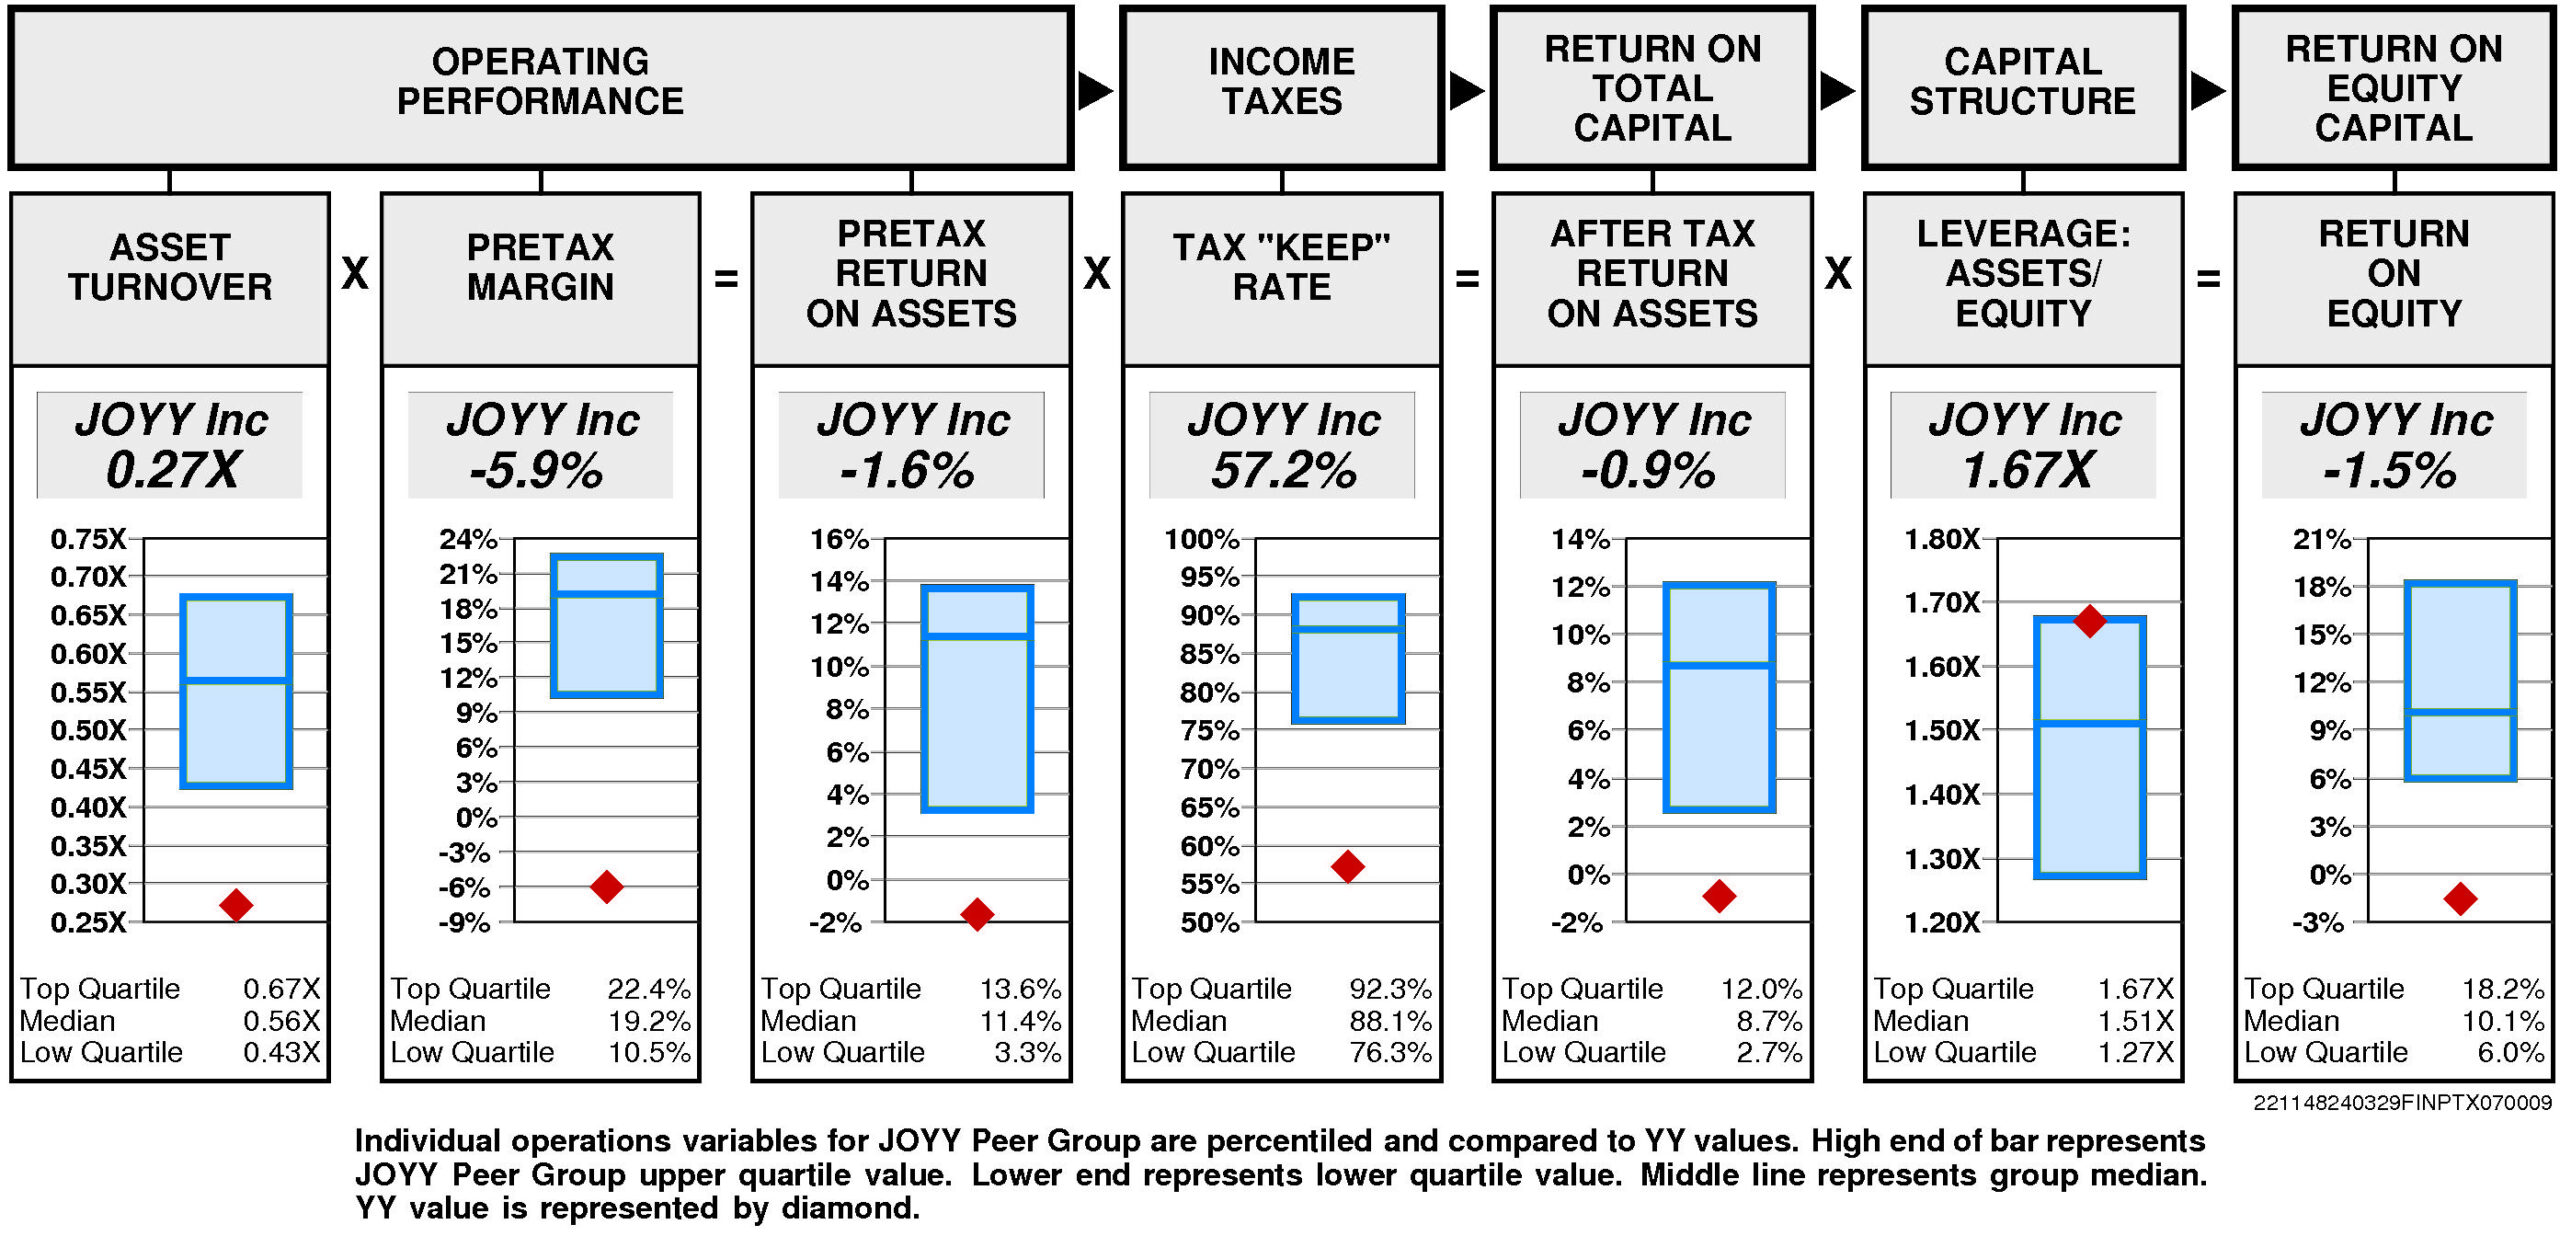
Operating performance (pretax return on assets) is lower quartile (-1.6%) reflecting asset turnover that is lower quartile (0.27X) and lower quartile pretax margin (-5.9%).
Tax “keep” rate (income tax management) is lower quartile (57.2%) resulting in after tax return on assets that is lower quartile.
Financial leverage (leverage) is at the upper quartile (1.67X).
GROWTH RATES
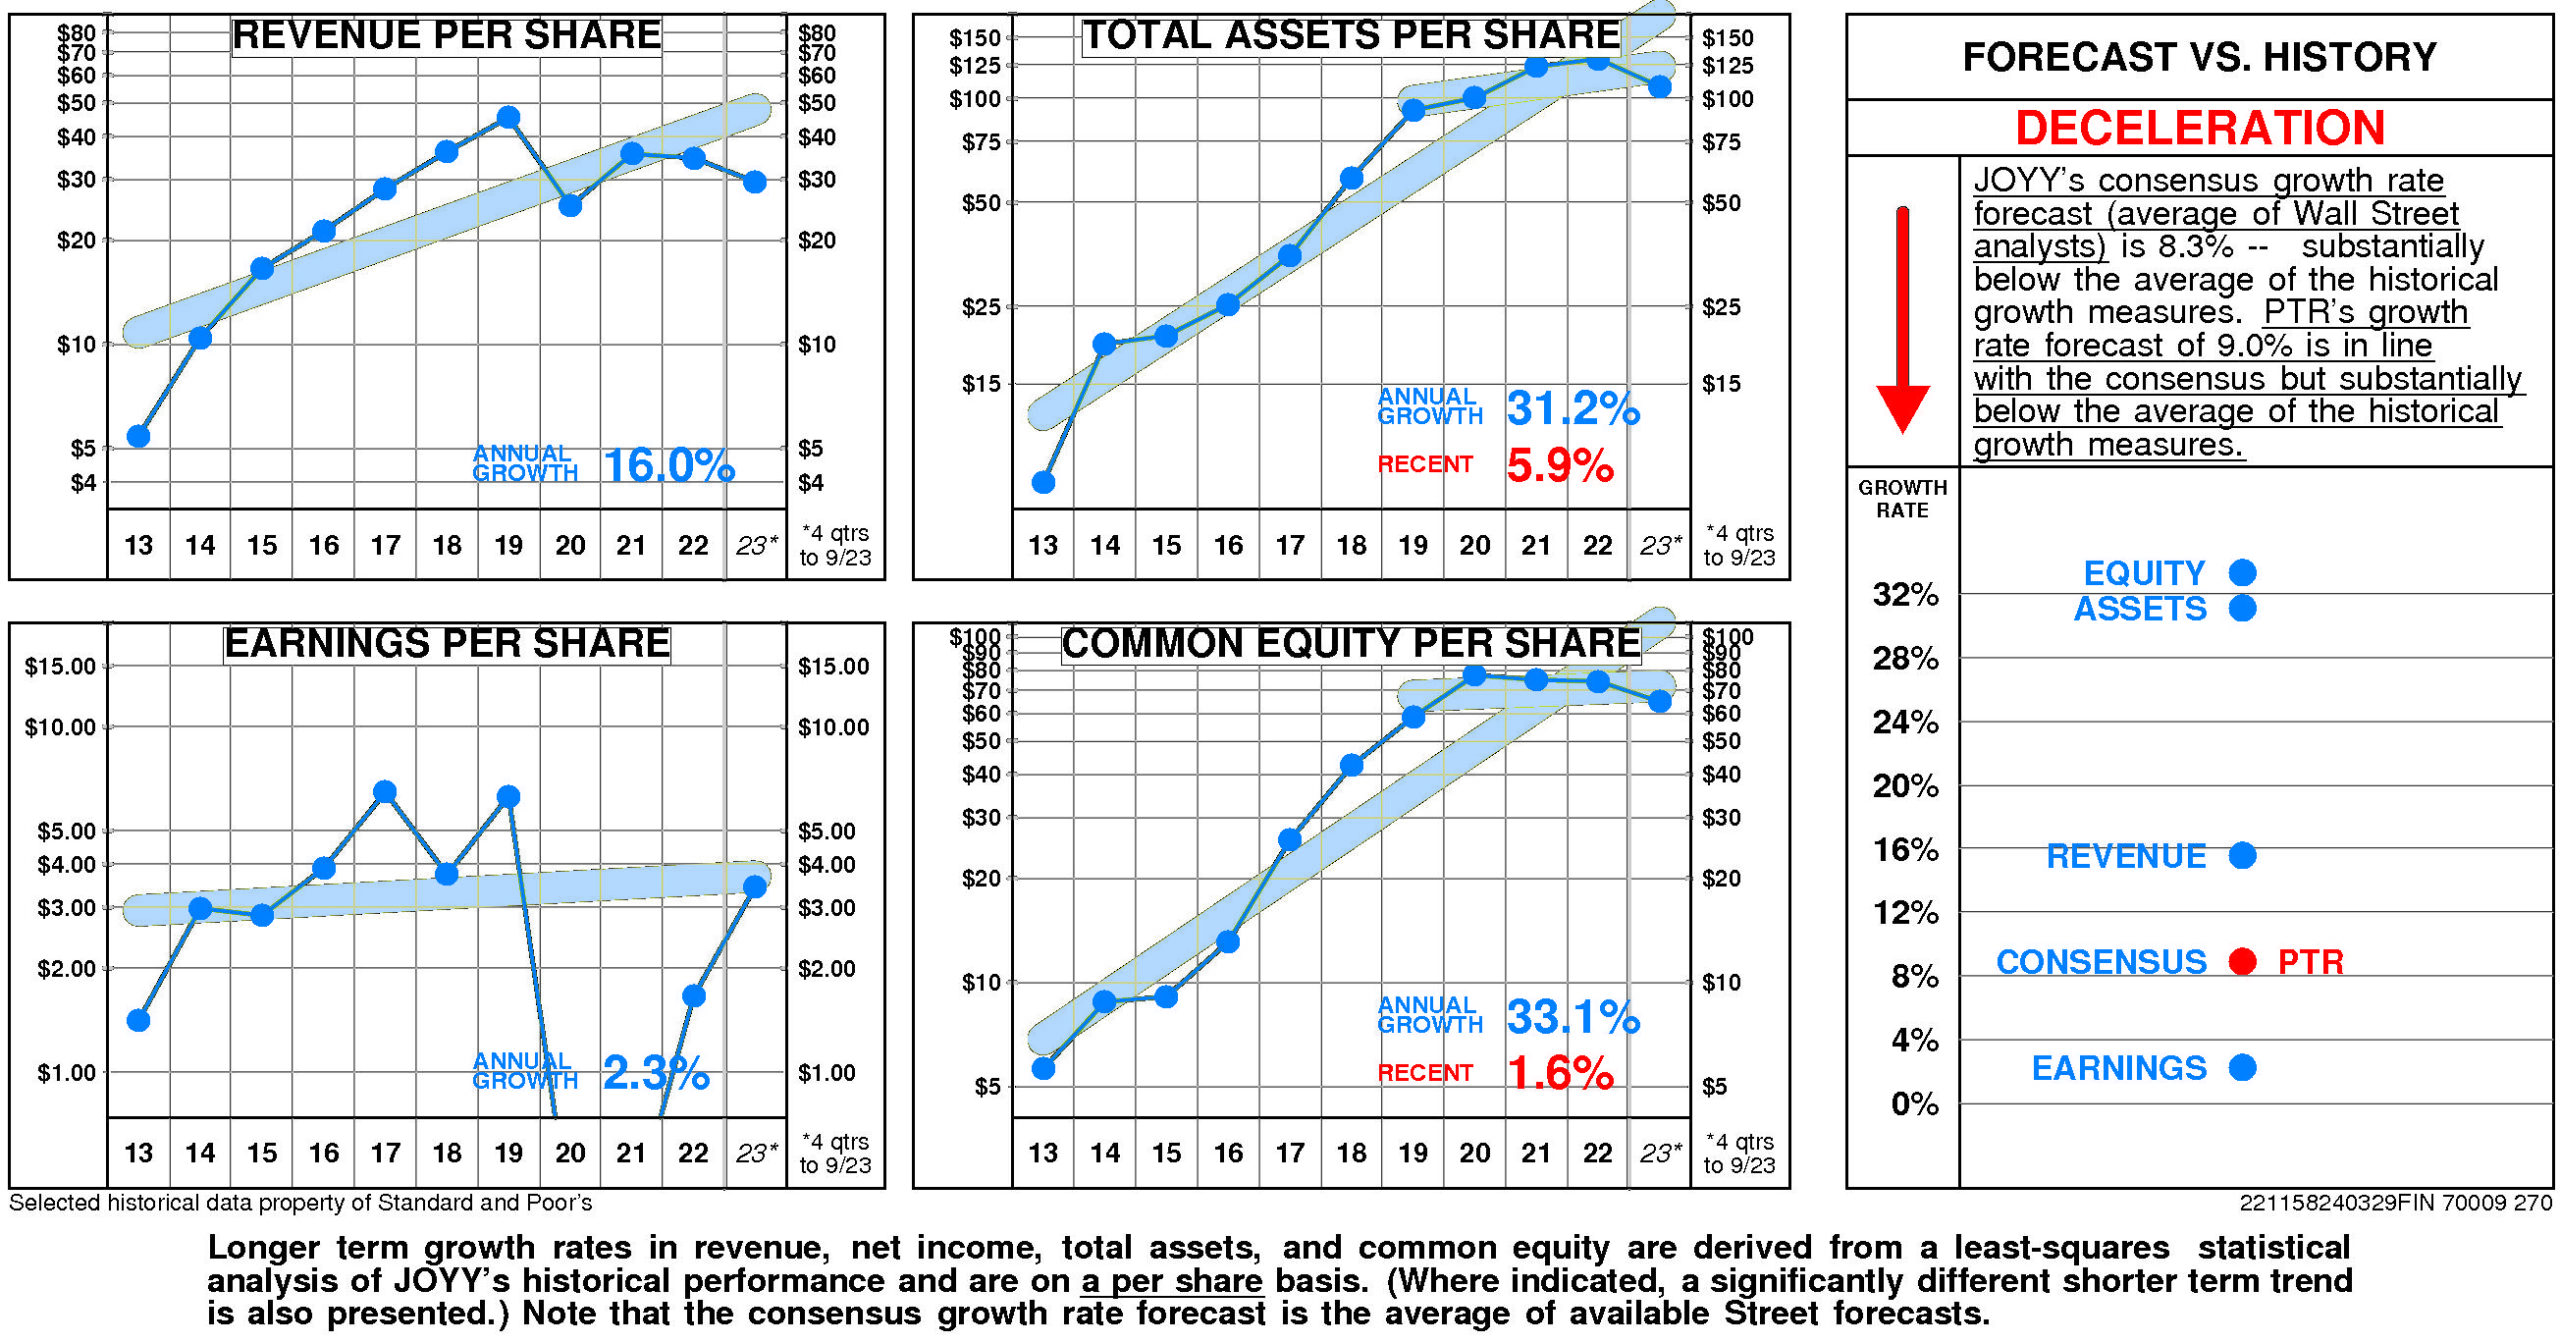
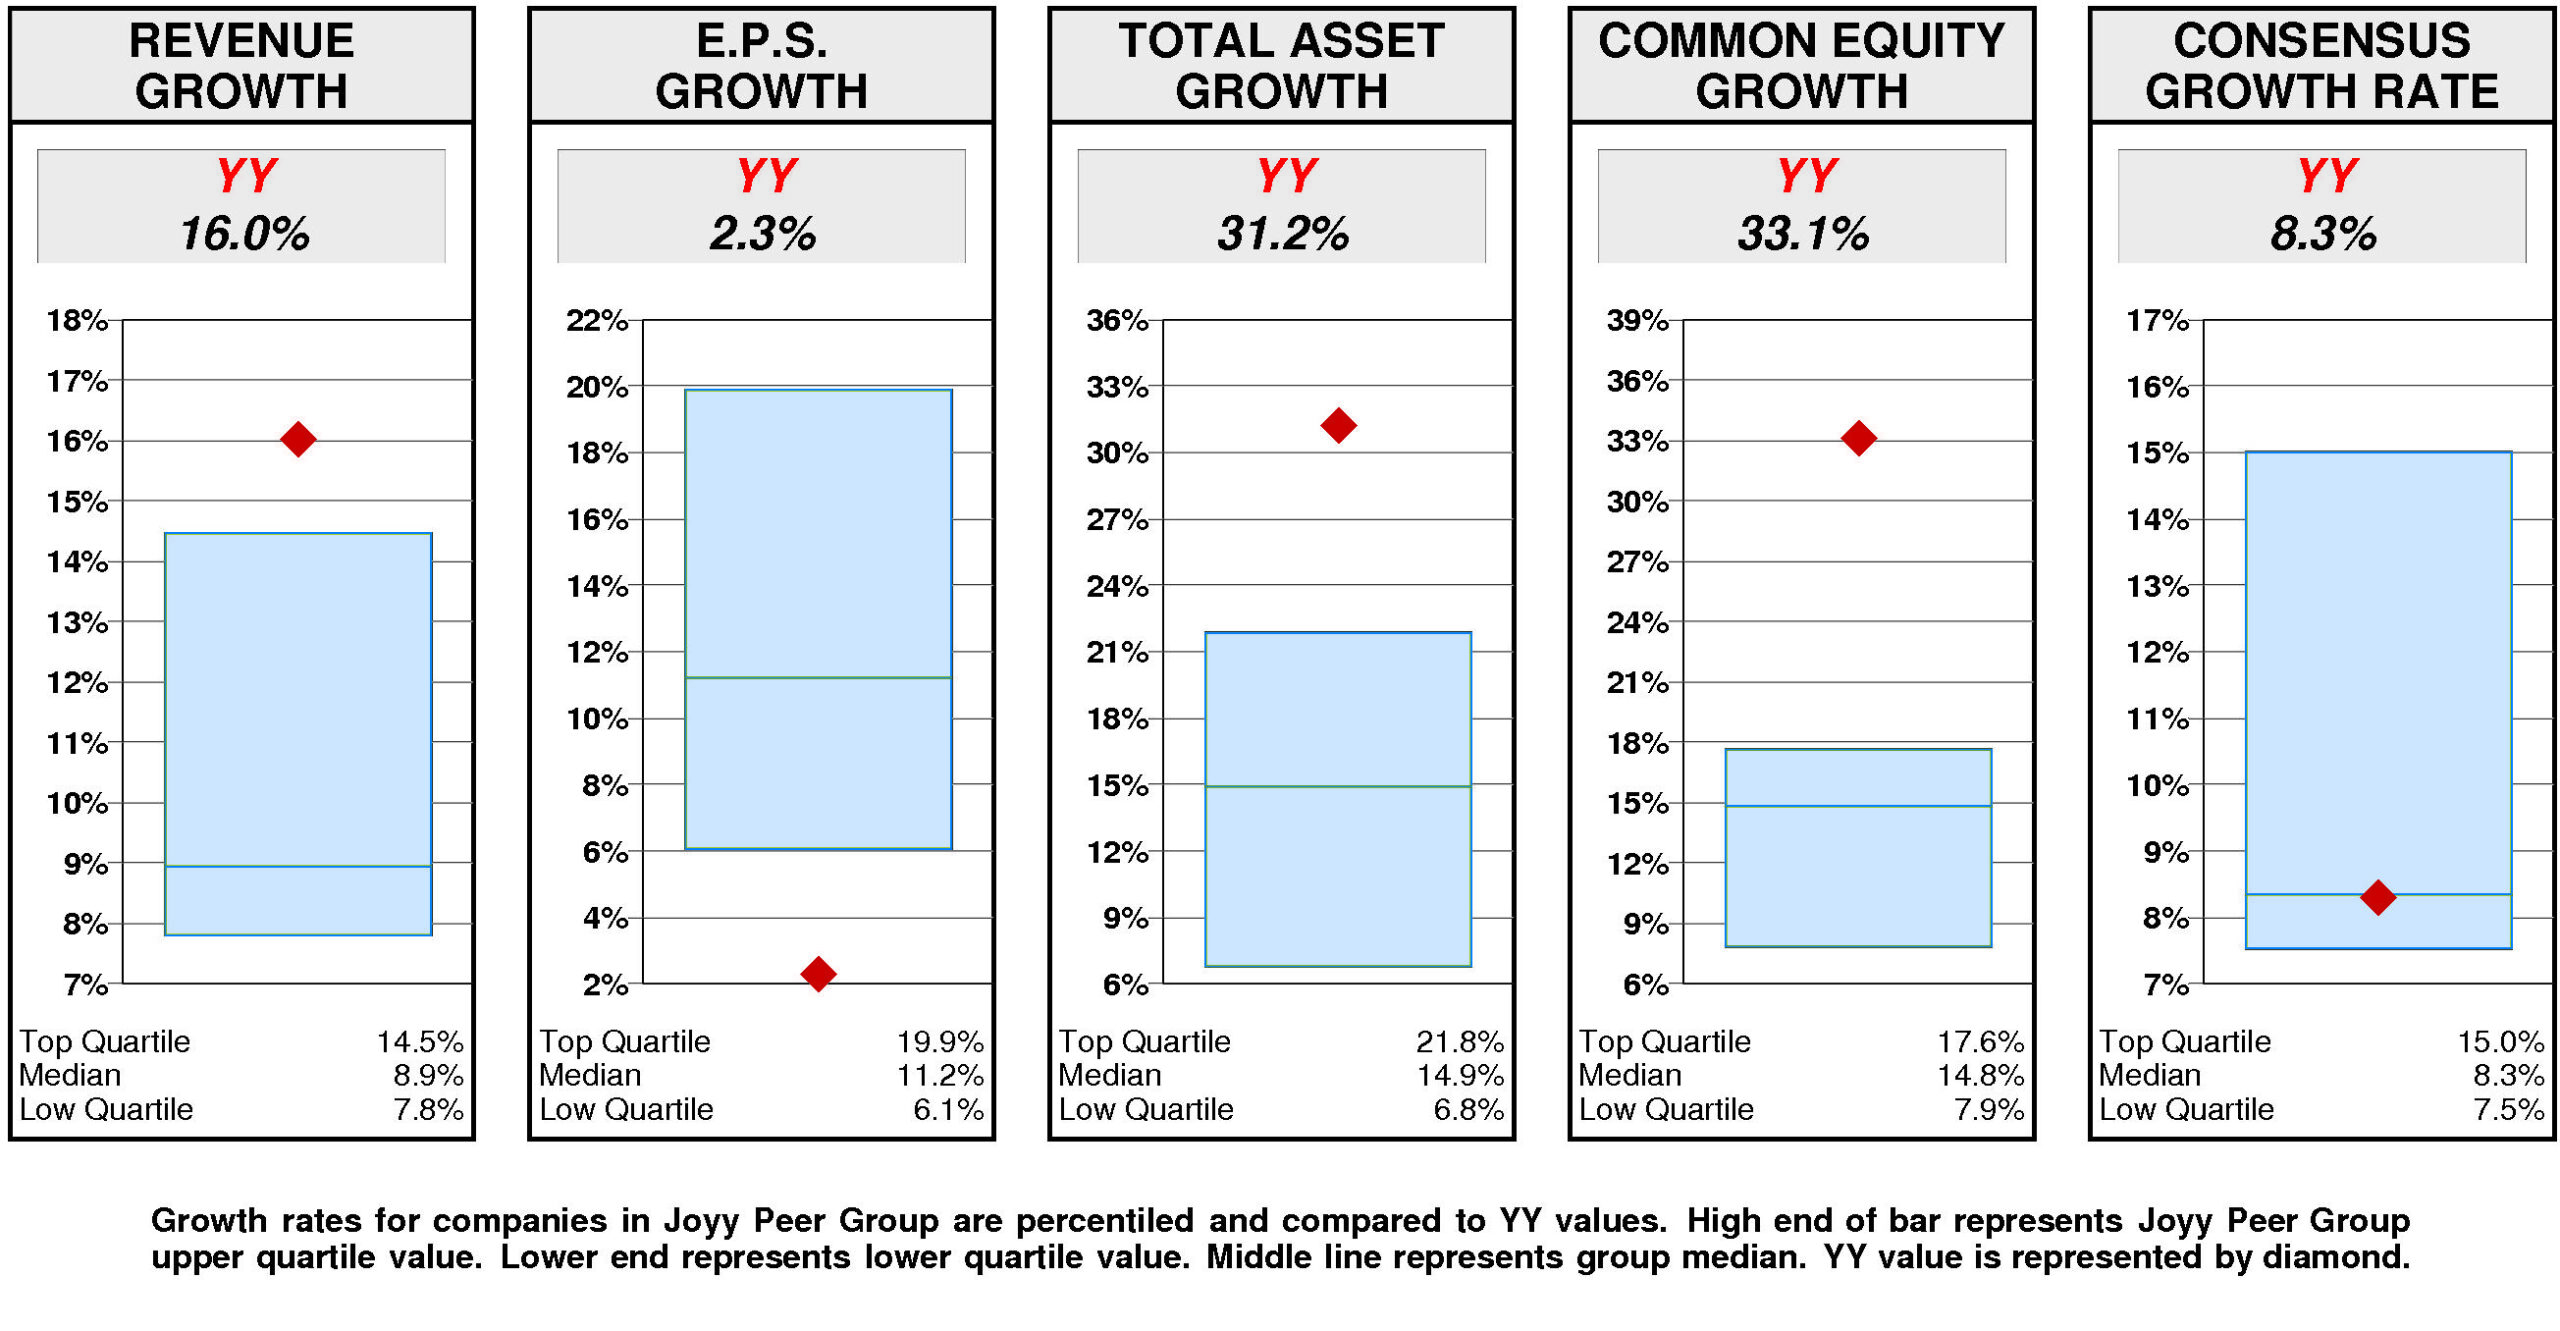
Overall, JOYY’s growth rate has slowed very considerably in recent years.
JOYY’s historical income statement growth has been lower than balance sheet growth. Revenue growth has fallen short of asset growth; earnings growth has fallen short of equity growth.
Annual revenue growth has been 16.0% per year.
Total asset growth has been 31.2% per year. (More recently it has been 5.9%.)
Annual E.P.S. growth has been 2.3% per year.
Equity growth has been 33.1% per year. (More recently it has been 1.6%.)
JOYY’s consensus growth rate forecast (average of Wall Street analysts) is 8.3% — substantially below the average of the historical growth measures.
Relative to the Joyy Peer Group, JOYY’s historical growth measures are generally top quartile. Revenue growth (16.0%) has been upper quartile. Total asset growth (31.2%) has been upper quartile. Equity growth (33.1%) has been upper quartile. E.P.S. growth (2.3%) has been lower quartile.
In agreement with this pattern, consensus growth forecast (8.3%) is at median.
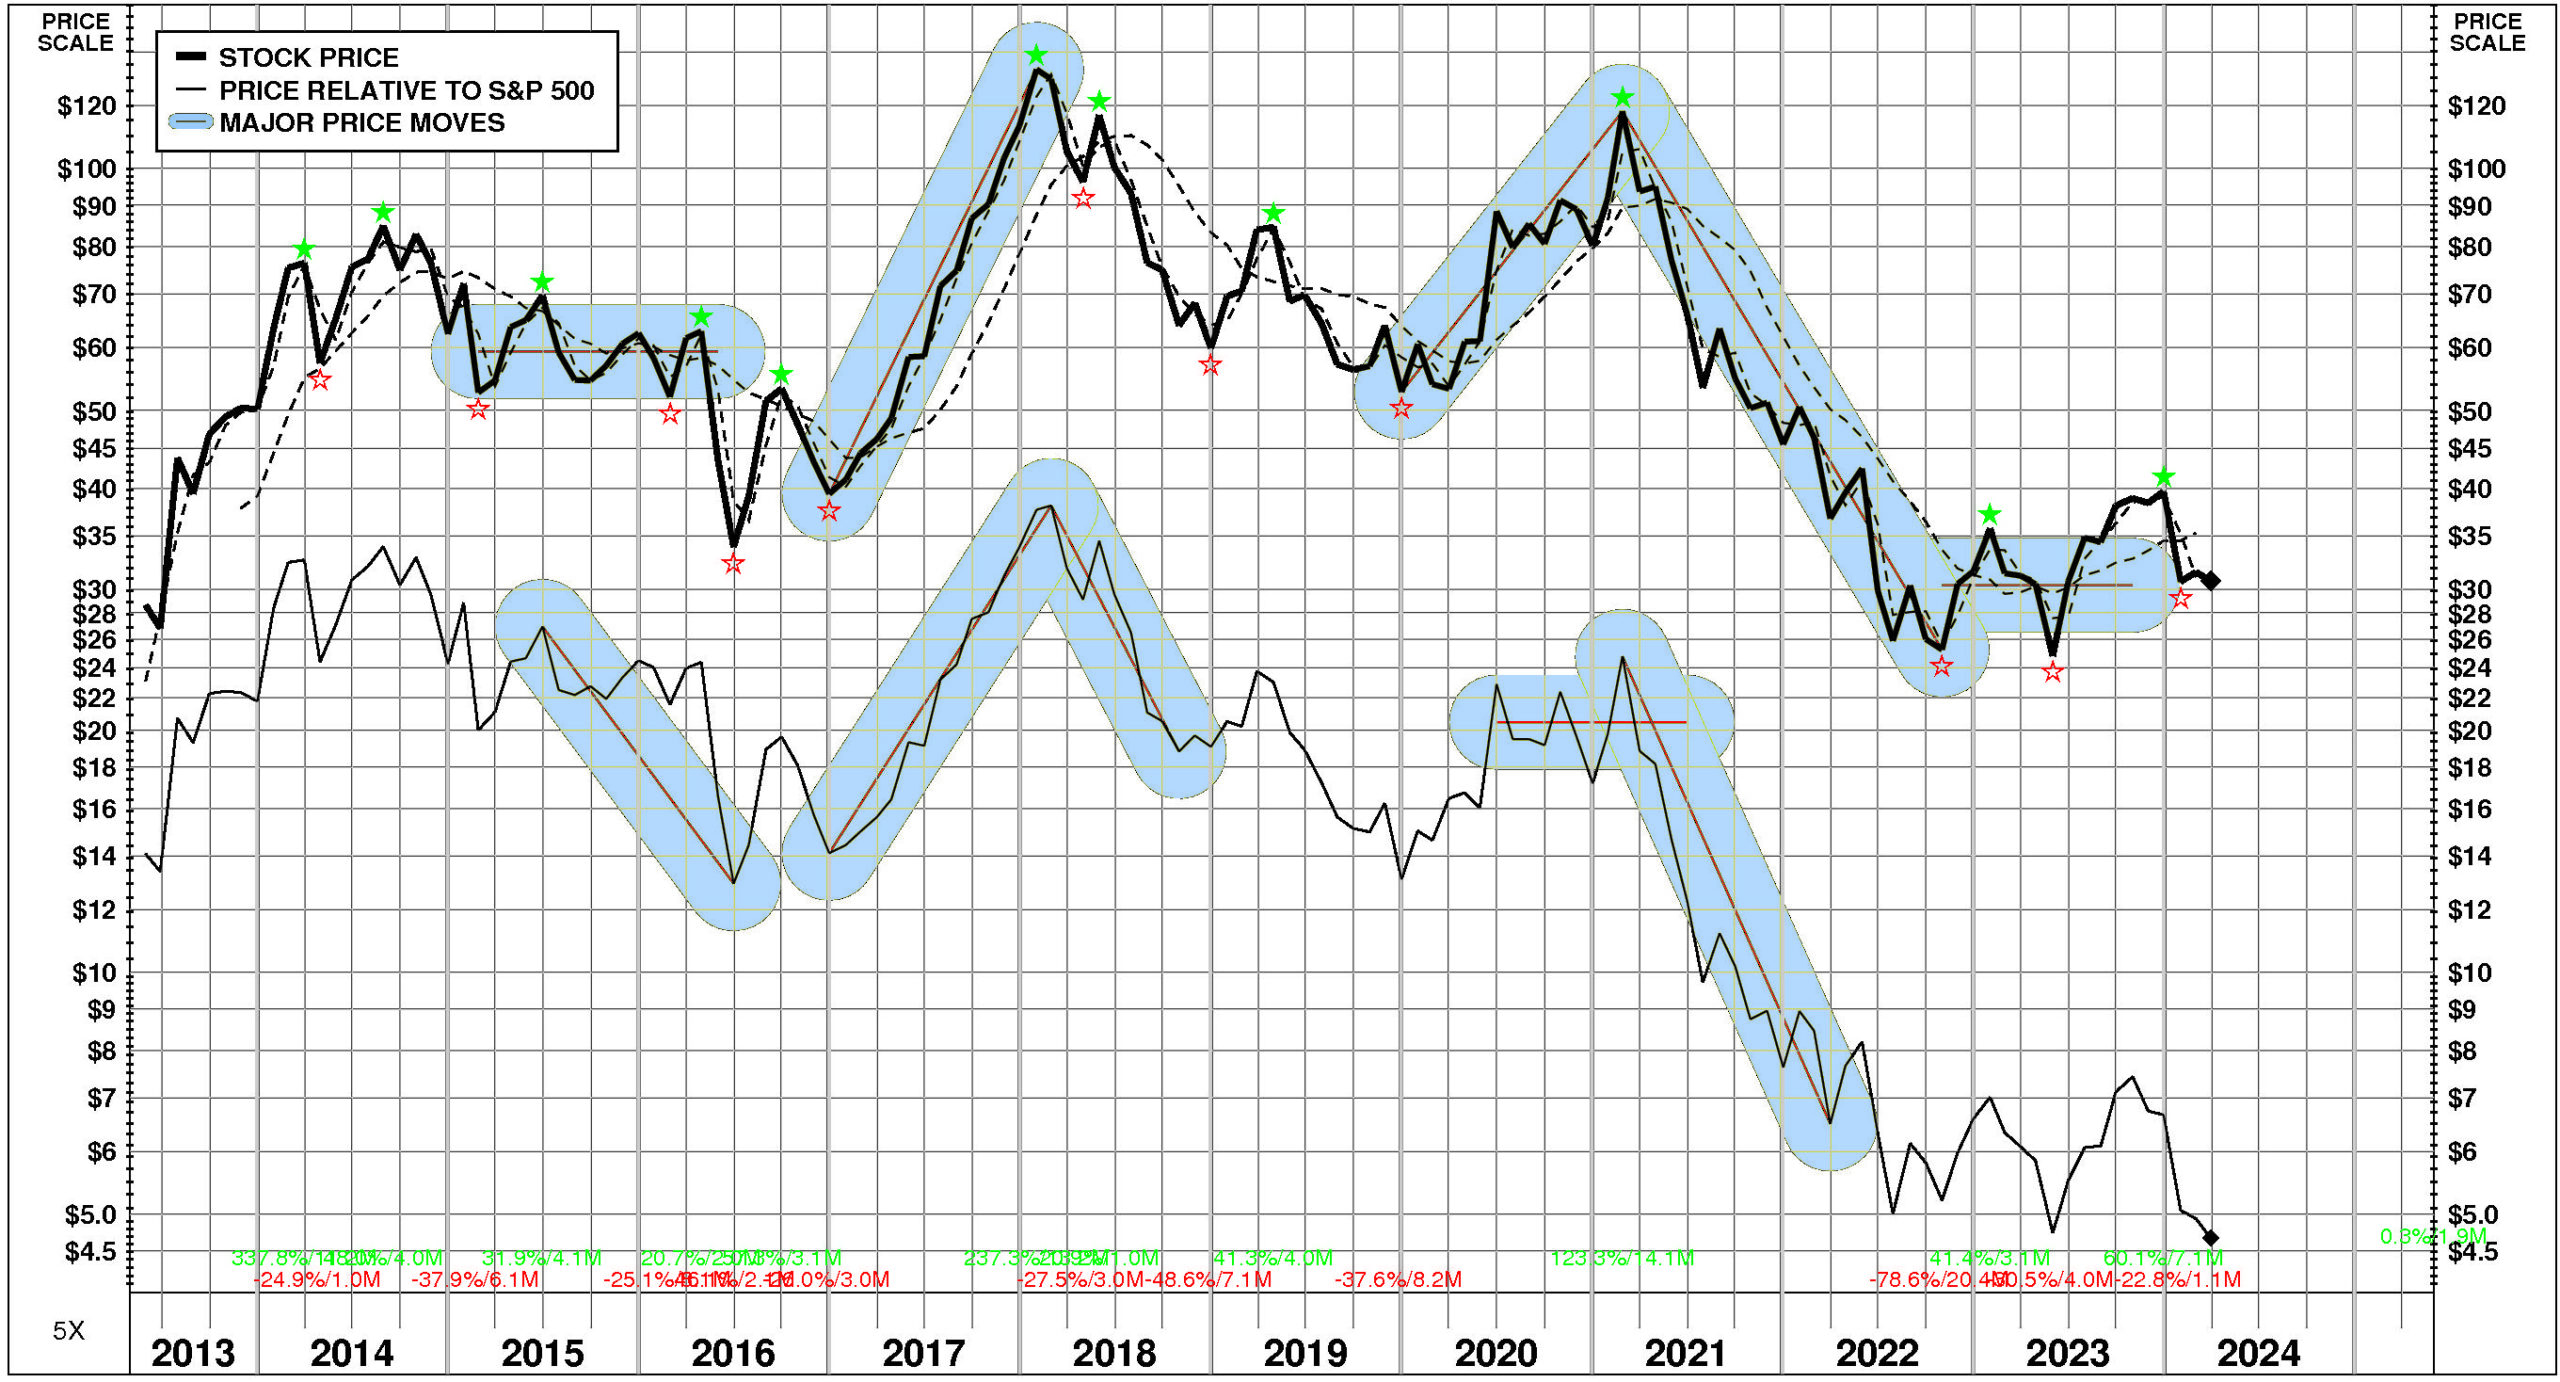
PRICE HISTORY
Over the full time period, JOYY’s stock price performance has been volatile and significantly below market. Between May, 2013 and March, 2024, JOYY’s stock price rose +7%; relative to the market, this was a -67% loss. Significant price moves during the period: 1) February, 2021 – October, 2022: -79%; 2) December, 2019 – February, 2021: +123%; and 3) December, 2016 – January, 2018: +237%.
TOTAL INVESTMENT RETURNS
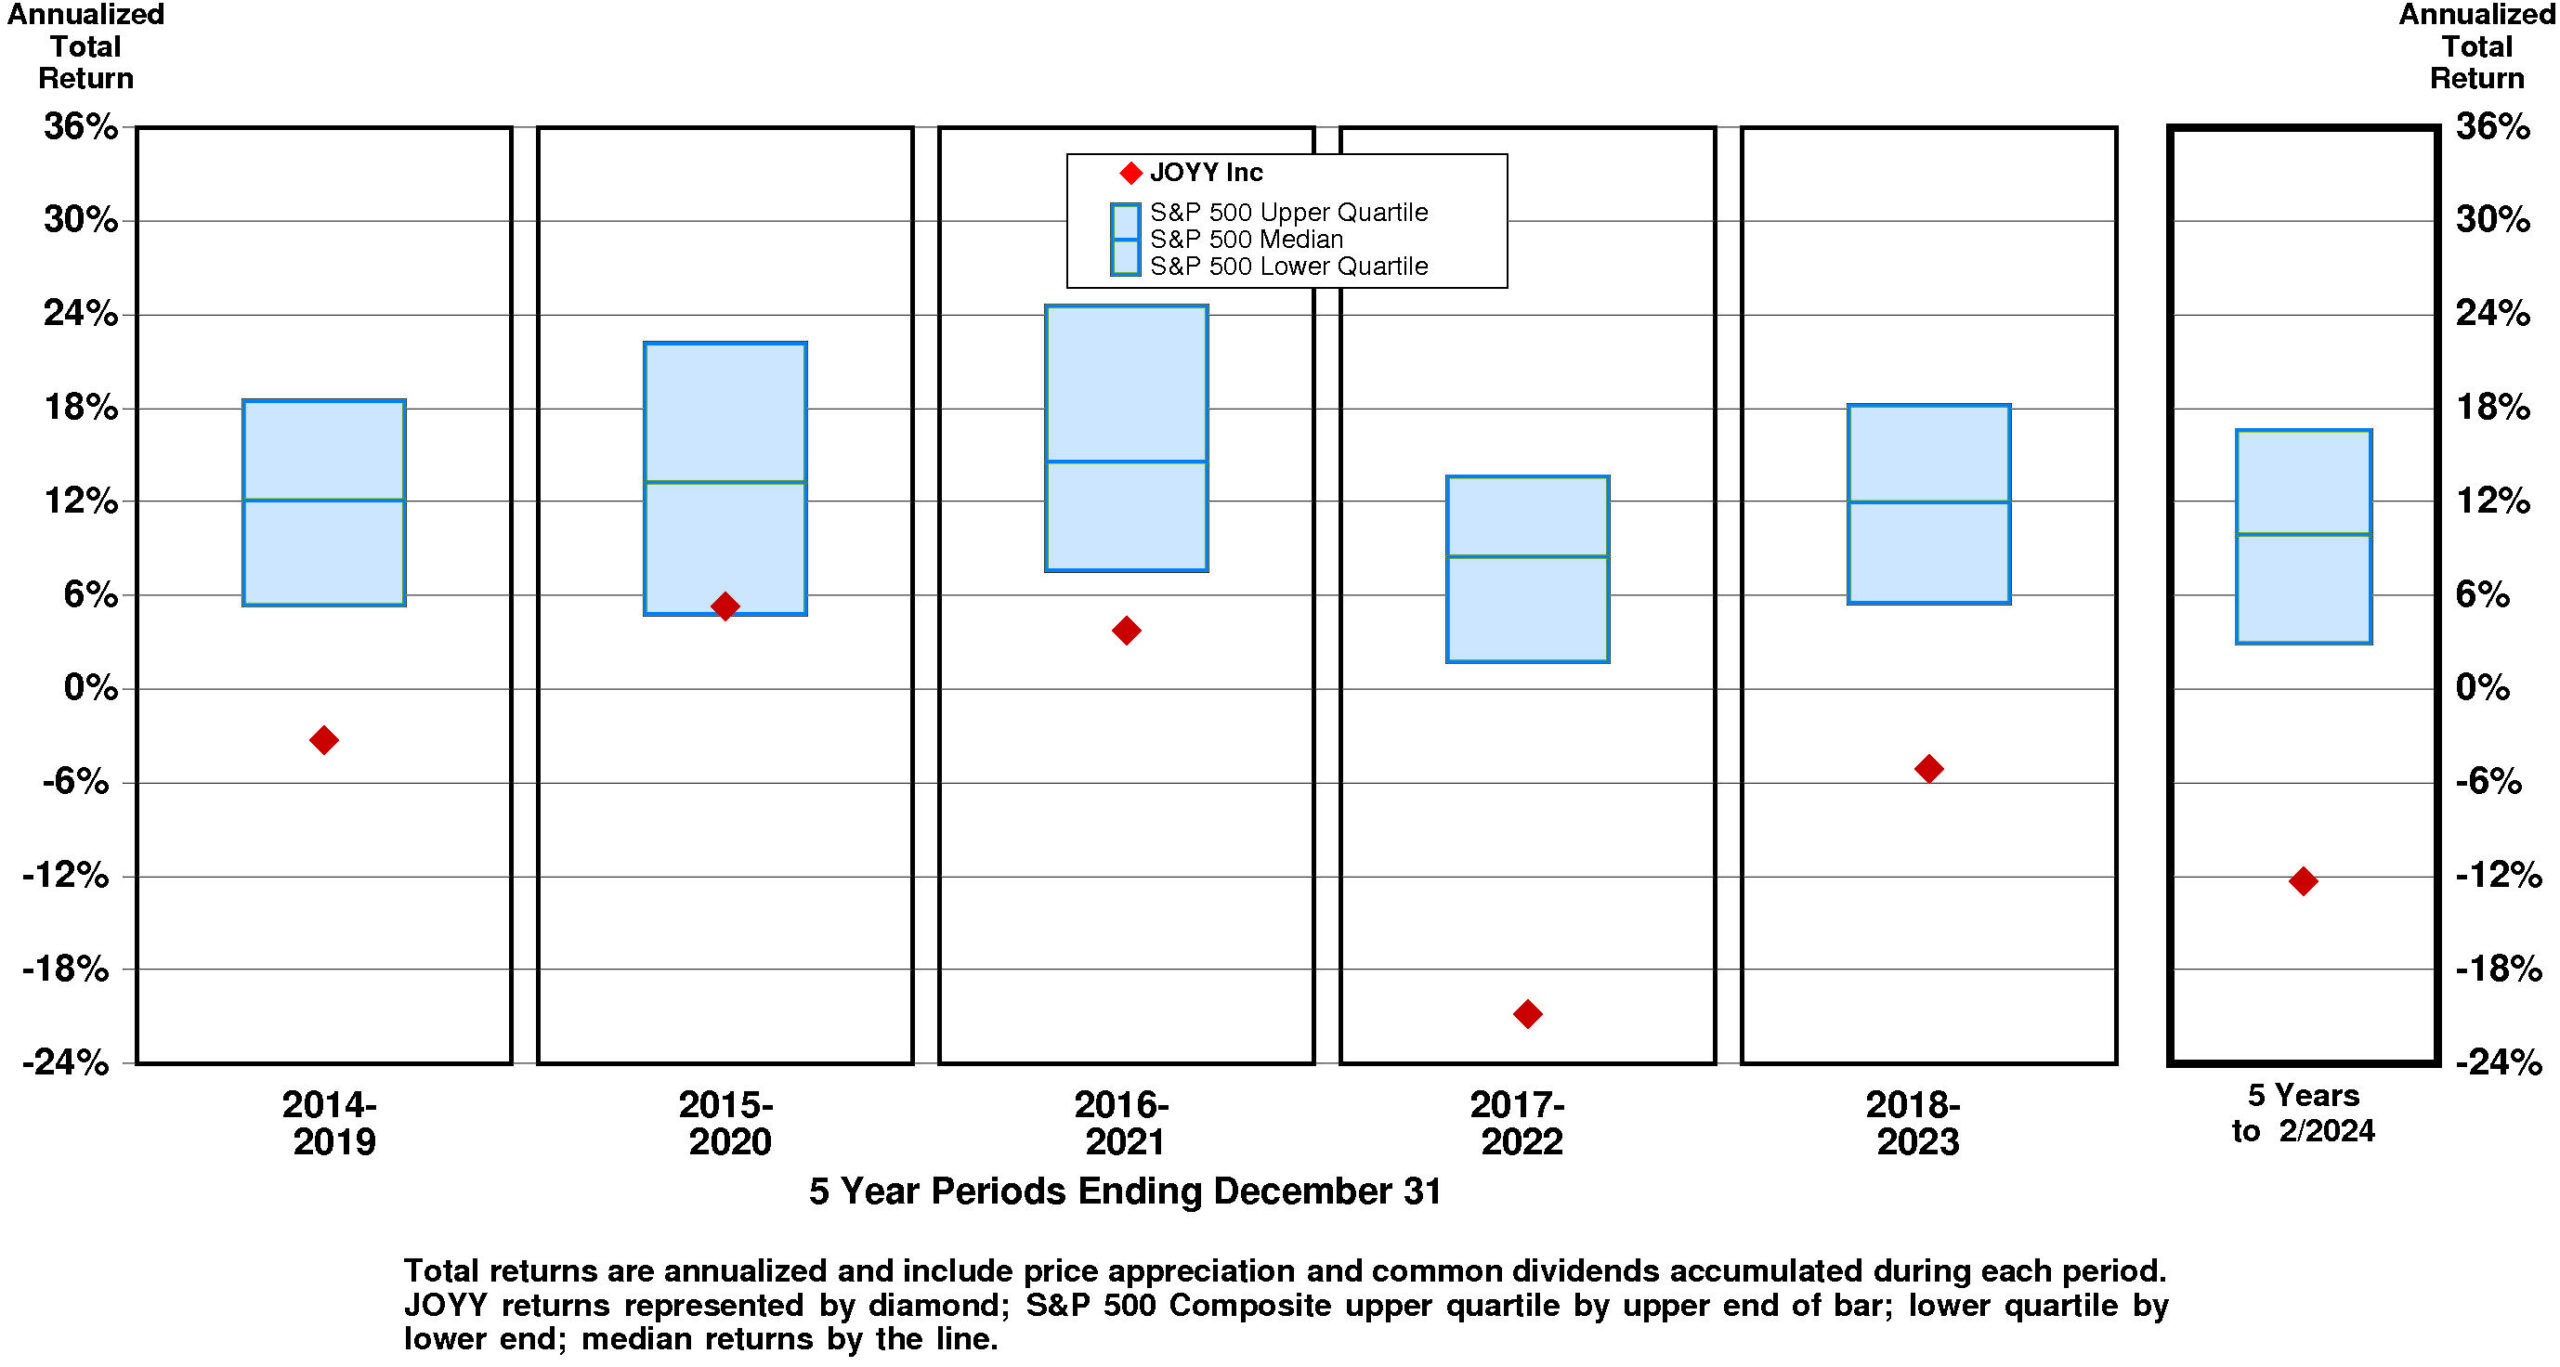
Current annual total return performance of 4.2% is below median relative to the S&P 500 Composite.
In addition to being below median relative to S&P 500 Composite, current annual total return performance through February, 2024 of 4.2% is below median relative to JOYY Inc Peer Group.
Current 5-year total return performance of -12.3% is lower quartile relative to the S&P 500 Composite.
Through February, 2024, with lower quartile current 5-year total return of -12.3% relative to S&P 500 Composite, JOYY’s total return performance is lower quartile relative to JOYY Inc Peer Group.
VALUATION BENCHMARKS
Relative to S&P 500 Composite, YY’s overall valuation is exceptionally low. Ratio of enterprise value/revenue is lower quartile. Ratio of enterprise value/assets is lower quartile. Price/equity ratio is lower quartile. Price/earnings ratio is unavailable. Ratio of enterprise value/earnings before interest and taxes is unavailable.
Relative to JOYY Peer Group, YY’s overall valuation is exceptionally low. Ratio of enterprise value/revenue is lower quartile. Ratio of enterprise value/assets is lower quartile. Price/equity ratio is lower quartile. Price/earnings ratio is unavailable. Ratio of enterprise value/earnings before interest and taxes is unavailable.
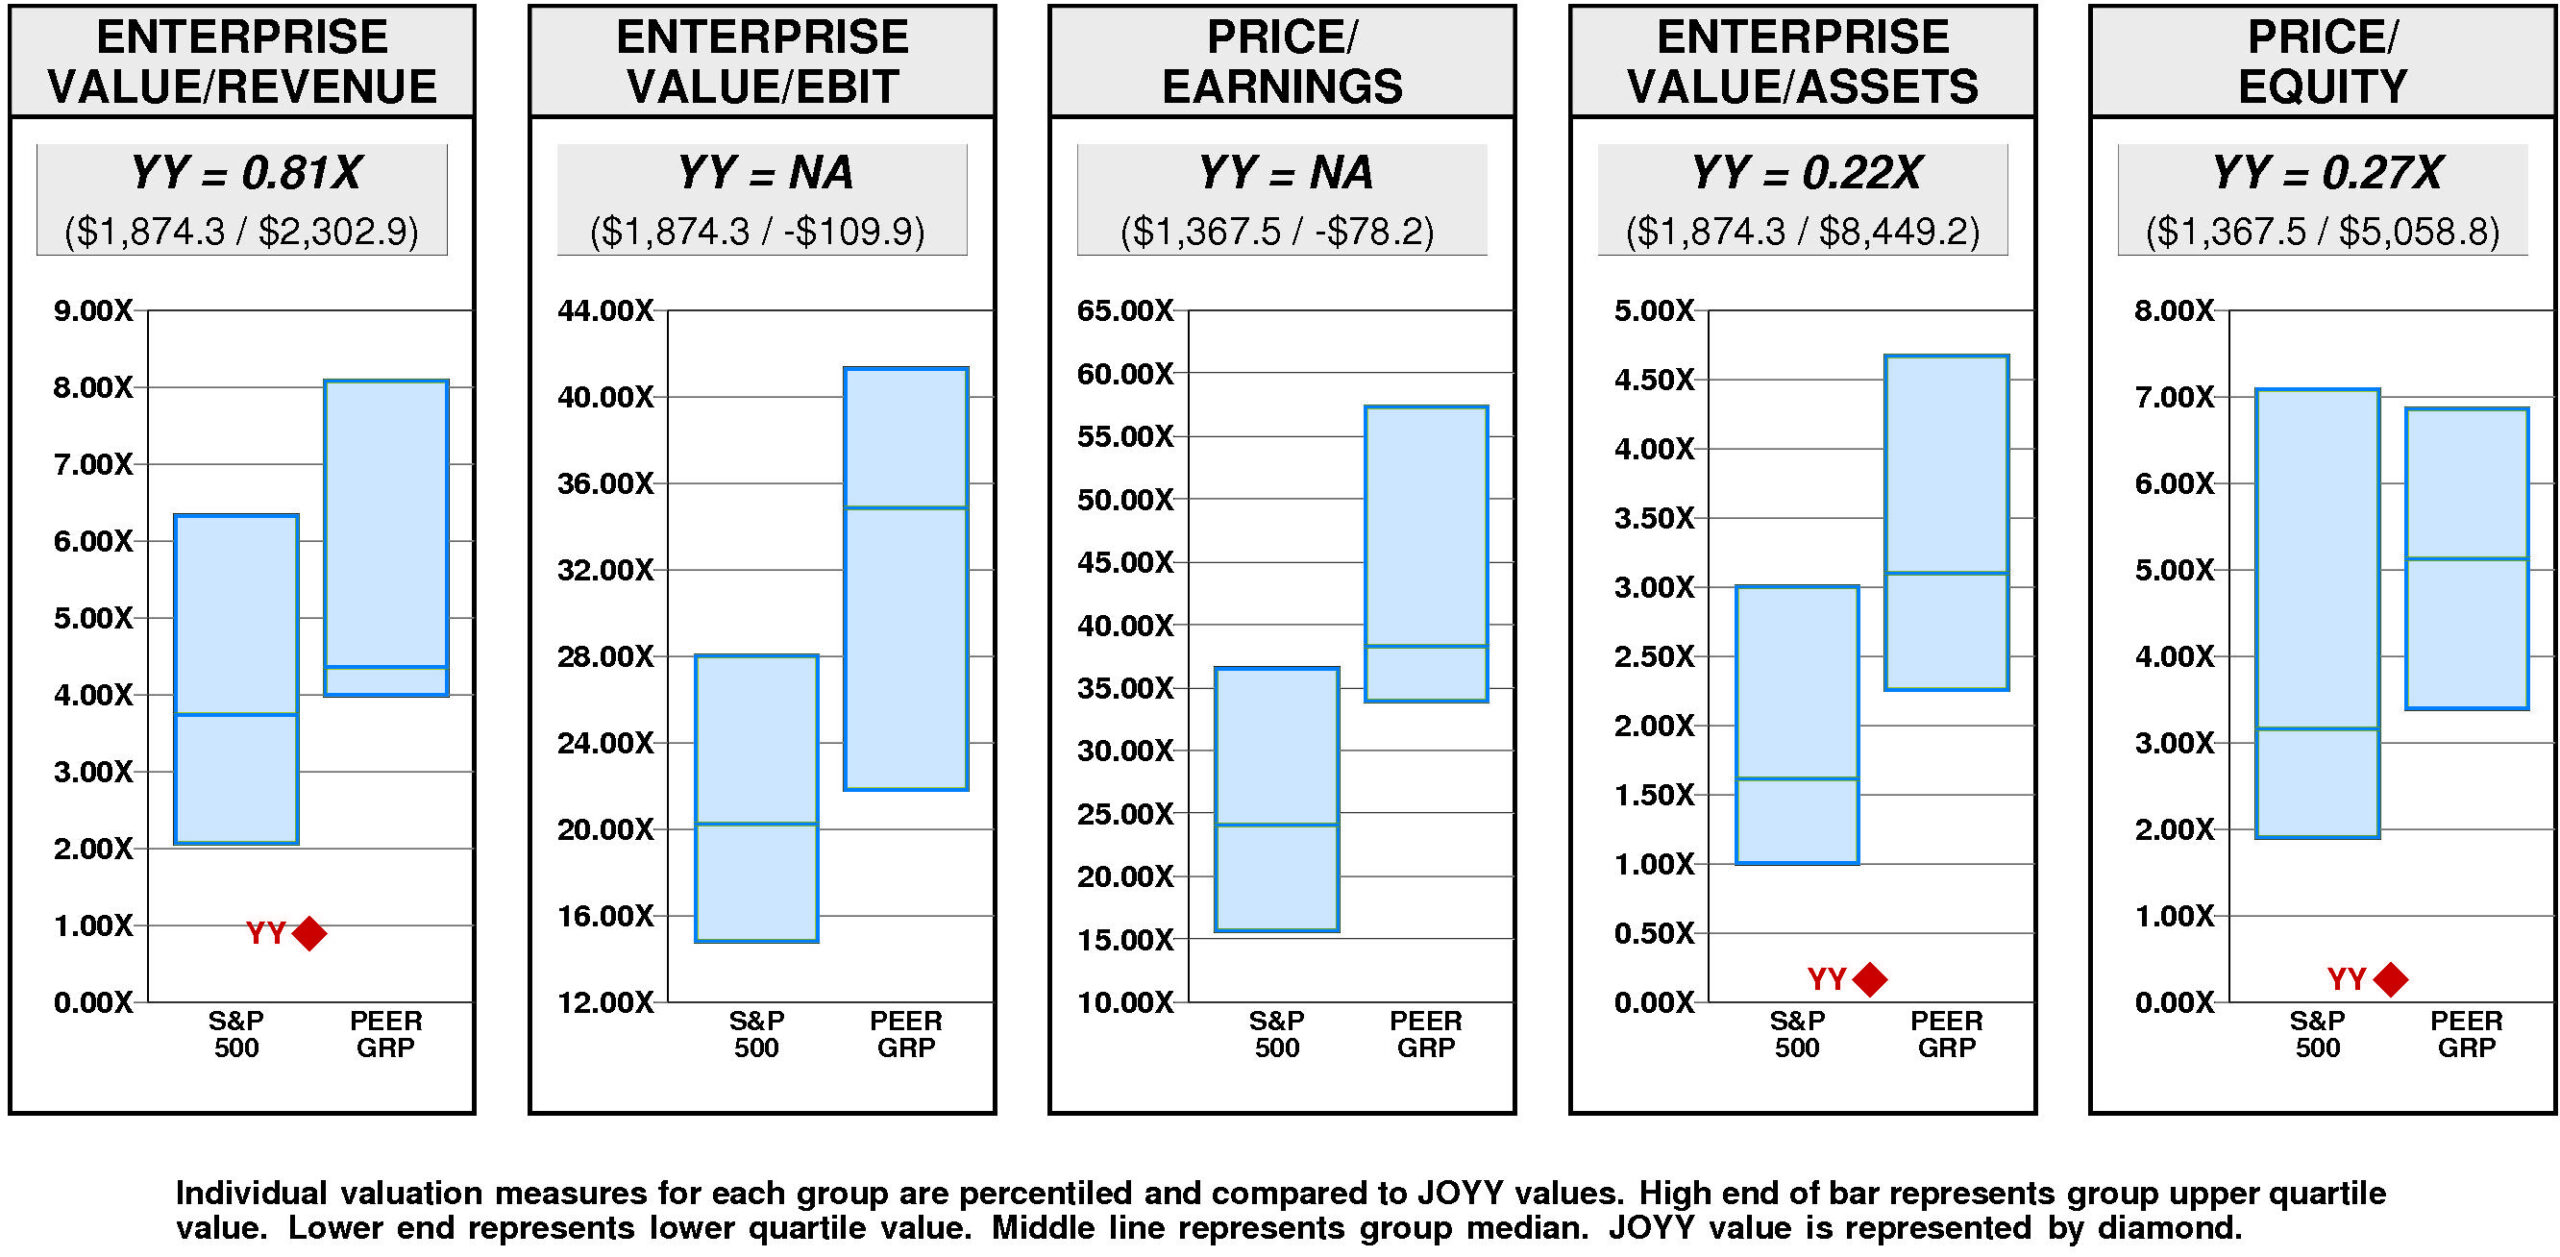
JOYY has a major value gap compared to the median. For YY to hit median valuation, its current ratio of enterprise value/revenue would have to rise from the current level of 0.81X to 4.36X. If YY’s ratio of enterprise value/revenue were to rise to 4.36X, its stock price would be higher by $184 to $214.
For YY to achieve upper quartile valuation relative to the JOYY Peer Group, its current ratio of enterprise value/revenue would have to rise from the current level of 0.81X to 8.08X. If YY’s ratio of enterprise value/revenue were to rise to 8.08X, its stock price would increase by $376 from the current level of $31.
VALUE TARGETS
YY’s future returns on capital are forecasted to be in line with the cost of capital. Accordingly, the company is expected to continue to be Value Creation neutral.
JOYY’s current Price Target of $130 represents a +322% change from the current price of $30.75.
This very high appreciation potential results in an appreciation score of 93 (only 7% of the universe has greater appreciation potential.)
Notwithstanding this high Appreciation Score of 93, the moderately low Power Rating of 31 results in an Value Trend Rating of C.
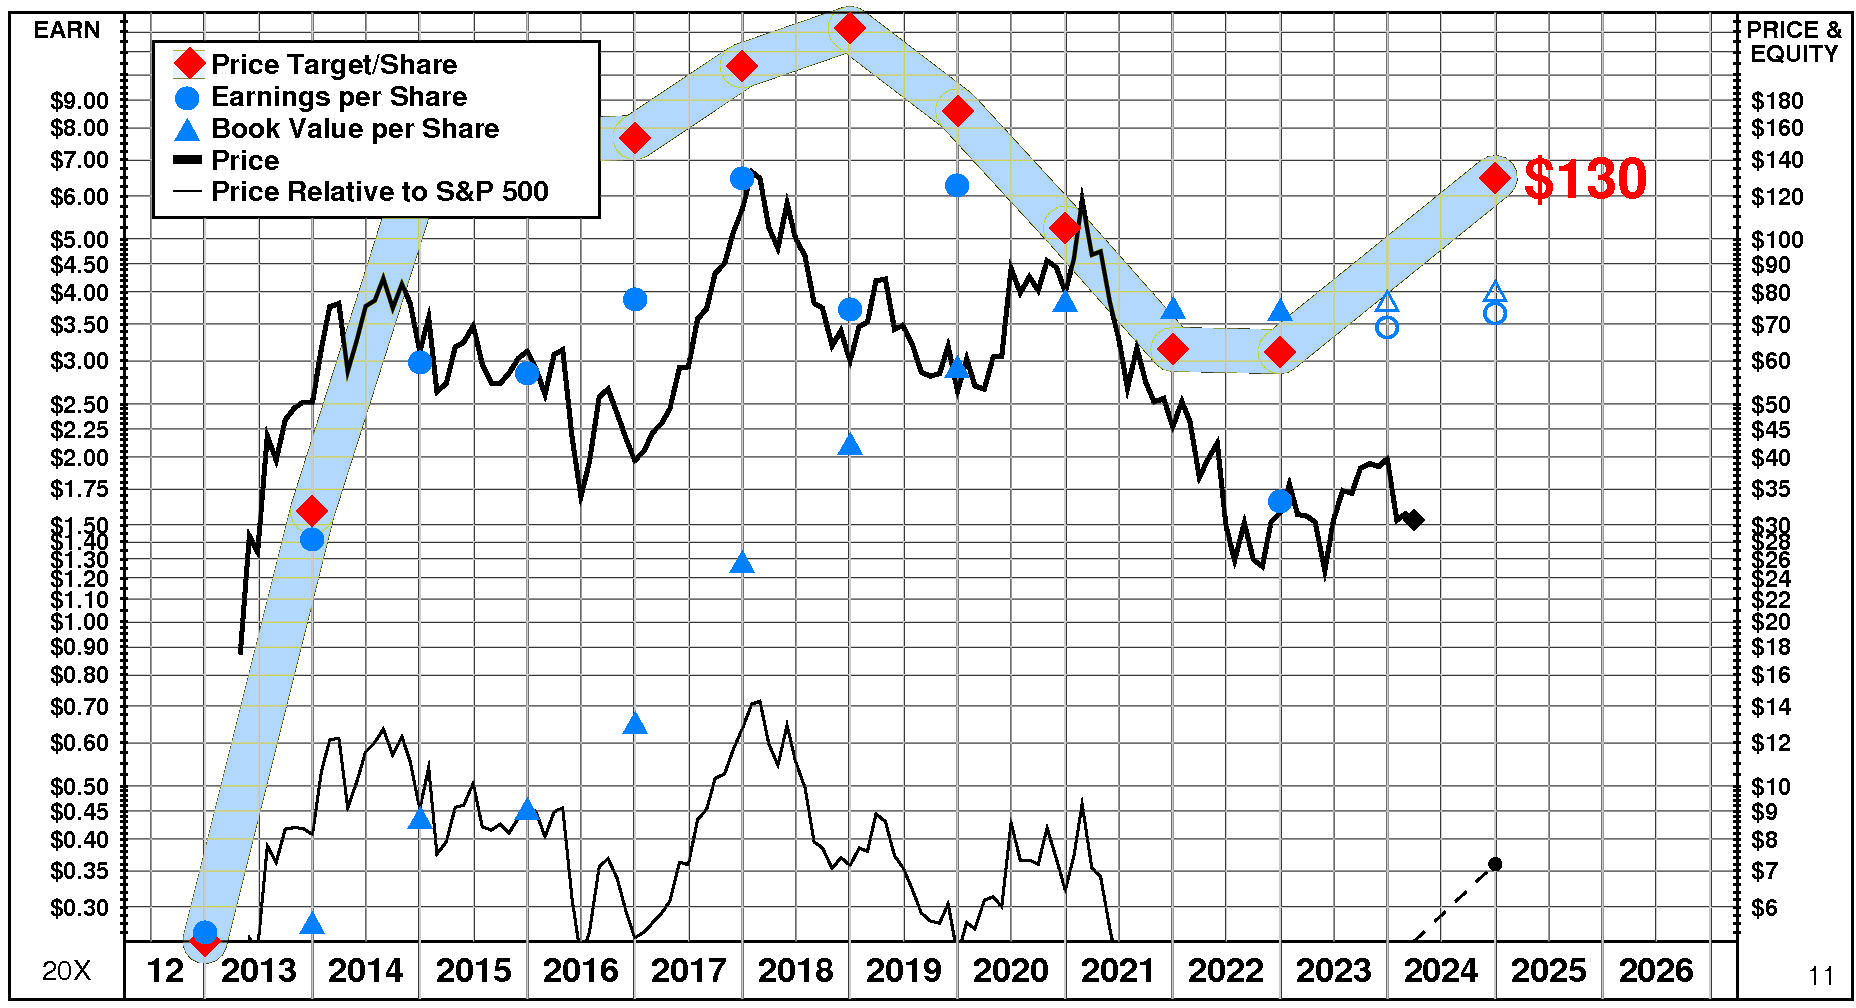
JOYY’s current Price Target is $130 (+108% from the 2022 Target of $62 and +322% from the 03/28/24 price of $30.75). This dramatic rise in the Target is the result of a +9% increase in the equity base and a +91% increase in the price/equity multiple. The forecasted decline in cost of equity has a very large positive impact on the price/equity multiple and the forecasted increase in return on equity has a very large positive impact as well. The forecasted decline in growth has no impact.
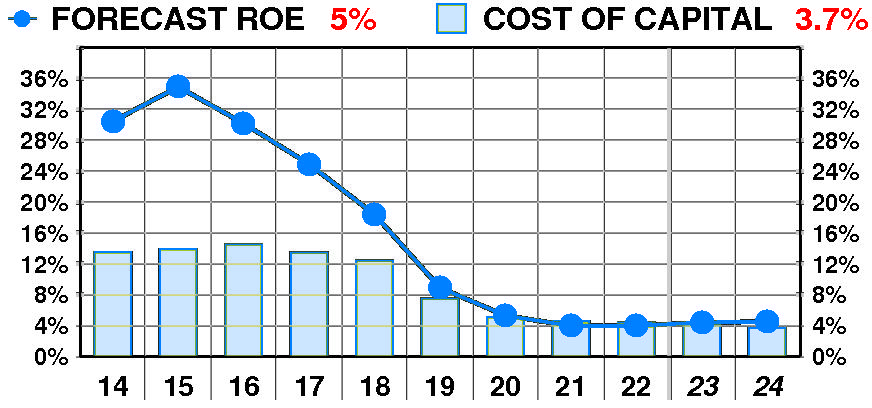
PTR’s return on equity forecast is 4.5% — in line with our recent forecasts. Forecasted return on equity suffered a dramatic, steady decline between 2014 and 2022. The current forecast is significantly below the 2015 peak of 35%.
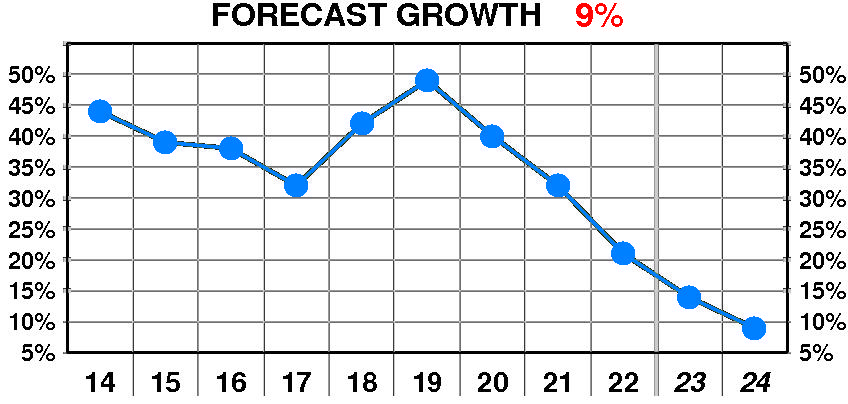
PTR’s growth forecast is 9.0% — significantly below our recent forecasts. Forecasted growth suffered a dramatic, erratic decline between 2014 and 2022. The current forecast is significantly below the 2019 peak of 49%.
PTR’s cost of equity forecast is 3.7% — in line with recent levels. Forecasted cost of equity enjoyed a dramatic, steady decline between 2014 and 2022. The current forecast is significantly below the 2016 peak of 14.5%.
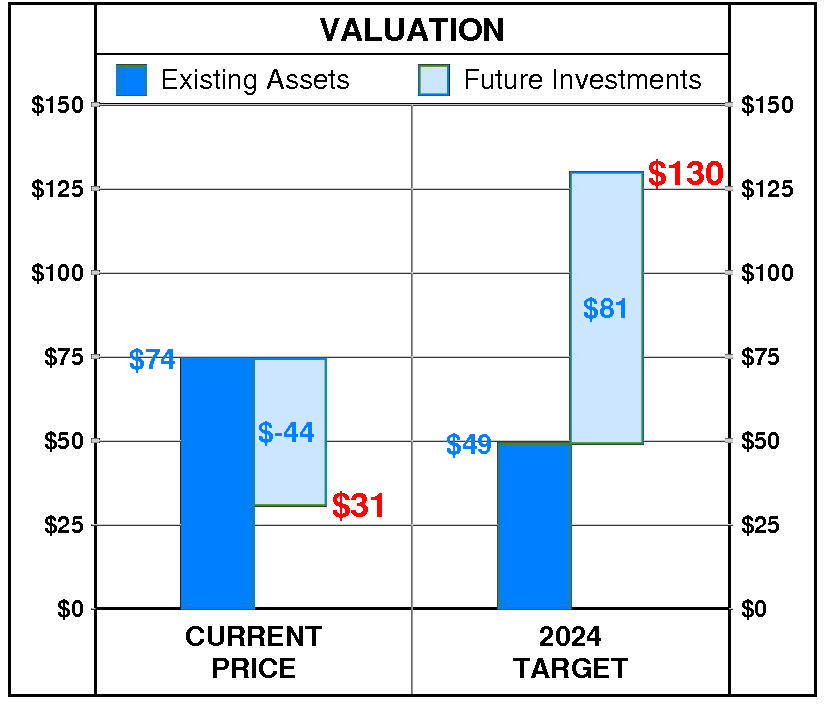
At JOYY’s current price of $30.75, investors are placing a negative value of $-44 on its future investments. This view is consistent with the company’s most recent performance that reflected a growth rate of 21.0% per year, and a return on equity of 4.0% versus a cost of equity of 4.4%.
PTR’s 2024 Price Target of $130 is based on these forecasts and reflects an estimated value of existing assets of $49 and a value of future investments of $81.
Be the first to comment