![]()
BUSINESS
Boyd Gaming Corporation, together with its subsidiaries, operates as a multi-jurisdictional gaming company. It operates through three segments: Las Vegas Locals, Downtown Las Vegas, and Midwest & South. As of December 31, 2021, the company operated 28 gaming entertainment properties located in Nevada, Illinois, Indiana, Iowa, Kansas, Louisiana, Mississippi, Missouri, Ohio, and Pennsylvania. It also engages in owning and operating a travel agency. The company was founded in 1975 and is headquartered in Las Vegas, Nevada.
INVESTMENT RATING
BYD’s future returns on capital are forecasted to exceed the cost of capital. Accordingly, the company is expected to continue to be a major Value Builder.
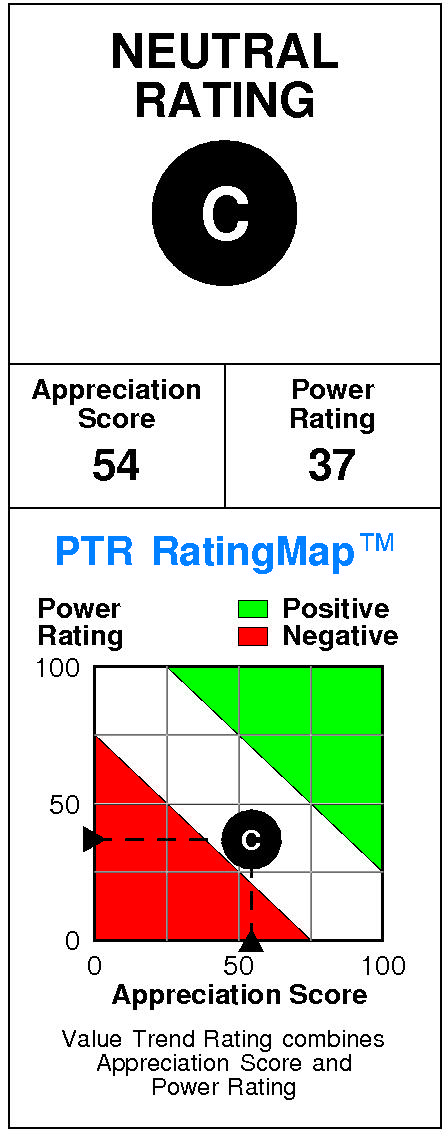
Boyd Gaming has a current Value Trend Rating of C (Low Neutral).
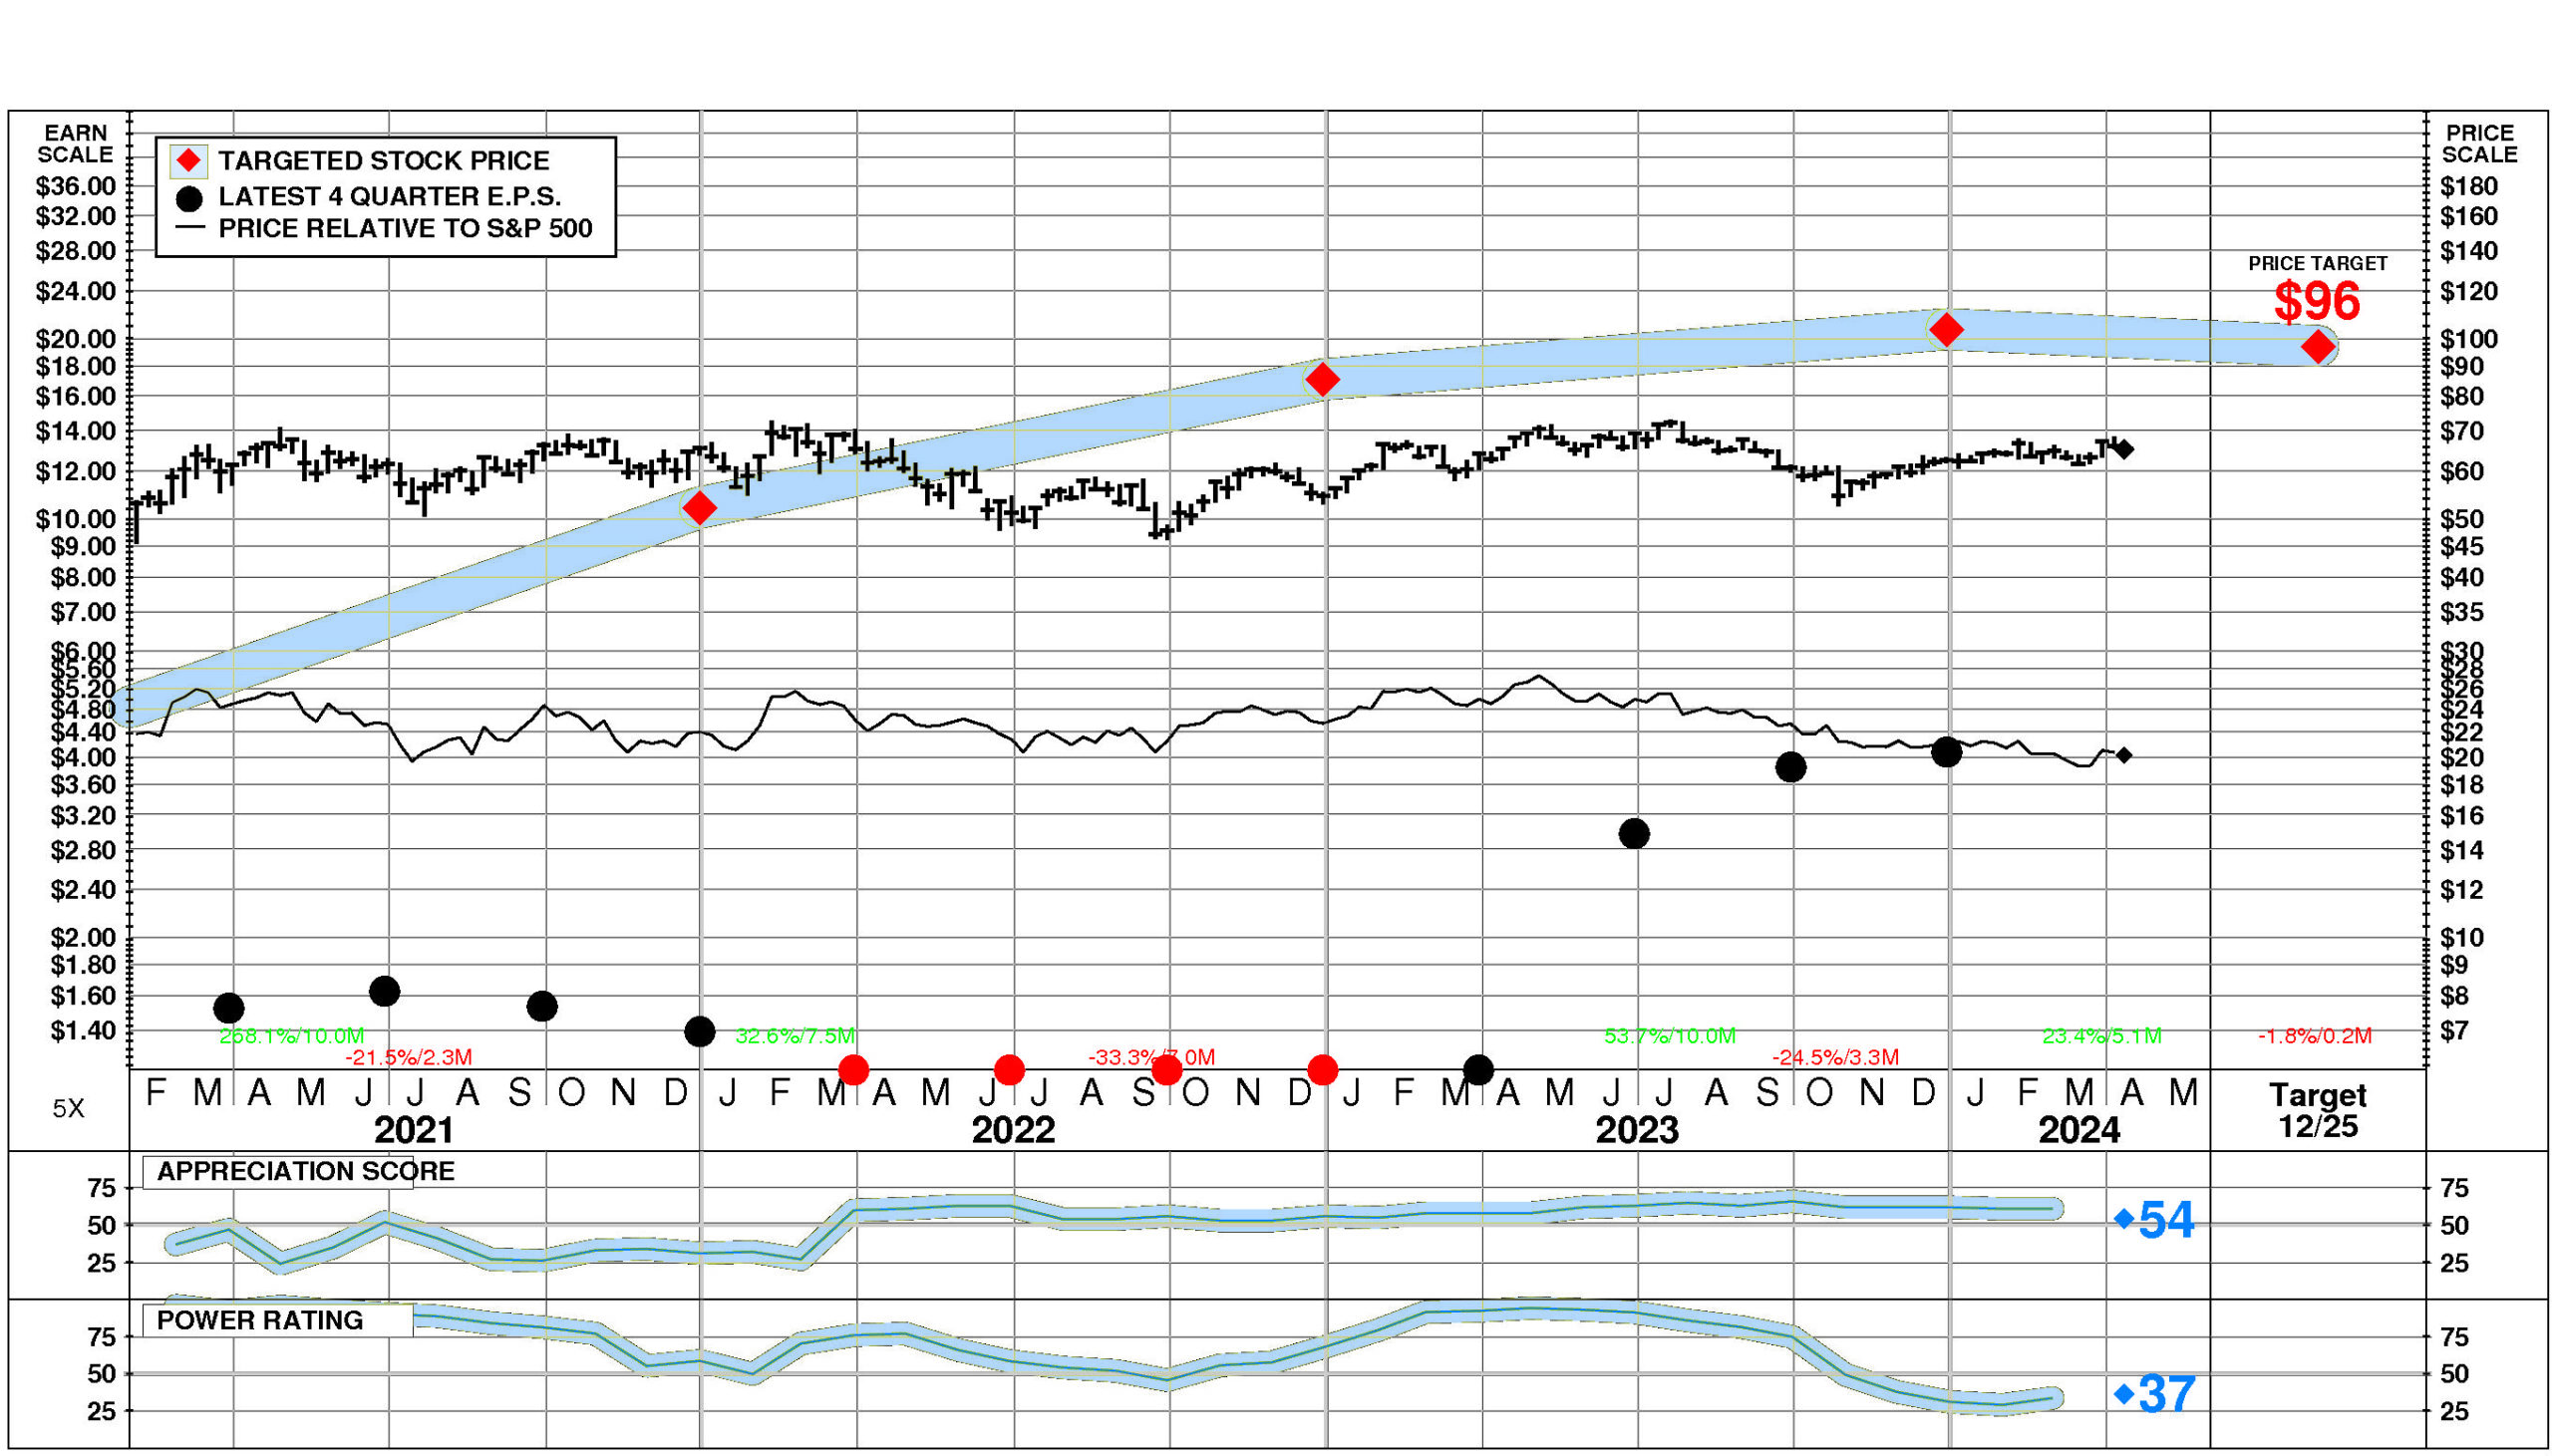
With this rating, PTR’s two proprietary measures of a stock’s current attractiveness are providing consistent signals. Boyd Gaming has a neutral Appreciation Score of 54 and a slightly negative Power Rating of 37, resulting in the Low Neutral Value Trend Rating.
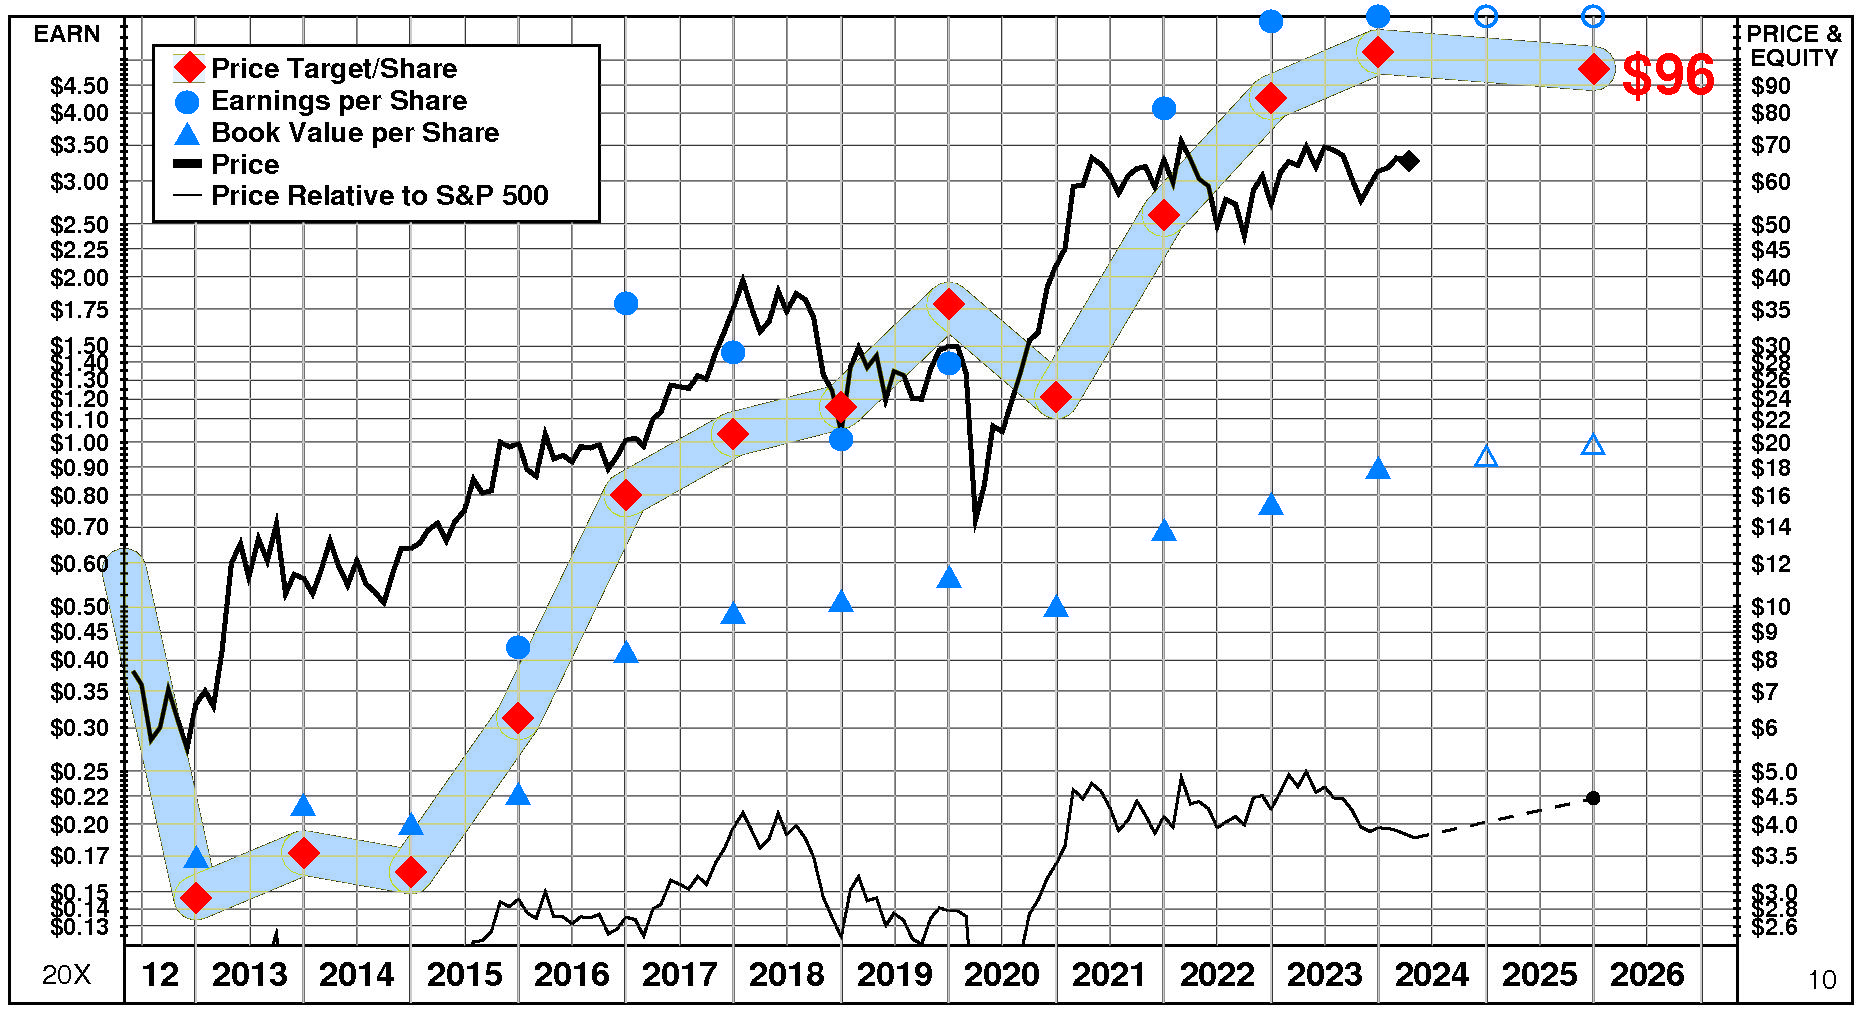
Boyd Gaming’s stock is selling well below targeted value. The current stock price of $65.44 compares to targeted value 12 months forward of $97.
This neutral appreciation potential results in an appreciation score of 54 (46% of the universe has greater appreciation potential.)
Boyd Gaming has a Power Rating of 37. (This slightly negative Power Rating indicates that BYD’s chances of enjoying attractive investment performance over the near to intermediate term are only average.)
Factors contributing to this slightly negative Power Rating include: the Miscellaneous Amusement & Recreational Services comparison group is currently in an unfavorable position; recent price action has been neutral; and earnings estimate behavior for BYD has been slightly negative recently.
INVESTMENT PROFILE
BYD’s financial strength is high. Financial strength rating is 74.
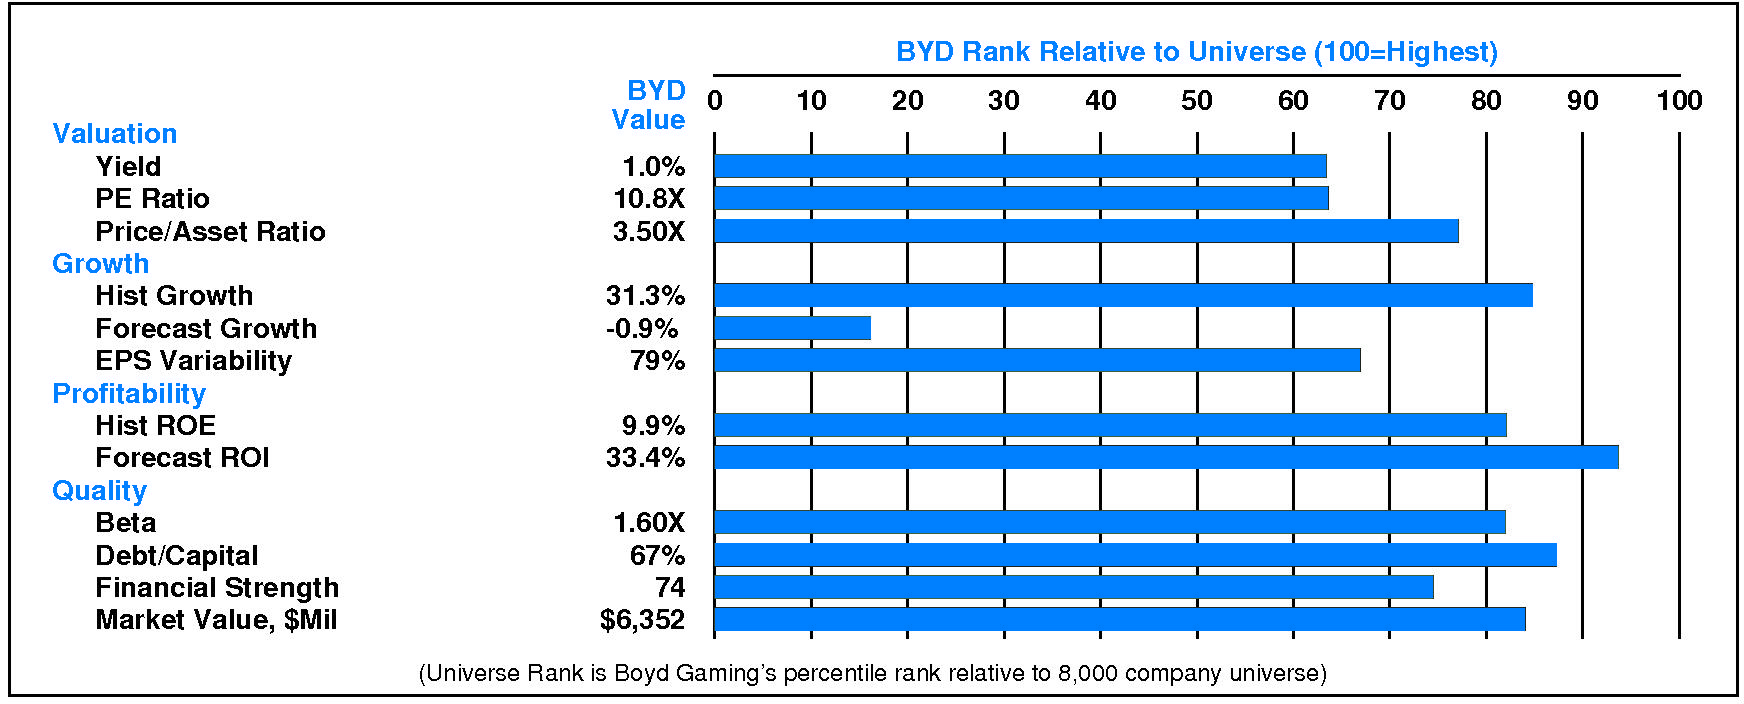
Relative to the S&P 500 Composite, Boyd Gaming Corp has both Growth and Value characteristics; its appeal is likely to be to investors neutral towards Income; the perception is that BYD is higher risk. Relative weaknesses include: high stock price volatility, high financial leverage, low expected growth, and high earnings variability. BYD’s valuation is moderate: moderate dividend yield, low P/E ratio, and moderate price/book ratio. BYD has unusually low market capitalization.
CURRENT SIGNALS
Boyd Gaming’s current operations are strong. Return on equity is rising, reflecting: improving asset utilization; widening pretax margins; rising tax keep rate; and rising leverage.
Boyd Gaming’s current technical position is mixed. The stock price is in a 5.1 month up move. The stock has appreciated 23.4% from its prior low. The 200 day moving average is in a downtrend. The stock price is above its 200 day moving average.
ALERTS
Boyd Gaming Corp (NYSE: BYD) has recently enjoyed small positive changes in fundamentals: significant quarterly earnings acceleration occurred.
The stock is currently rated C.
On 4/11/24, Boyd Gaming Corp (NYSE: BYD) stock rose modestly by 0.6%, closing at $65.44. Trading volume in this advance was normal. The stock has performed in line with the market over the last nine months and has declined -2.1% during the last week.
CASH FLOW
In 2023, Boyd Gaming generated an increase in cash of +$13 million (+4%). Sources of cash were very slightly larger than uses. Cash generated from 2023 EBITDA totaled +$1,263 million. Non-operating uses consumed -$79 million (-6% of EBITDA). Cash taxes consumed -$163 million (-13% of EBITDA). Re-investment in the business amounted to -$197 million (-16% of EBITDA). On a net basis, debt investors received -$345 million (-27% of EBITDA) while equity investors removed -$467 million (-37% of EBITDA).
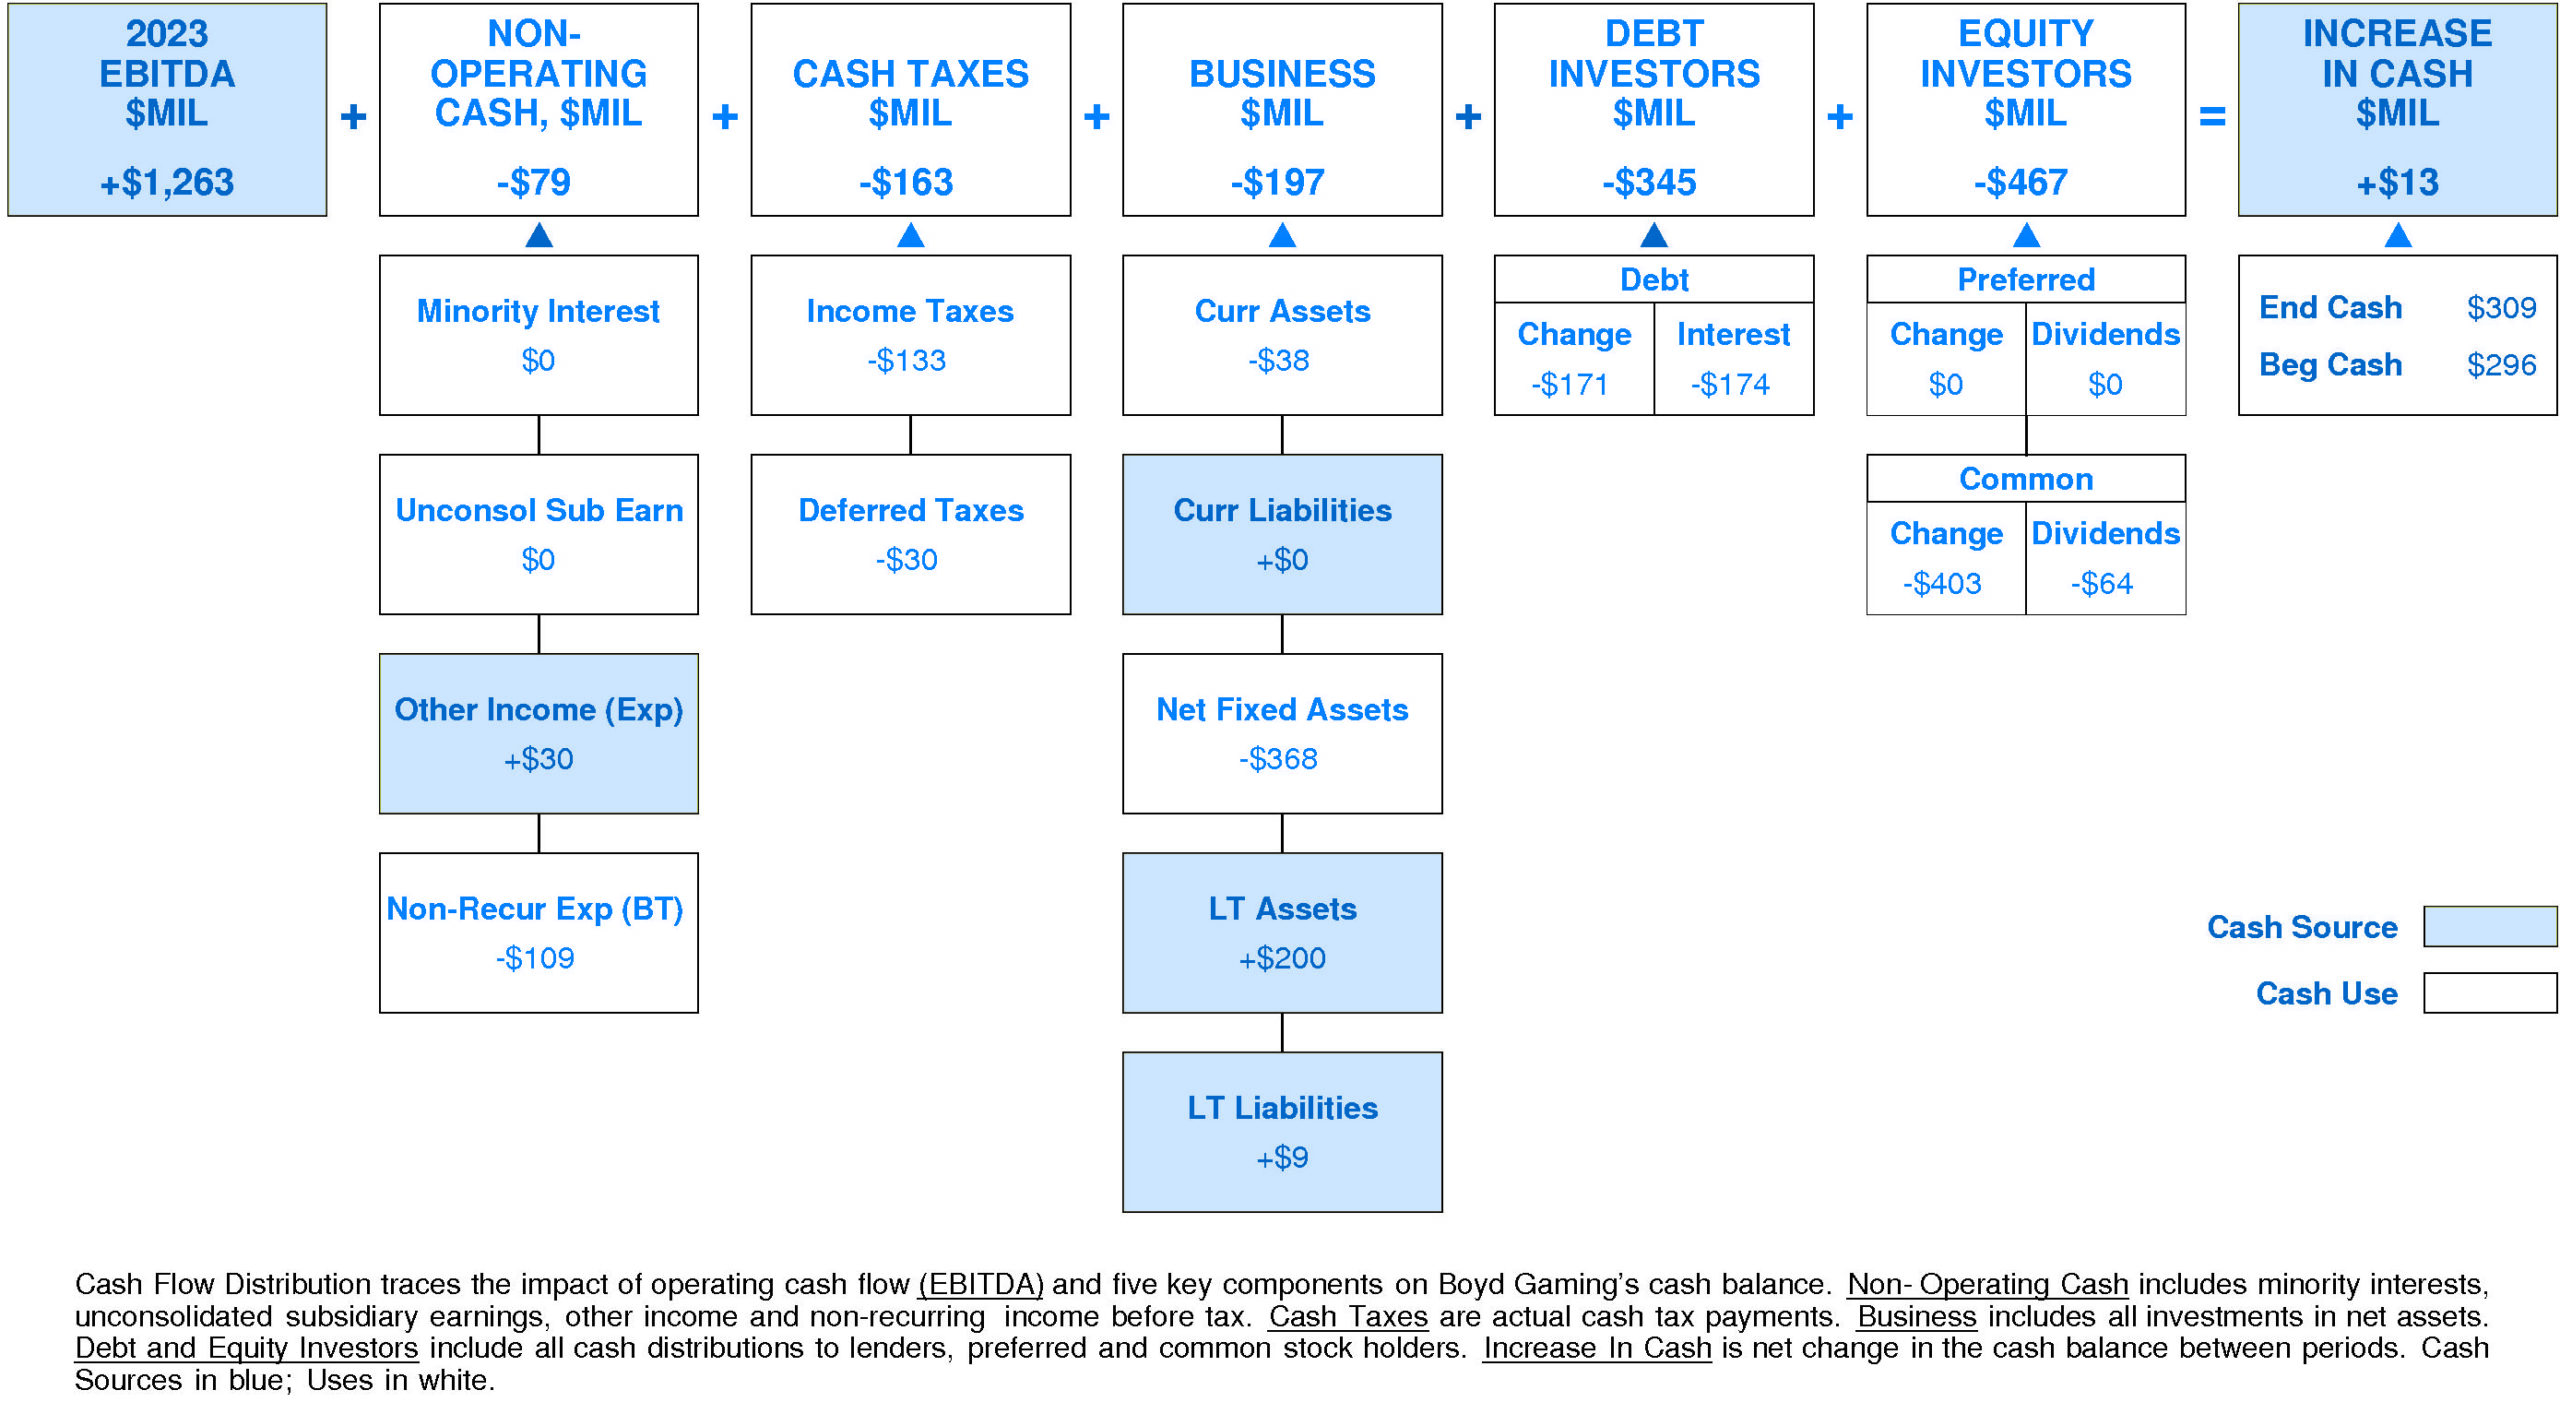
Boyd Gaming’s Non-operating Income, %EBITDA has exhibited little to no overall change over the period. This stability was accompanied by an uptrend for the Boyd Gaming Peer Group. In most years, Boyd Gaming was in the third quartile and second quartile. Currently, Boyd Gaming is at median at -6% of EBITDA (-$79 million).
Boyd Gaming’s Cash Taxes, %EBITDA has experienced a minor downtrend over the period. This downtrend was accompanied by stability for the Boyd Gaming Peer Group. (Since 2020 Cash Taxes, %EBITDA has acccelerated.) In most years, Boyd Gaming was in the top quartile and second quartile. Currently, Boyd Gaming is below median at -13% of EBITDA (-$163 million).
Boyd Gaming’s Business Re-investment, %EBITDA has suffered a volatile overall downtrend over the period. This downtrend was accompanied by stability for the Boyd Gaming Peer Group. In most years, Boyd Gaming was in the top quartile and lower quartile. Currently, Boyd Gaming is below median at -16% of EBITDA (-$197 million).
Boyd Gaming’s Debt Investors, %EBITDA has experienced a volatile overall uptrend over the period. This improvement was accompanied by a similar trend for the Boyd Gaming Peer Group. In most years, Boyd Gaming was in the lower quartile and top quartile. Currently, Boyd Gaming is slightly above median at -27% of EBITDA (-$345 million).
Boyd Gaming’s Equity Investors, %EBITDA has suffered a very strong overall downtrend over the period. This downtrend was accompanied by a similar trend for the Boyd Gaming Peer Group. In most years, Boyd Gaming was in the second quartile and top quartile. Currently, Boyd Gaming is substantially below median at -37% of EBITDA (-$467 million).
Boyd Gaming’s Change in Cash, %EBITDA has exhibited little to no overall change over the period. This stability was accompanied by an uptrend for the Boyd Gaming Peer Group. (Since 2021 Change in Cash, %EBITDA has experienced very sharp improvement.) In most years, Boyd Gaming was in the second quartile and top quartile. Currently, Boyd Gaming is above median at +1% of EBITDA (+$13 million).
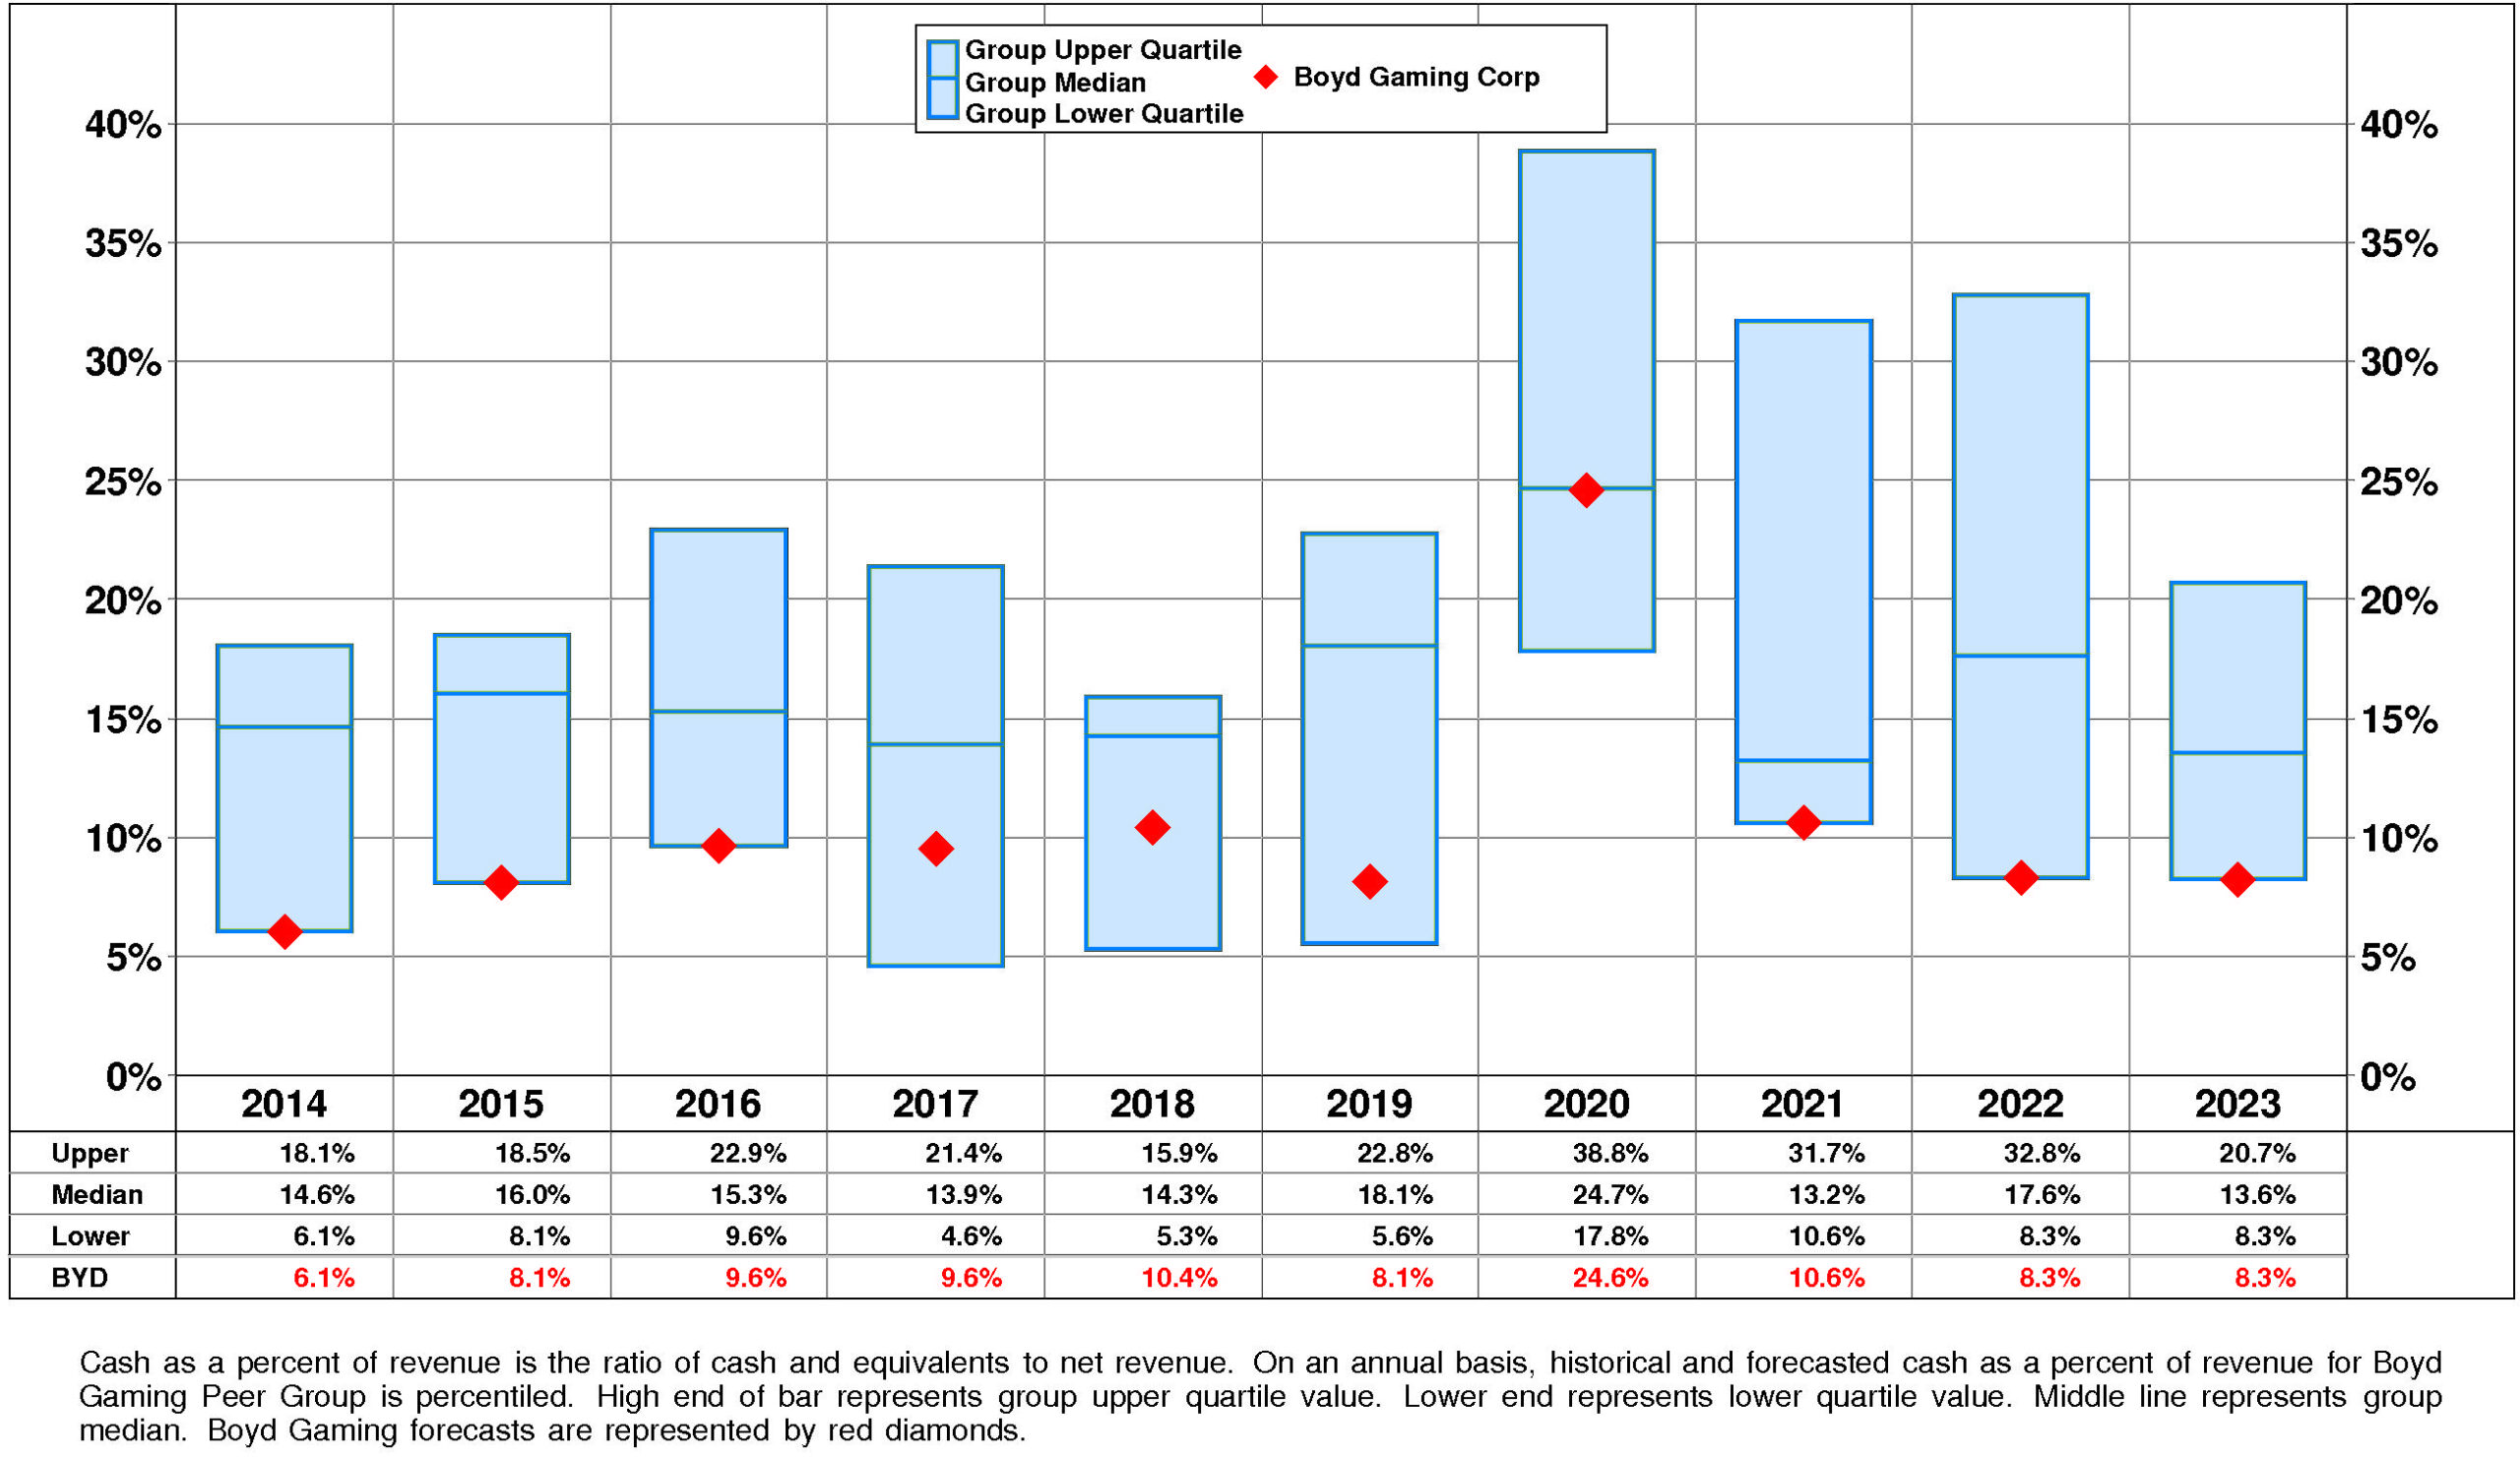
Boyd Gaming’s Cash, %Revenue has exhibited little to no overall change over the period. This stability was accompanied by stability for the Boyd Gaming Peer Group as well. (Since 2020 Cash, %Revenue has experienced a very sharp decline.) In most years, Boyd Gaming was in the third quartile. Currently, Boyd Gaming is at the lower quartile at +8%.
PROFITABILITY
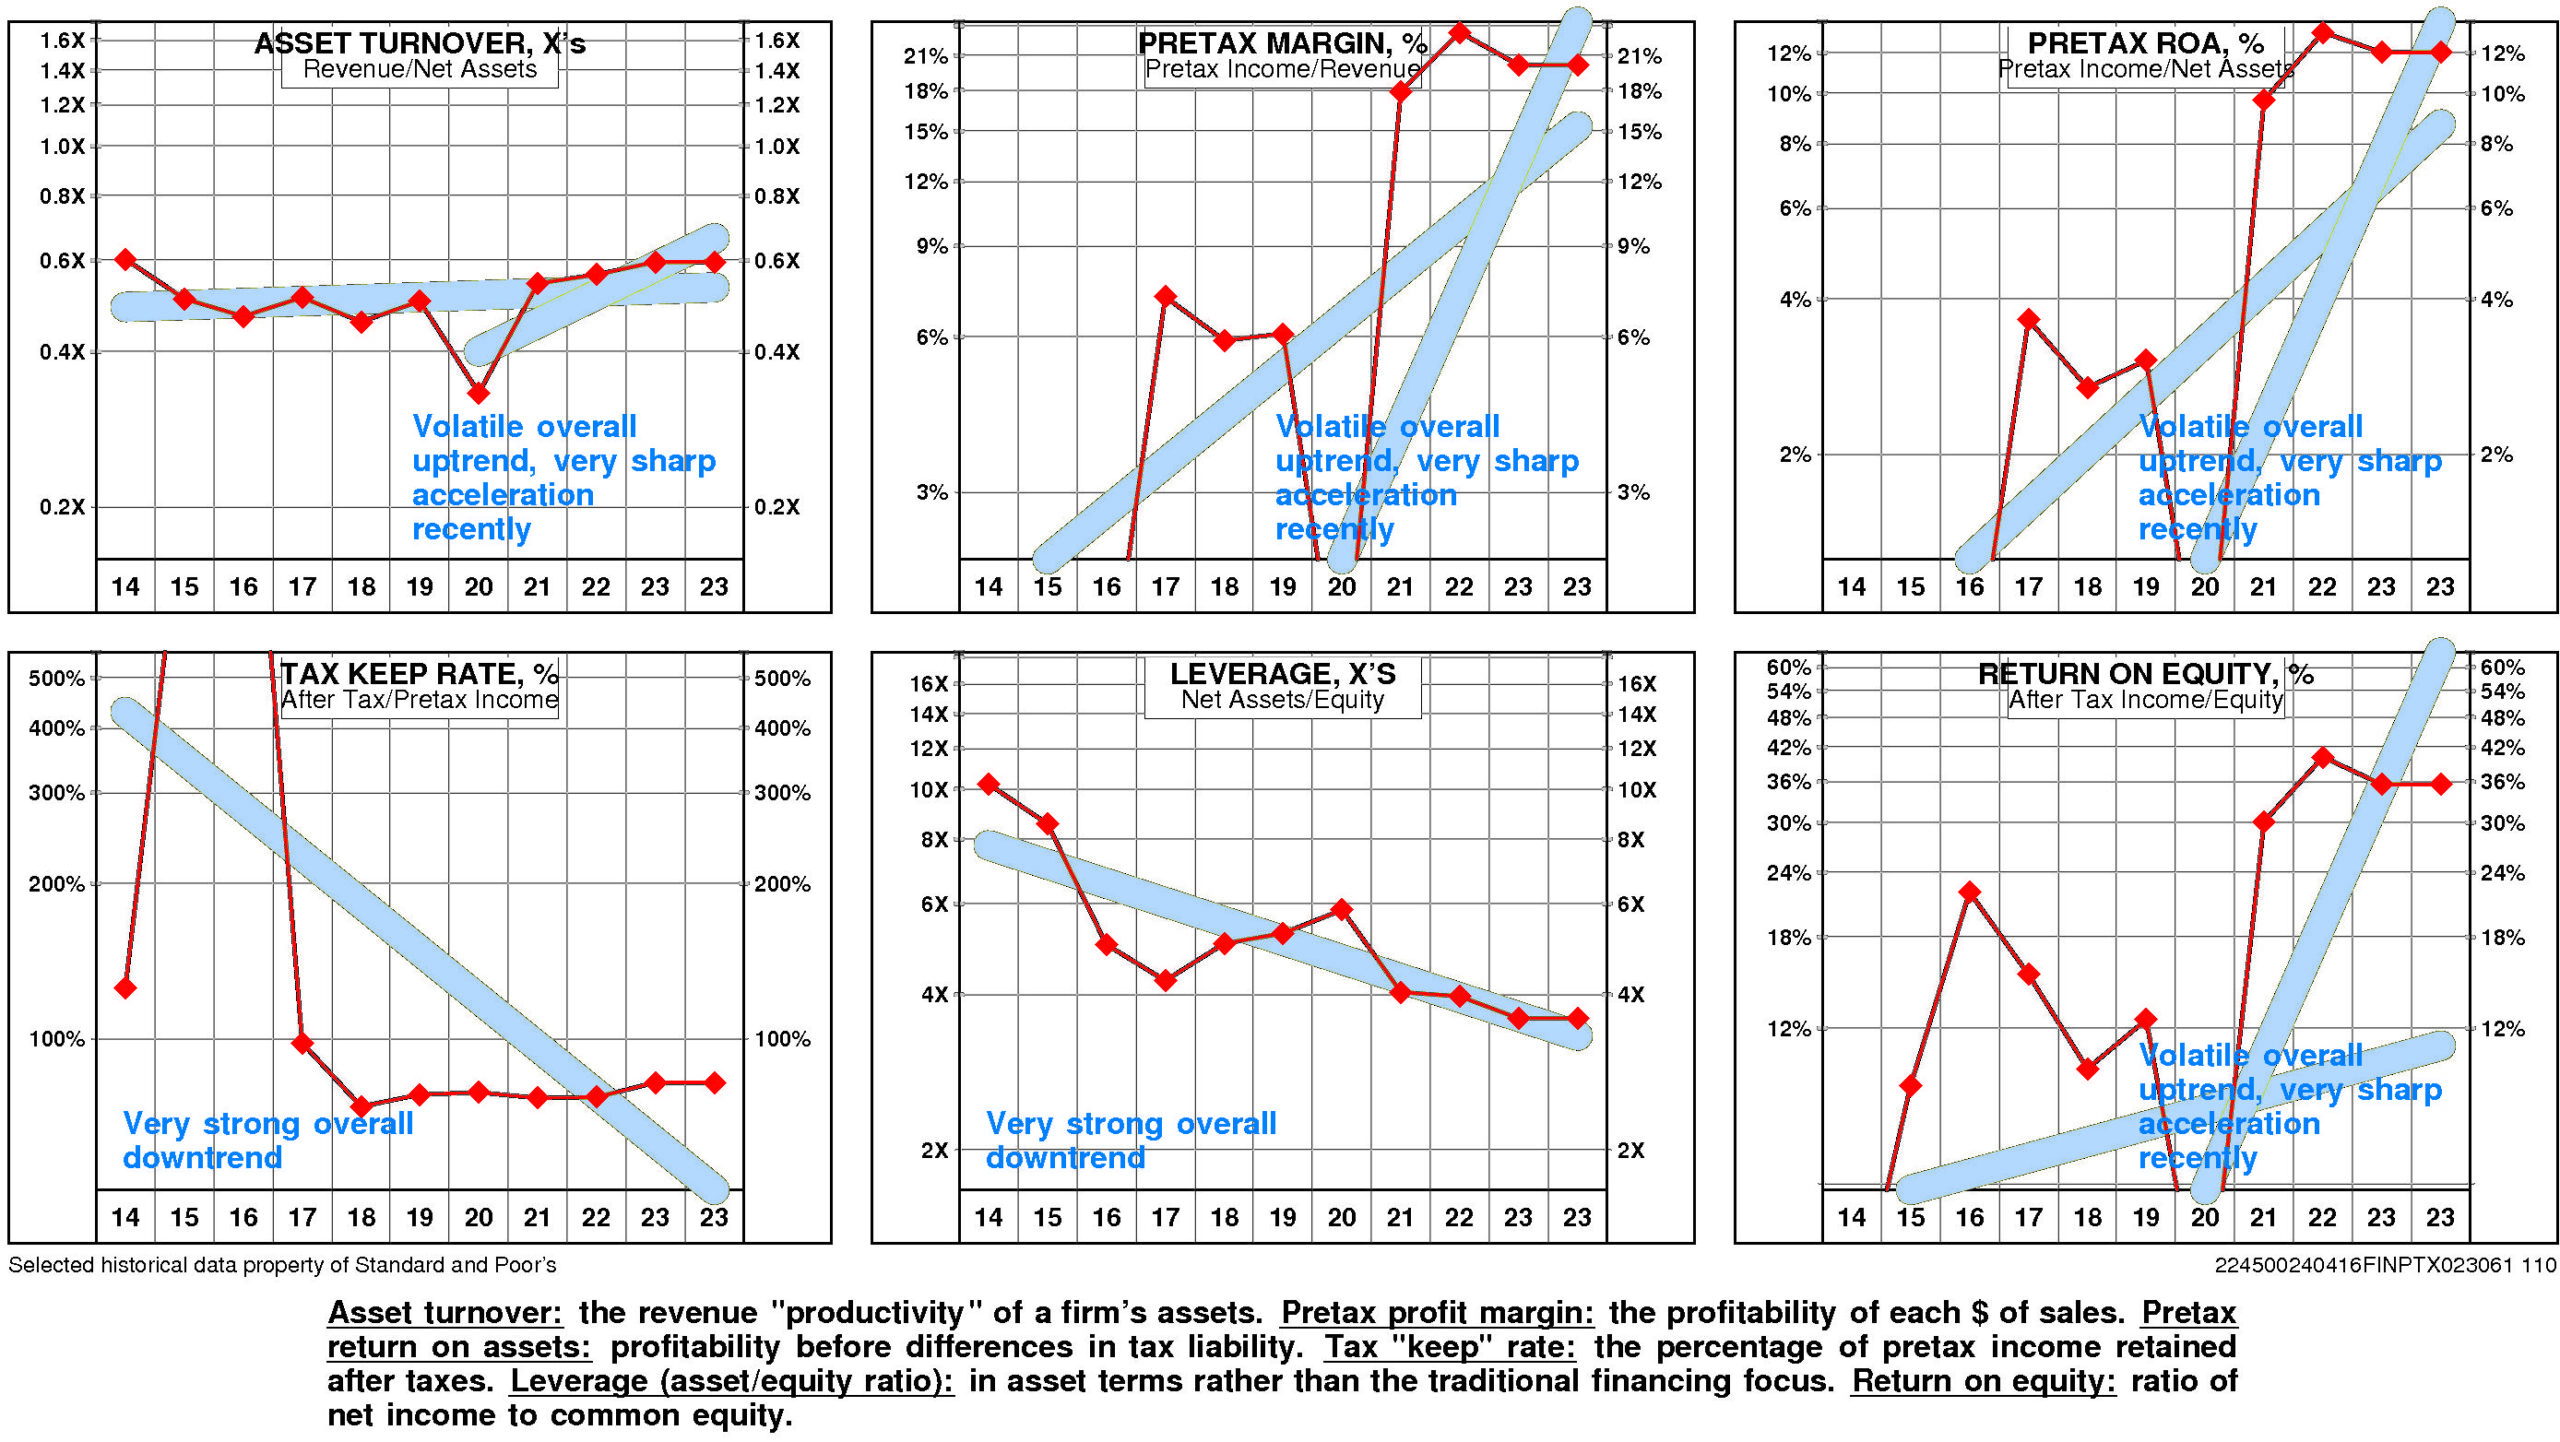
Boyd Gaming’s return on equity has improved very significantly since 2015. The current level is 35.5% versus the high of 9.3% and the low of -12.0%.
The key to the story for BYD is a very strong positive trend in pretax operating return significantly offset by a very strong negative trend in non-operating factors.
The productivity of Boyd Gaming’s assets rose over the full period 2014-2023: asset turnover has exhibited a volatile overall uptrend that accelerated very sharply after the 2020 level.
Reinforcing this trend, pretax margin enjoyed a volatile overall uptrend that accelerated very sharply from the 2020 level.
Non-operating factors (income taxes and financial leverage) had a significant negative influence on return on equity.
Boyd Gaming’s return on equity is upper quartile (35.5%) for the four quarters ended December, 2023.
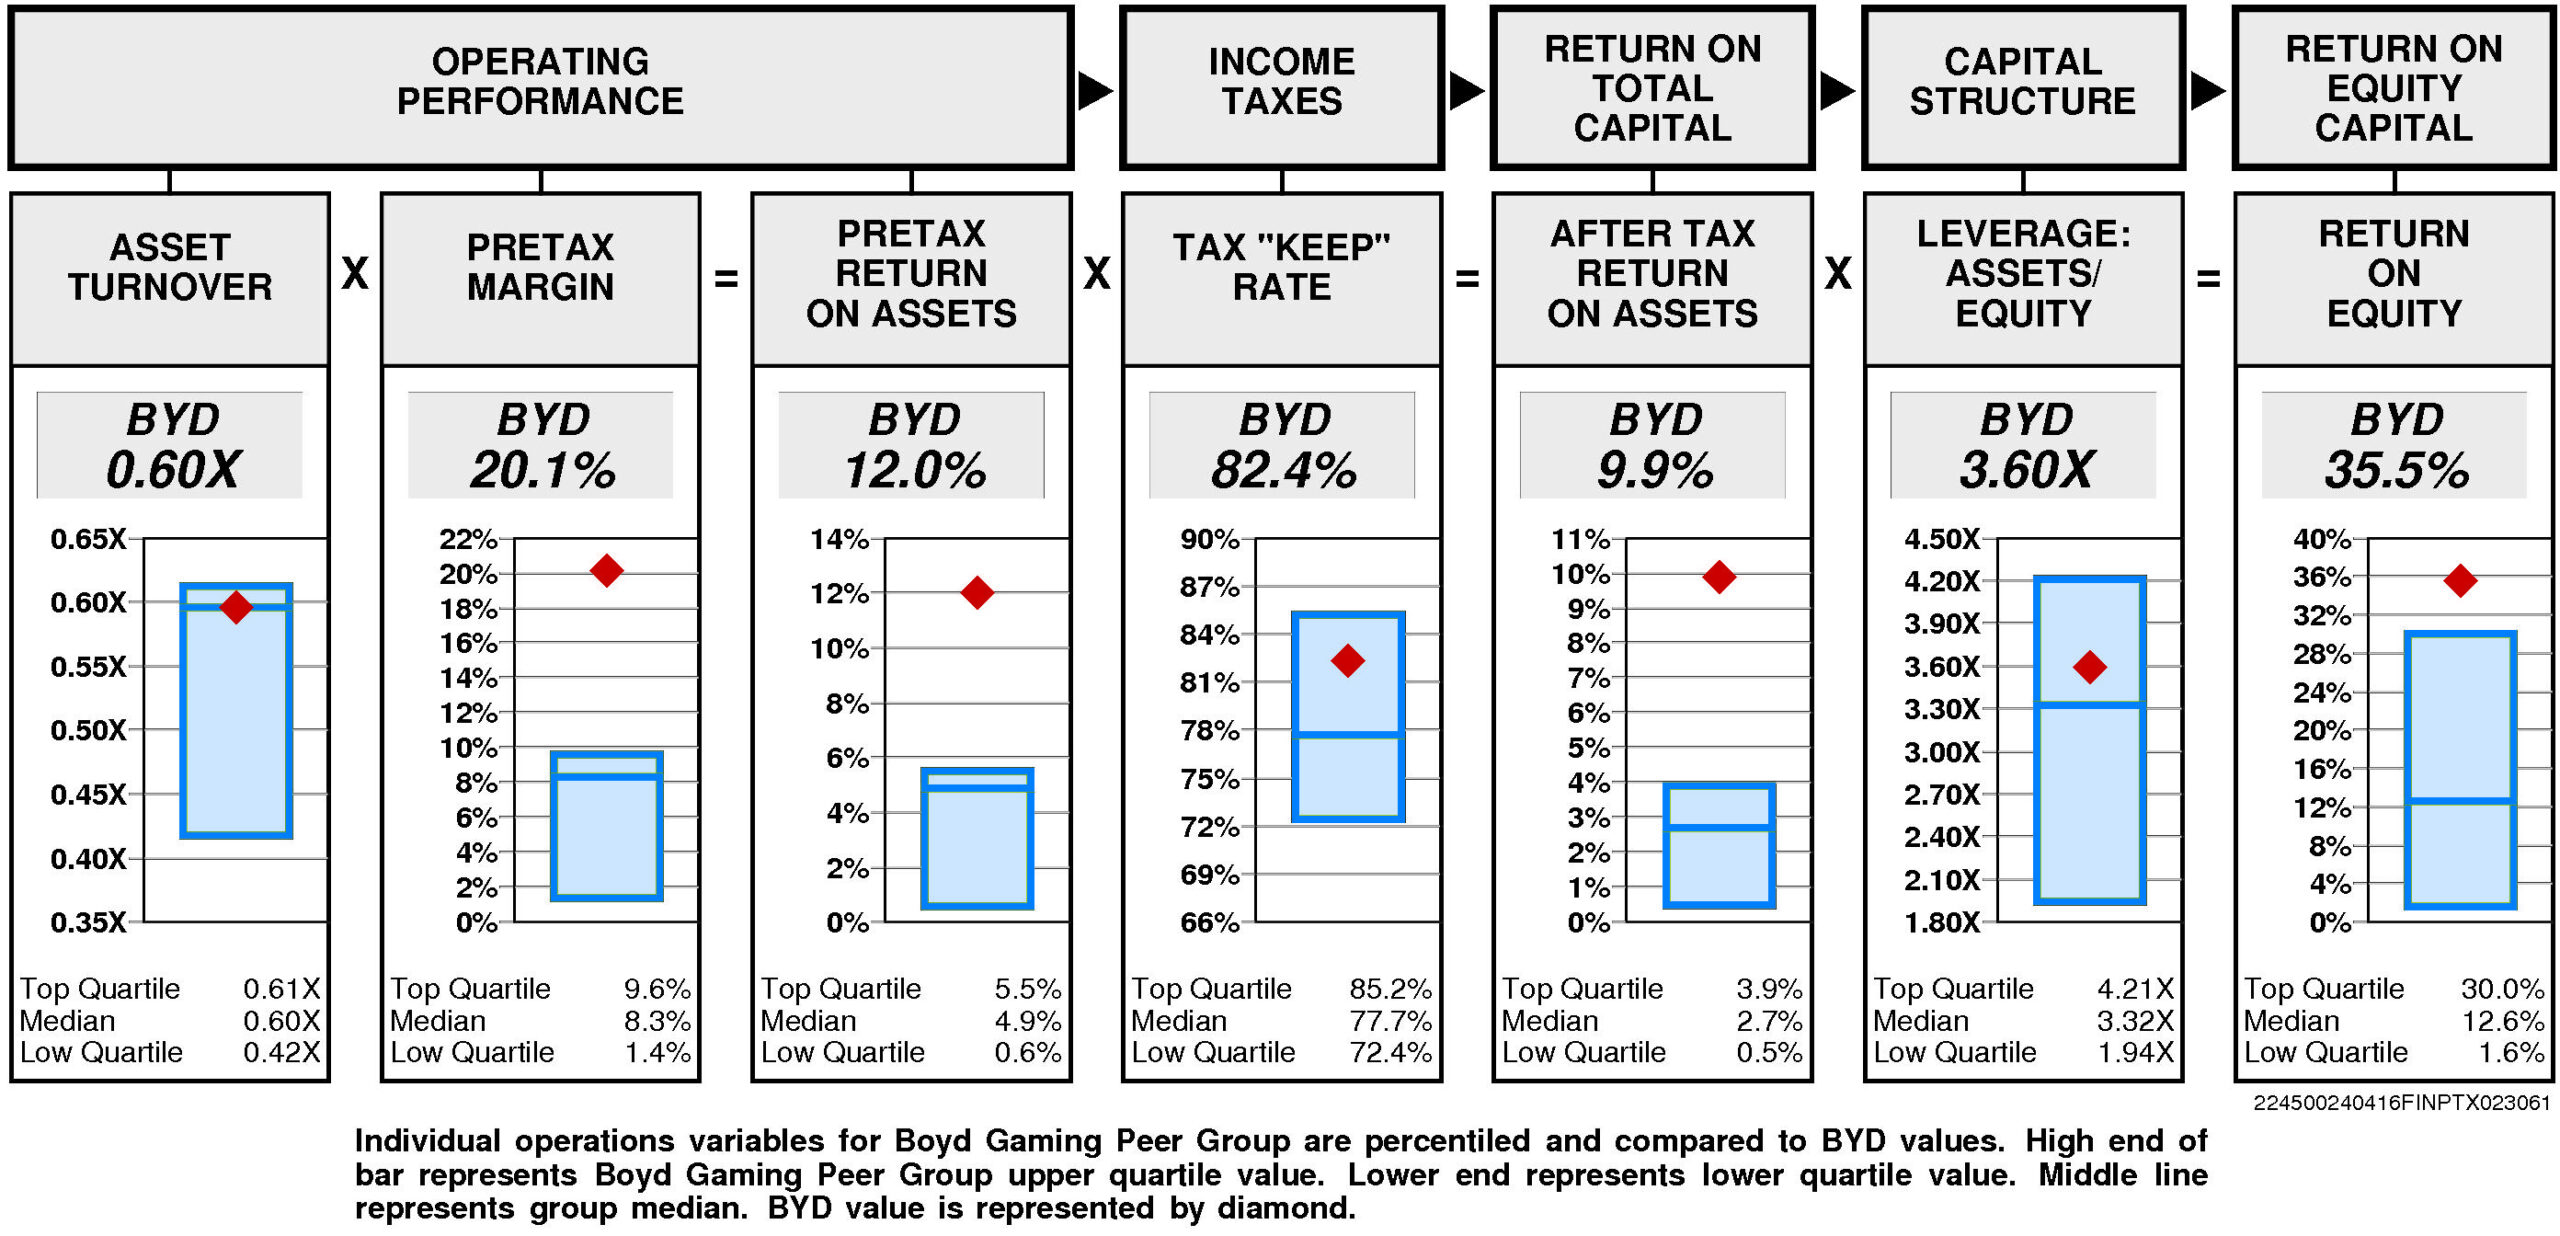
Operating performance (pretax return on assets) is upper quartile (12.0%) reflecting asset turnover that is at median (0.60X) and upper quartile pretax margin (20.1%).
Tax “keep” rate (income tax management) is above median (82.4%) resulting in after tax return on assets that is upper quartile.
Financial leverage (leverage) is above median (3.60X).
GROWTH RATES
There are no significant differences between Boyd Gaming’s longer term growth and growth in recent years.
Boyd Gaming’s historical income statement growth and balance sheet growth have diverged. Revenue growth has paralleled asset growth; earnings growth has exceeded equity growth.
Annual revenue growth has been 6.0% per year.
Total asset growth has been 5.1% per year.
Annual E.P.S. growth has been 31.2% per year.
Equity growth has been 14.4% per year.
Boyd Gaming’s consensus growth rate forecast (average of Wall Street analysts) is -0.8% — substantially below the average of the historical growth measures.
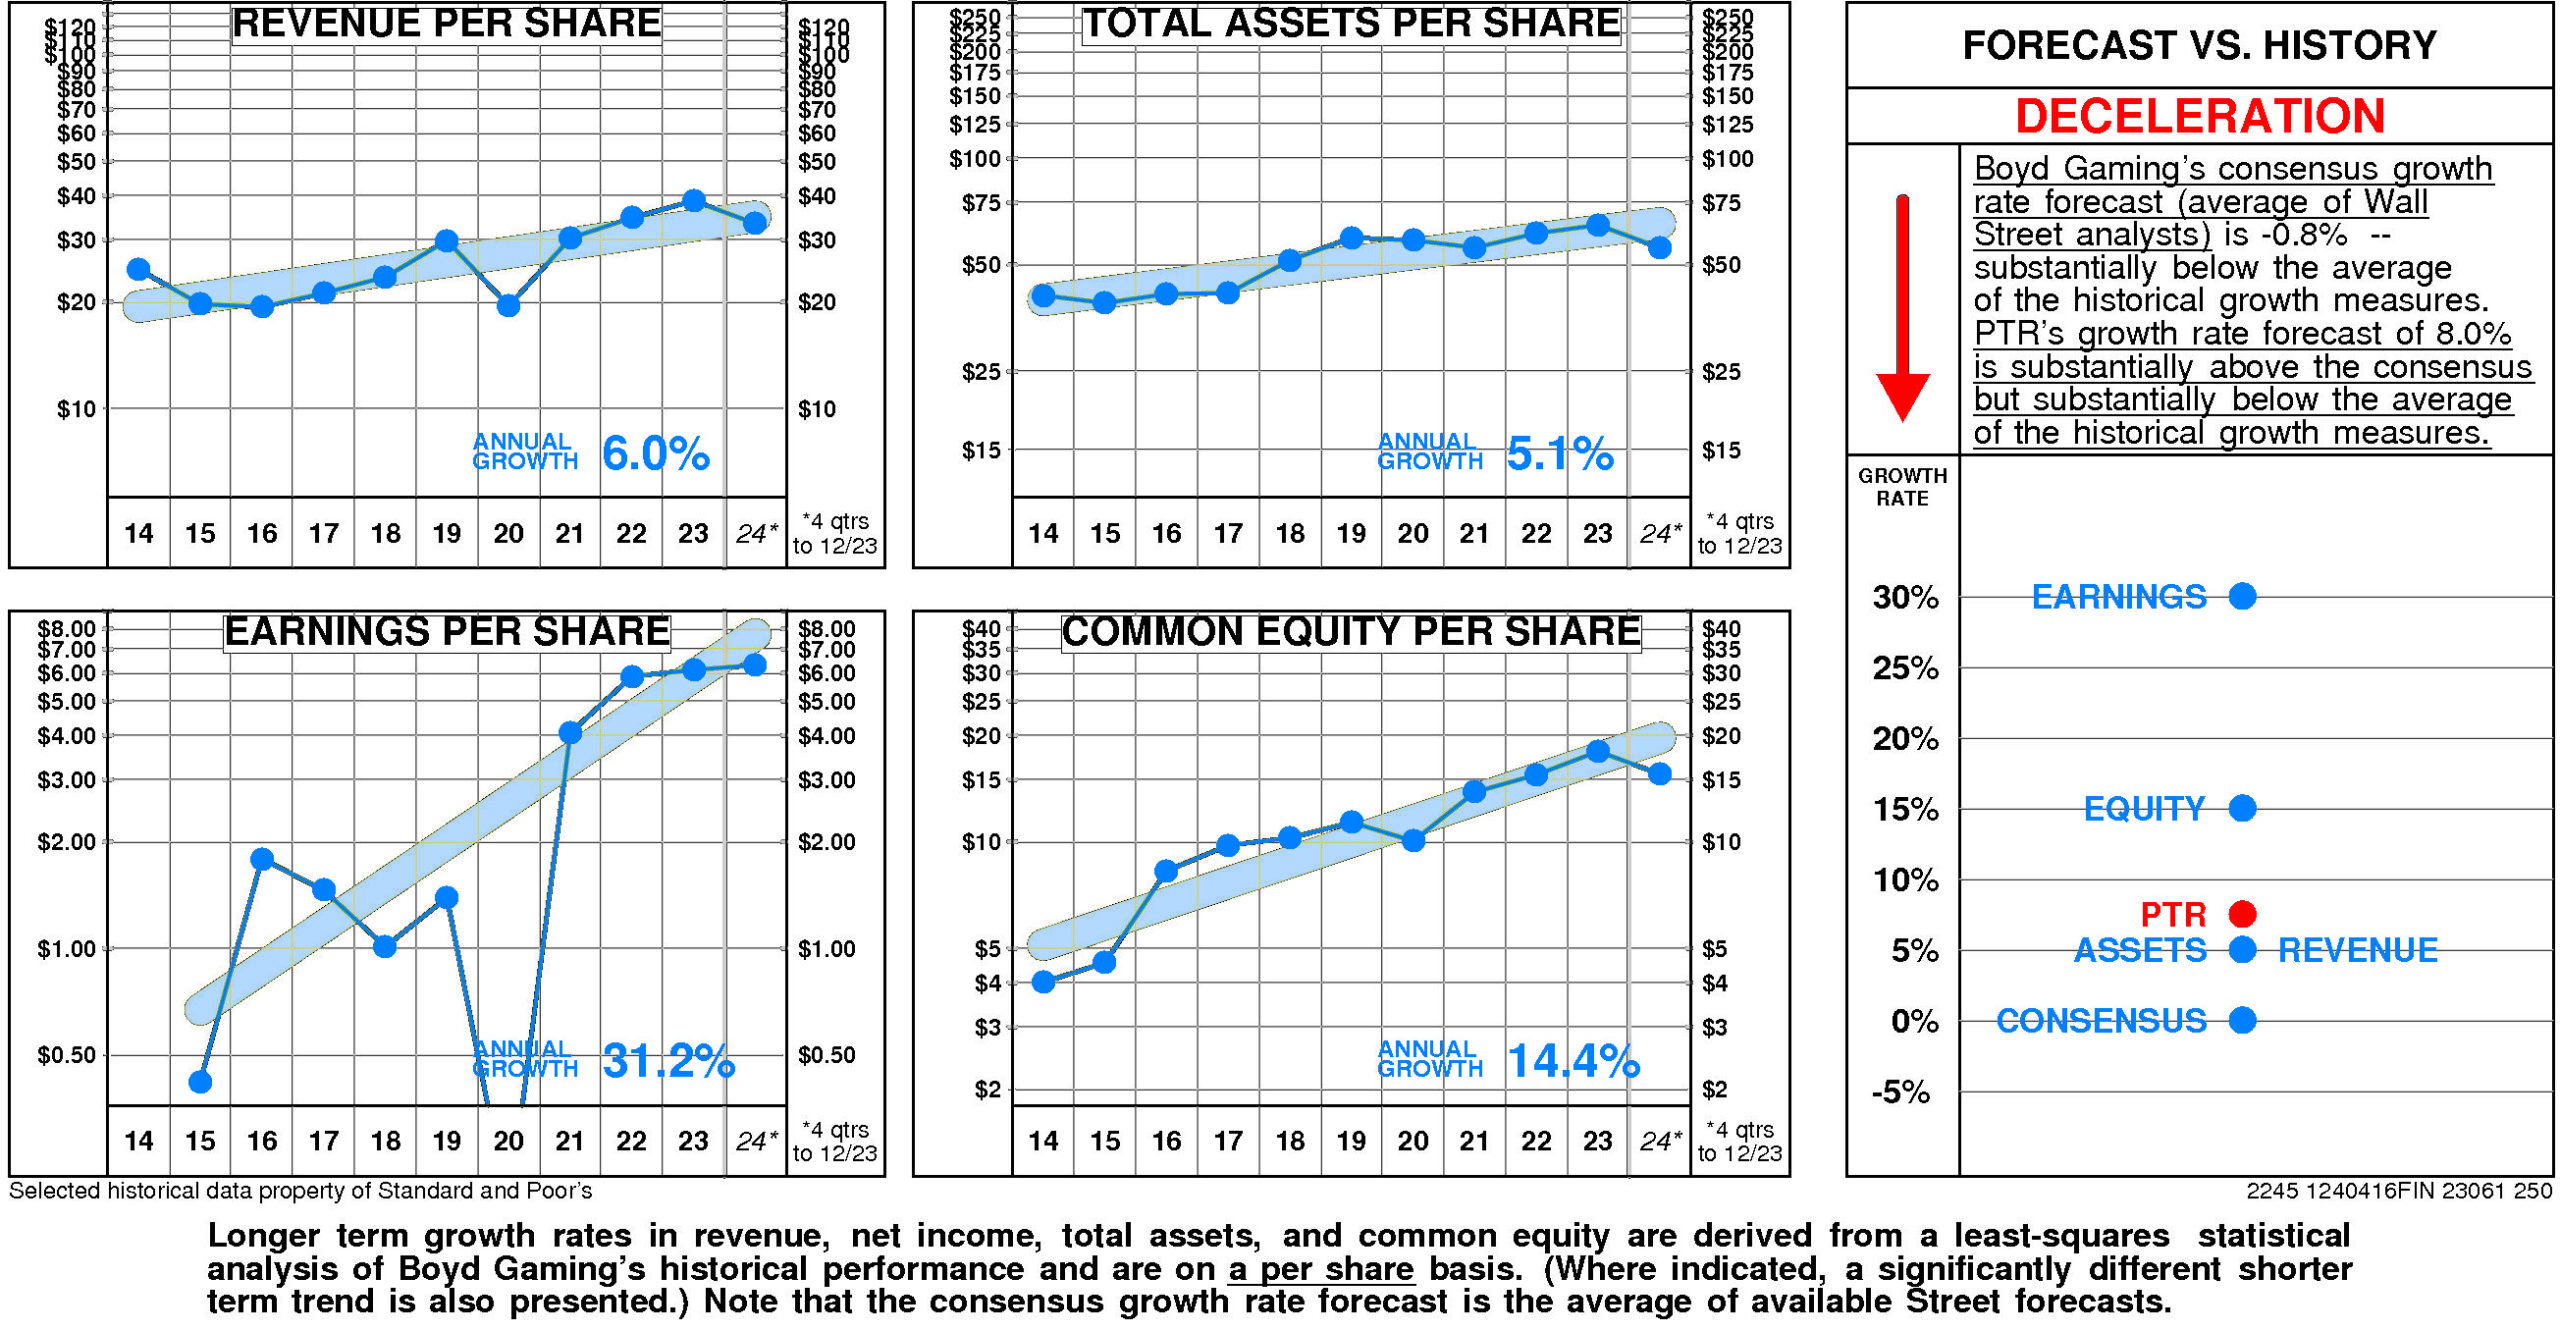
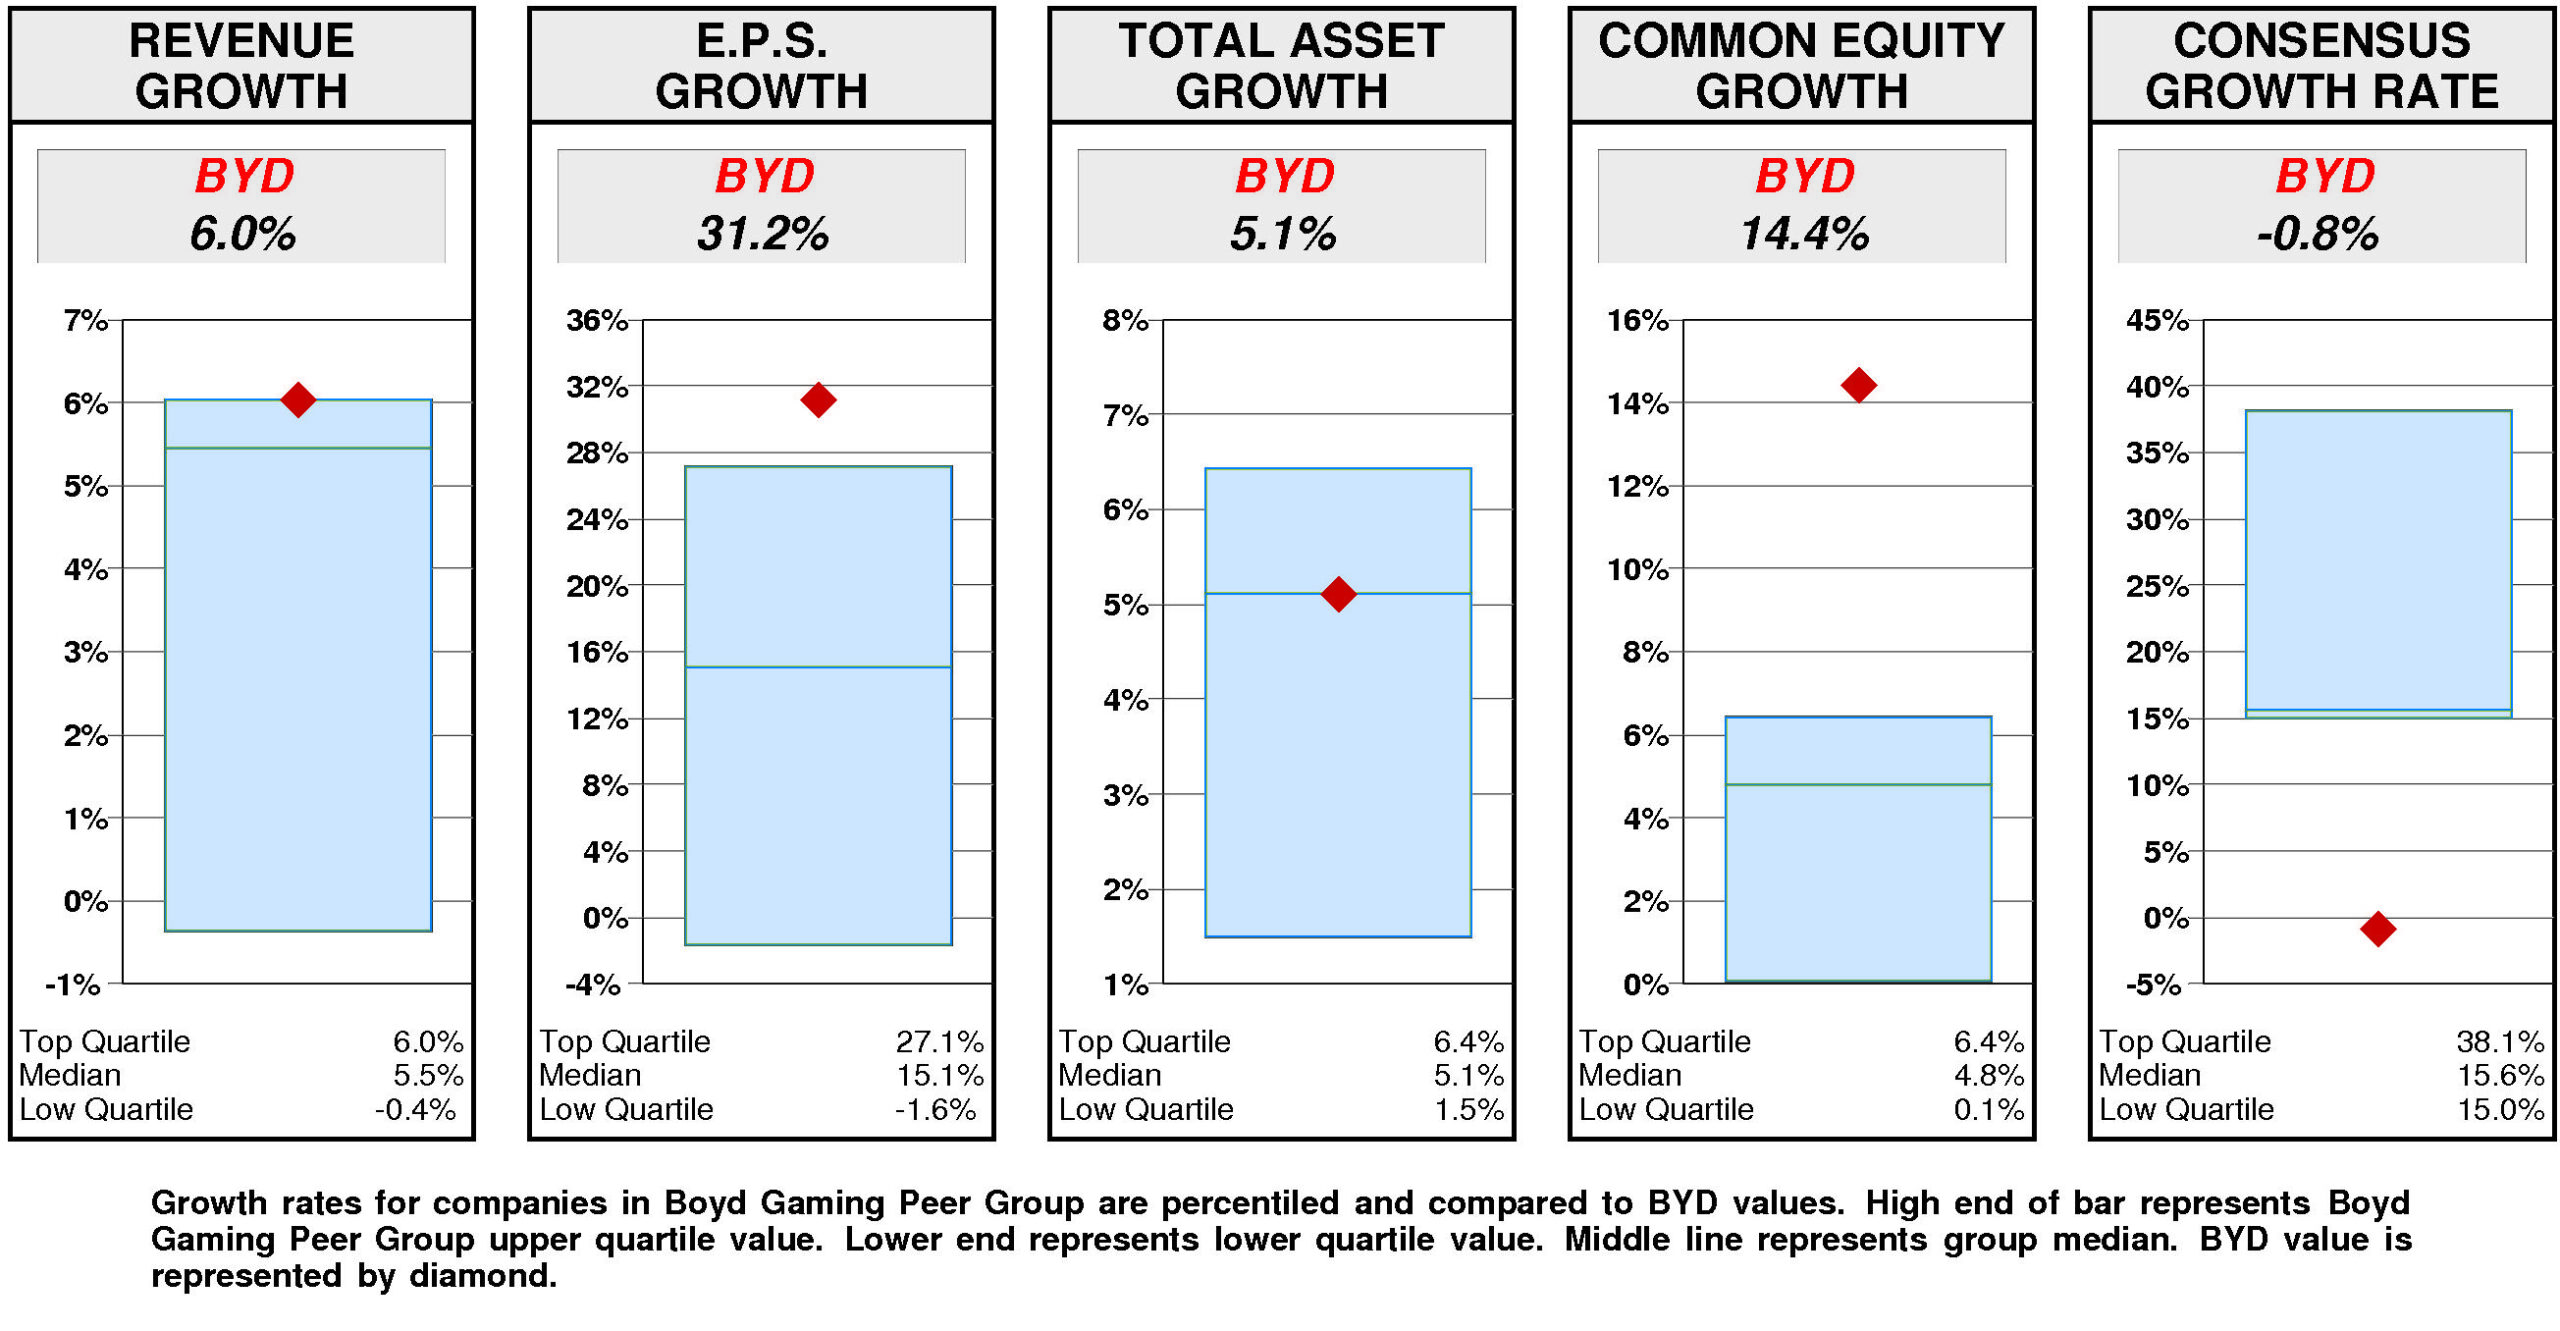
Relative to the Boyd Gaming Peer Group, Boyd Gaming’s historical growth measures are generally top quartile. E.P.S. growth (31.2%) has been upper quartile. Equity growth (14.4%) has been upper quartile. Revenue growth (6.0%) has been at the upper quartile. Total asset growth (5.1%) has been at median.
In total contrast, consensus growth forecast (-0.8%) is lower quartile.
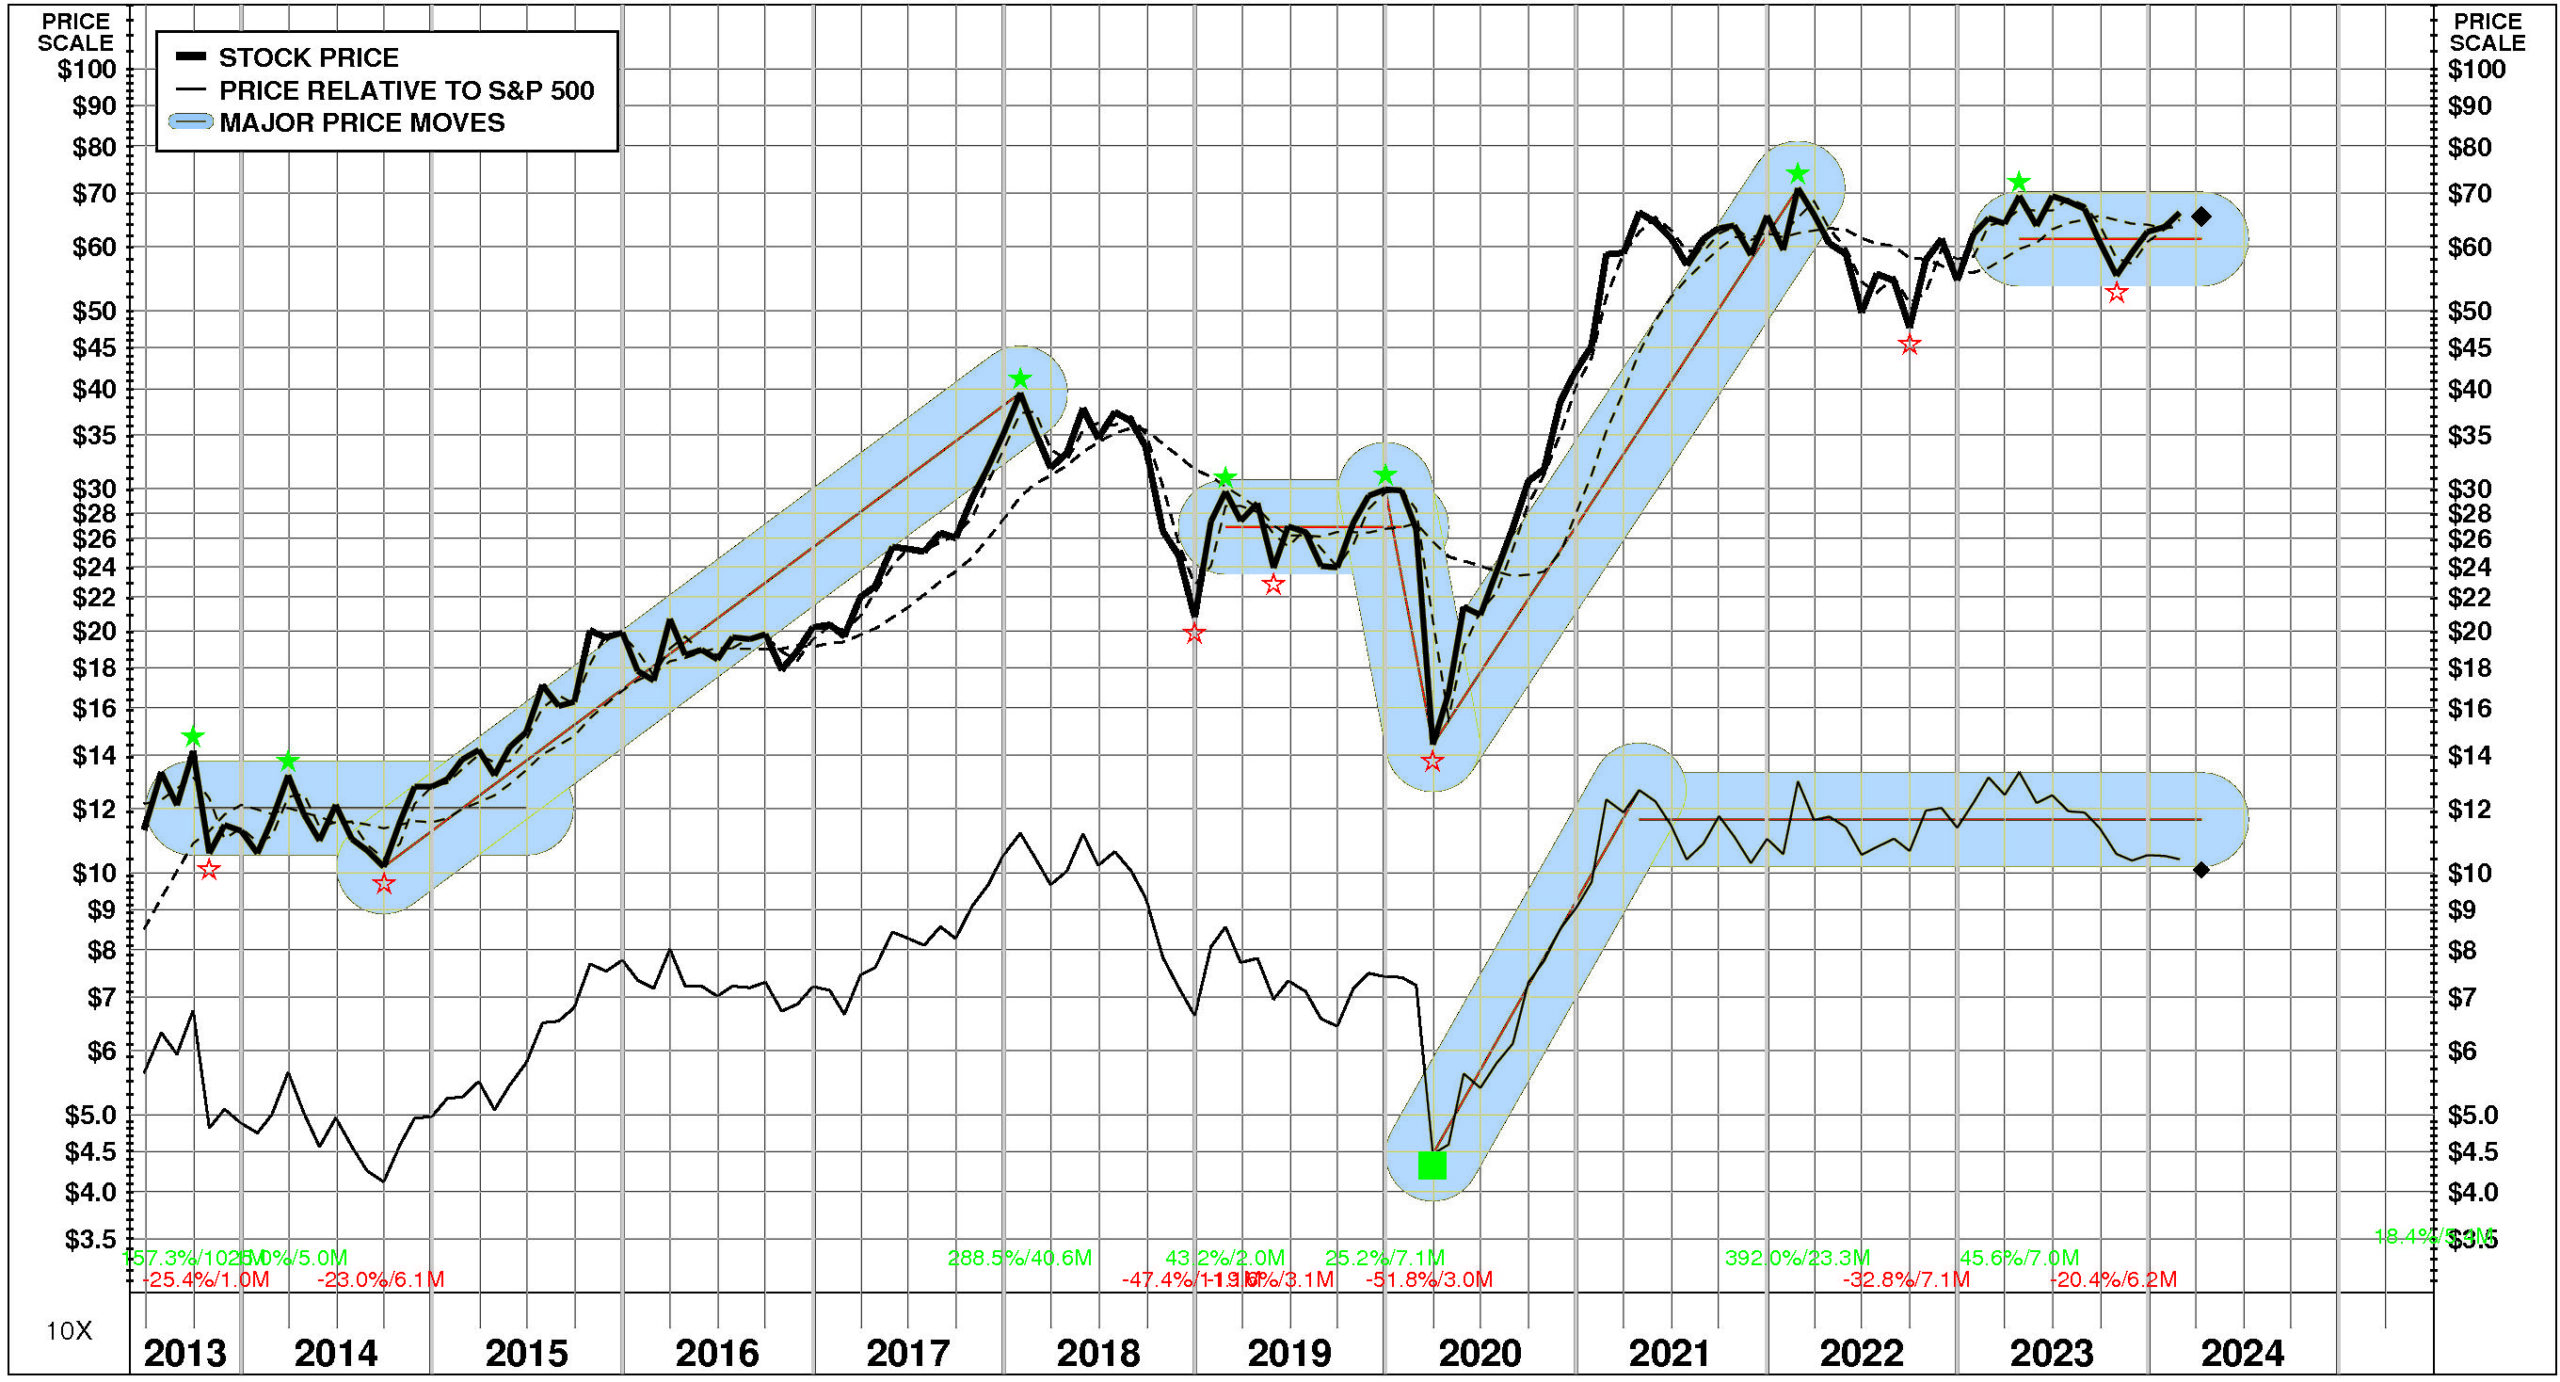
PRICE HISTORY
Over the full time period, Boyd Gaming’s stock price performance has been variable and superior. Between June, 2013 and April, 2024, Boyd Gaming’s stock price rose +479%; relative to the market, this was a +79% gain. Significant price moves during the period: 1) March, 2020 – February, 2022: +392%; 2) December, 2019 – March, 2020: -52%; and 3) September, 2014 – January, 2018: +288%.
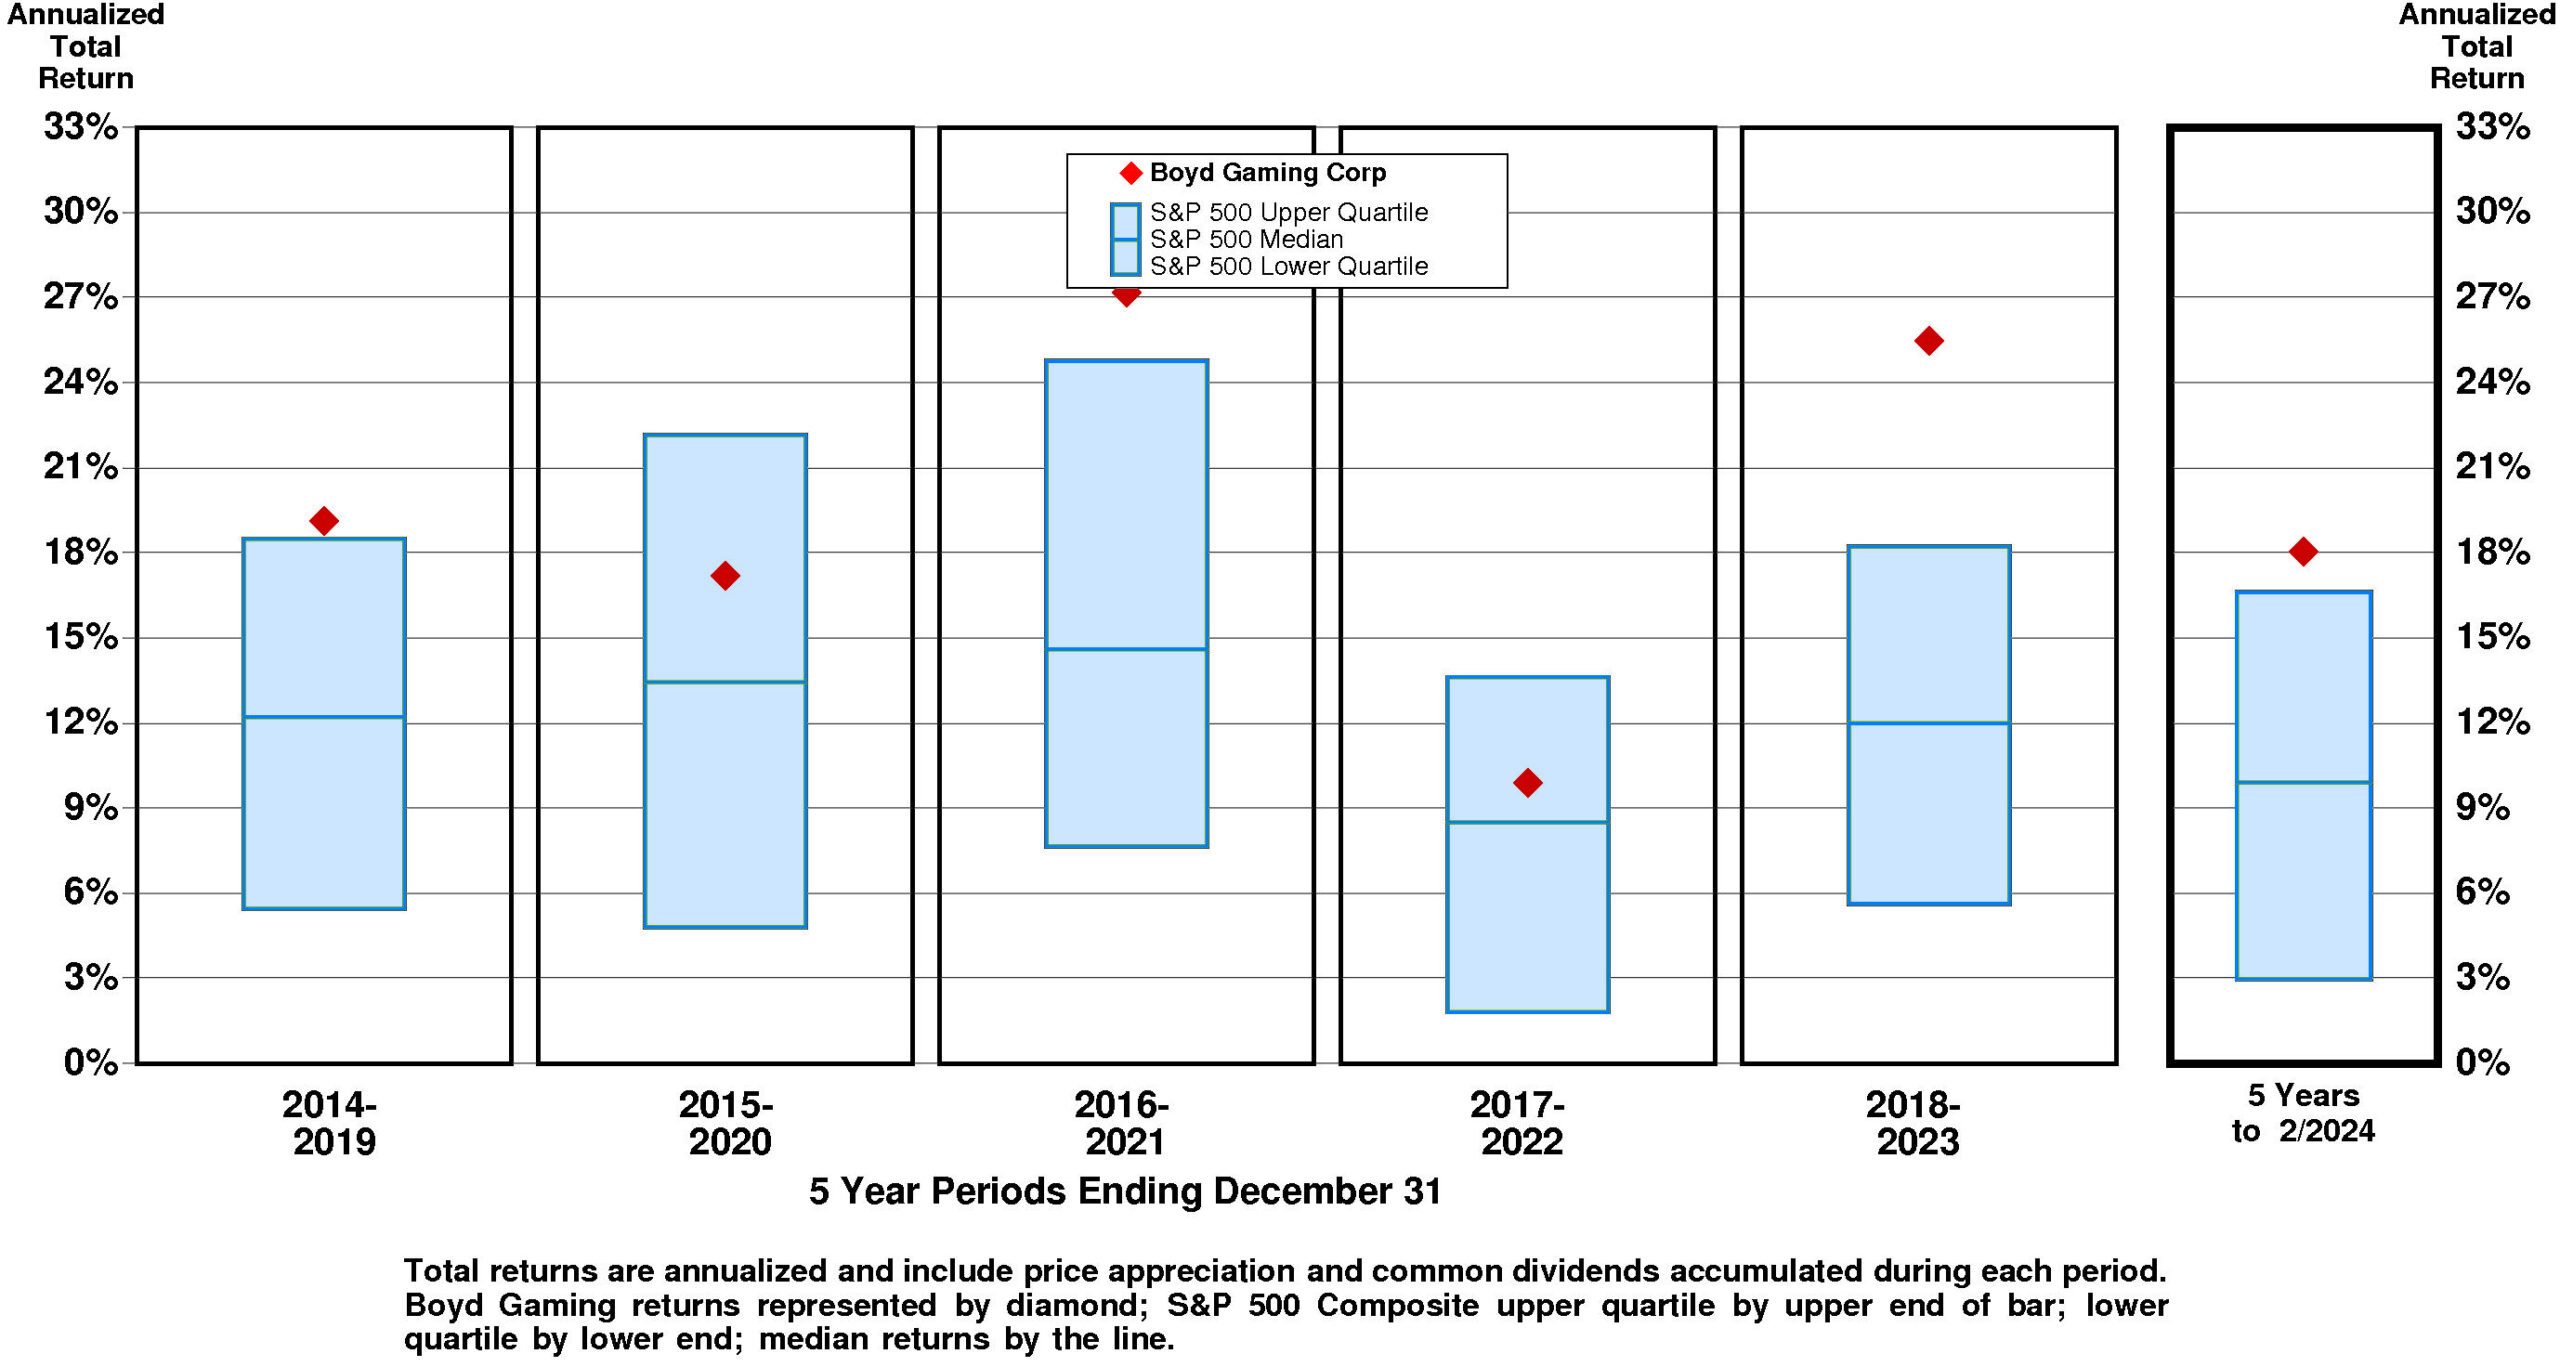
TOTAL INVESTMENT RETURNS
Current annual total return performance of 2.6% is below median relative to the S&P 500 Composite.
In addition to being below median relative to S&P 500 Composite, current annual total return performance through February, 2024 of 2.6% is at the lower quartile relative to Boyd Gaming Corp Peer Group.
Current 5-year total return performance of 18.0% is upper quartile relative to the S&P 500 Composite.
Through February, 2024, with upper quartile current 5-year total return of 18.0% relative to S&P 500 Composite, Boyd Gaming’s total return performance is substantially above median relative to Boyd Gaming Corp Peer Group.
VALUATION BENCHMARKS
Relative to S&P 500 Composite, BYD’s overall valuation is low. The highest factor, the price/equity ratio, is slightly above median. Ratio of enterprise value/assets is at median. Ratio of enterprise value/revenue is below median. Ratio of enterprise value/earnings before interest and taxes is lower quartile. The lowest factor, the price/earnings ratio, is lower quartile.
Relative to Boyd Gaming Peer Group, BYD’s overall valuation is low. The highest factor, the price/equity ratio, is near the upper quartile. Ratio of enterprise value/assets is above median. Ratio of enterprise value/revenue is at median. Price/earnings ratio is lower quartile. The lowest factor, the ratio of enterprise value/earnings before interest and taxes, is lower quartile.
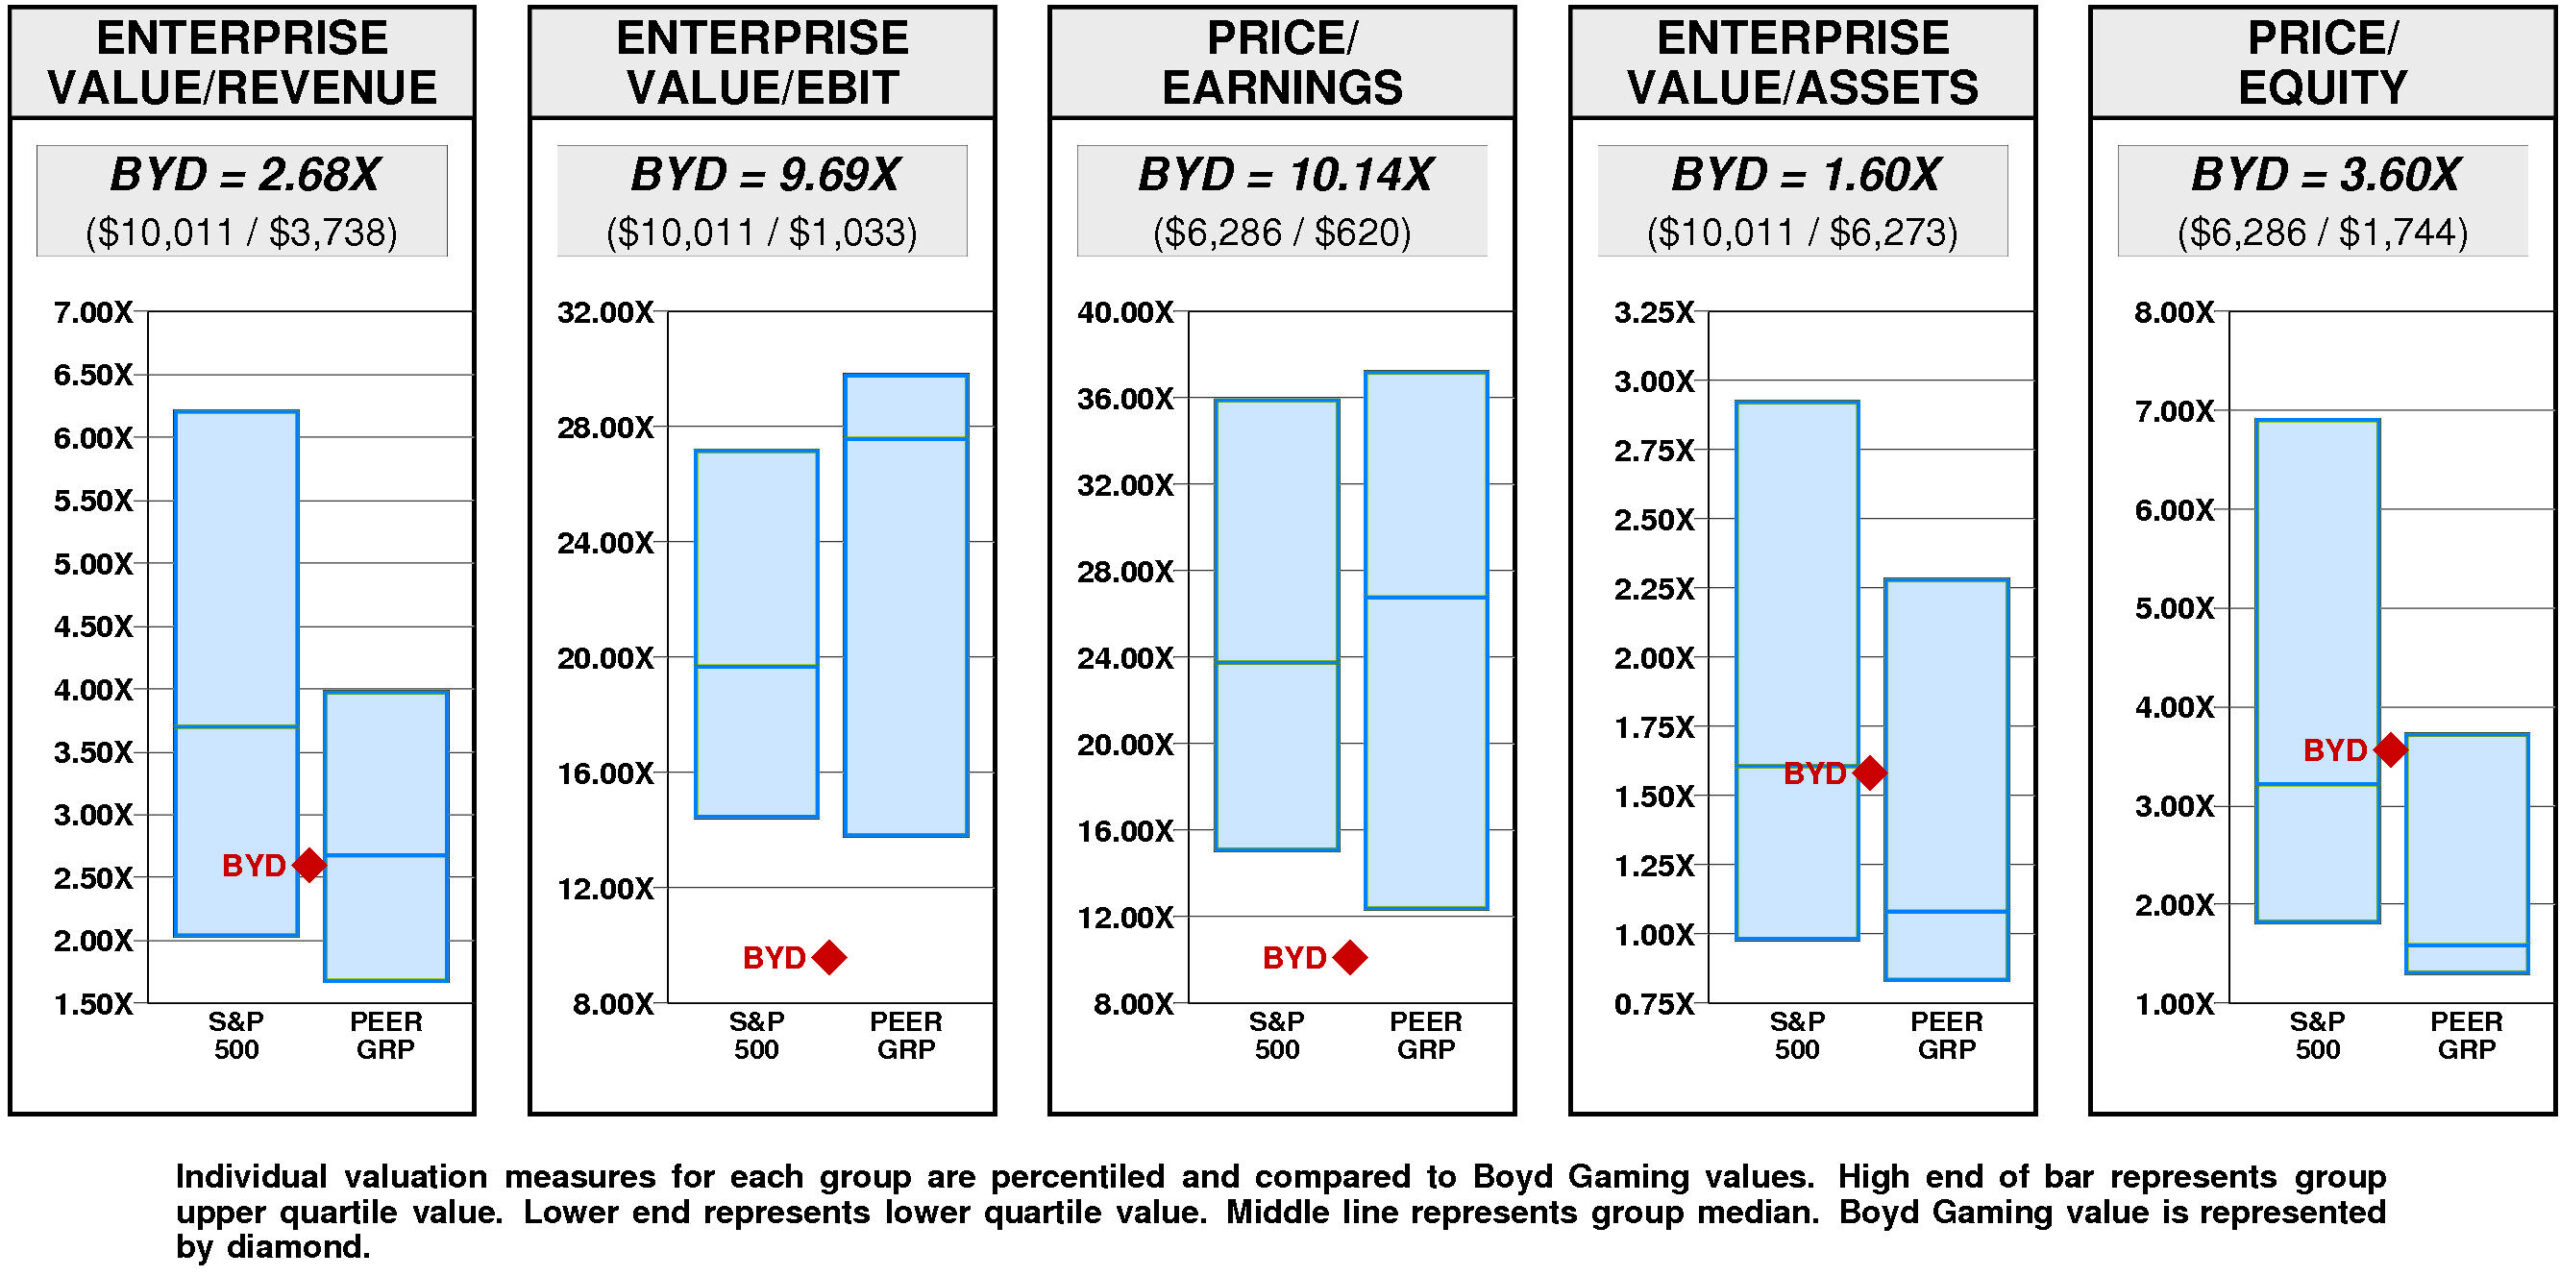
Boyd Gaming has a major value gap compared to median valuation. For BYD to fall to lower quartile valuation, its current ratio of enterprise value/revenue would have to decline from the current level of 2.68X to 1.68X. If BYD’s ratio of enterprise value/revenue were to decline to 1.68X, its stock price would be lower by $-39 to $27.
For BYD to achieve upper quartile valuation relative to the Boyd Gaming Peer Group, its current ratio of enterprise value/revenue would have to rise from the current level of 2.68X to 3.97X. If BYD’s ratio of enterprise value/revenue were to rise to 3.97X, its stock price would increase by $50 from the current level of $65.
VALUE TARGETS
BYD’s future returns on capital are forecasted to exceed the cost of capital. Accordingly, the company is expected to continue to be a major Value Builder.
Boyd Gaming’s current Price Target of $96 represents a +47% change from the current price of $65.44.
This neutral appreciation potential results in an appreciation score of 54 (46% of the universe has greater appreciation potential.)
Reinforcing this neutral Appreciation Score of 54, the moderately low Power Rating of 37 contributes to an Value Trend Rating of C.
Boyd Gaming’s current Price Target is $96 (-7% from the 2023 Target of $104 but +47% from the 04/11/24 price of $65.44). This slight fall in the Target is the result of a +10% increase in the equity base and a -16% decrease in the price/equity multiple. The forecasted decline in cost of equity has a slight positive impact on the price/equity multiple and the forecasted increase in return on equity has a very slight positive impact as well. More than offsetting these Drivers, the forecasted decline in growth has a very large negative impact.
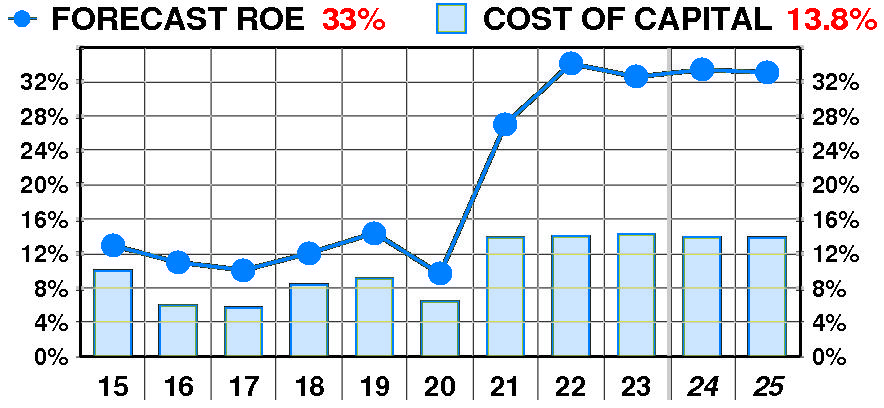
PTR’s return on equity forecast is 33.1% — in line with our recent forecasts. Forecasted return on equity enjoyed a dramatic, variable increase between 2015 and 2023. The current forecast is significantly above the 2020 low of 10%.
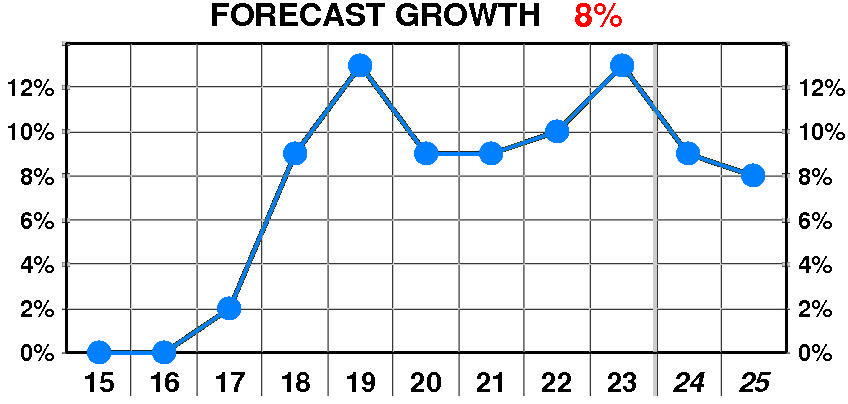
PTR’s growth forecast is 8.0% — below our recent forecasts. Forecasted growth enjoyed a dramatic, erratic increase between 2017 and 2023. The current forecast is well above the 2017 low of 2%.
PTR’s cost of equity forecast is 13.8% — in line with recent levels. Forecasted cost of equity suffered a dramatic, erratic increase between 2015 and 2023. The current forecast is well above the 2017 low of 5.7%.
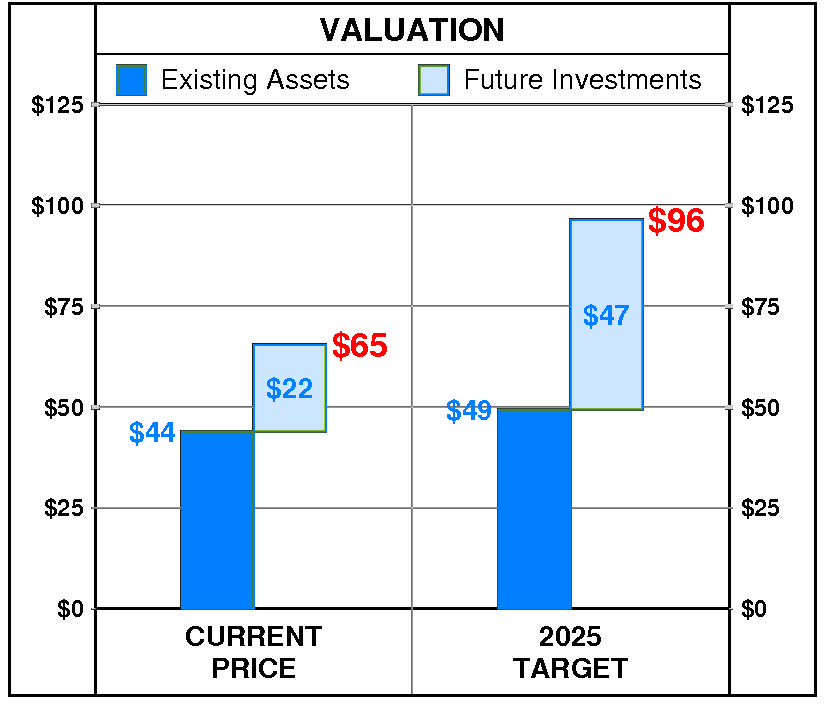
At Boyd Gaming’s current price of $65.44, investors are placing a positive value of $22 on its future investments. This view is consistent with the company’s most recent performance that reflected a growth rate of 13.0% per year, and a return on equity of 32.5% versus a cost of equity of 14.3%.
PTR’s 2025 Price Target of $96 is based on these forecasts and reflects an estimated value of existing assets of $49 and a value of future investments of $47.
Be the first to comment