![]()
BUSINESS
The Carlyle Group Inc. is an investment firm specializing in direct and fund of fund investments. Within direct investments, it specializes in management-led/ Leveraged buyouts, privatizations, divestitures, strategic minority equity investments, structured credit, global distressed and corporate opportunities, small and middle market, equity private placements, consolidations and buildups, senior debt, mezzanine and leveraged finance, and venture and growth capital financings, seed/startup, early venture, emerging growth, turnaround, mid venture, late venture, PIPES. The firm invests across four segments which include Corporate Private Equity, Real Assets, Global Market Strategies, and Solutions.

INVESTMENT RATING
CG is expected to continue to be a major Value Builder reflecting capital returns that are forecasted to exceed the cost of capital.
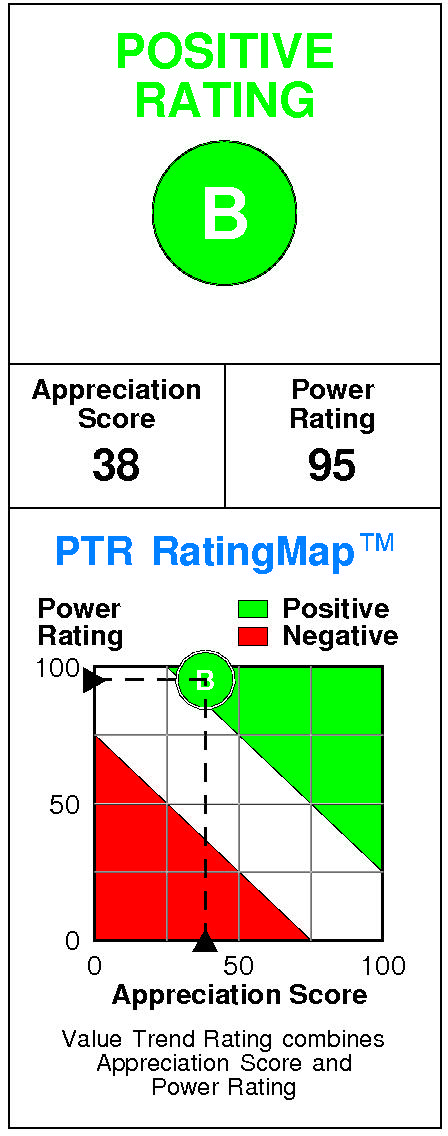
Carlyle Group has a current Value Trend Rating of B (Positive).
With this rating, PTR’s two proprietary measures of a stock’s current attractiveness are providing very contradictory signals. Carlyle Group has a slightly negative Appreciation Score of 38 but a very high Power Rating of 95, resulting in the Positive Value Trend Rating.
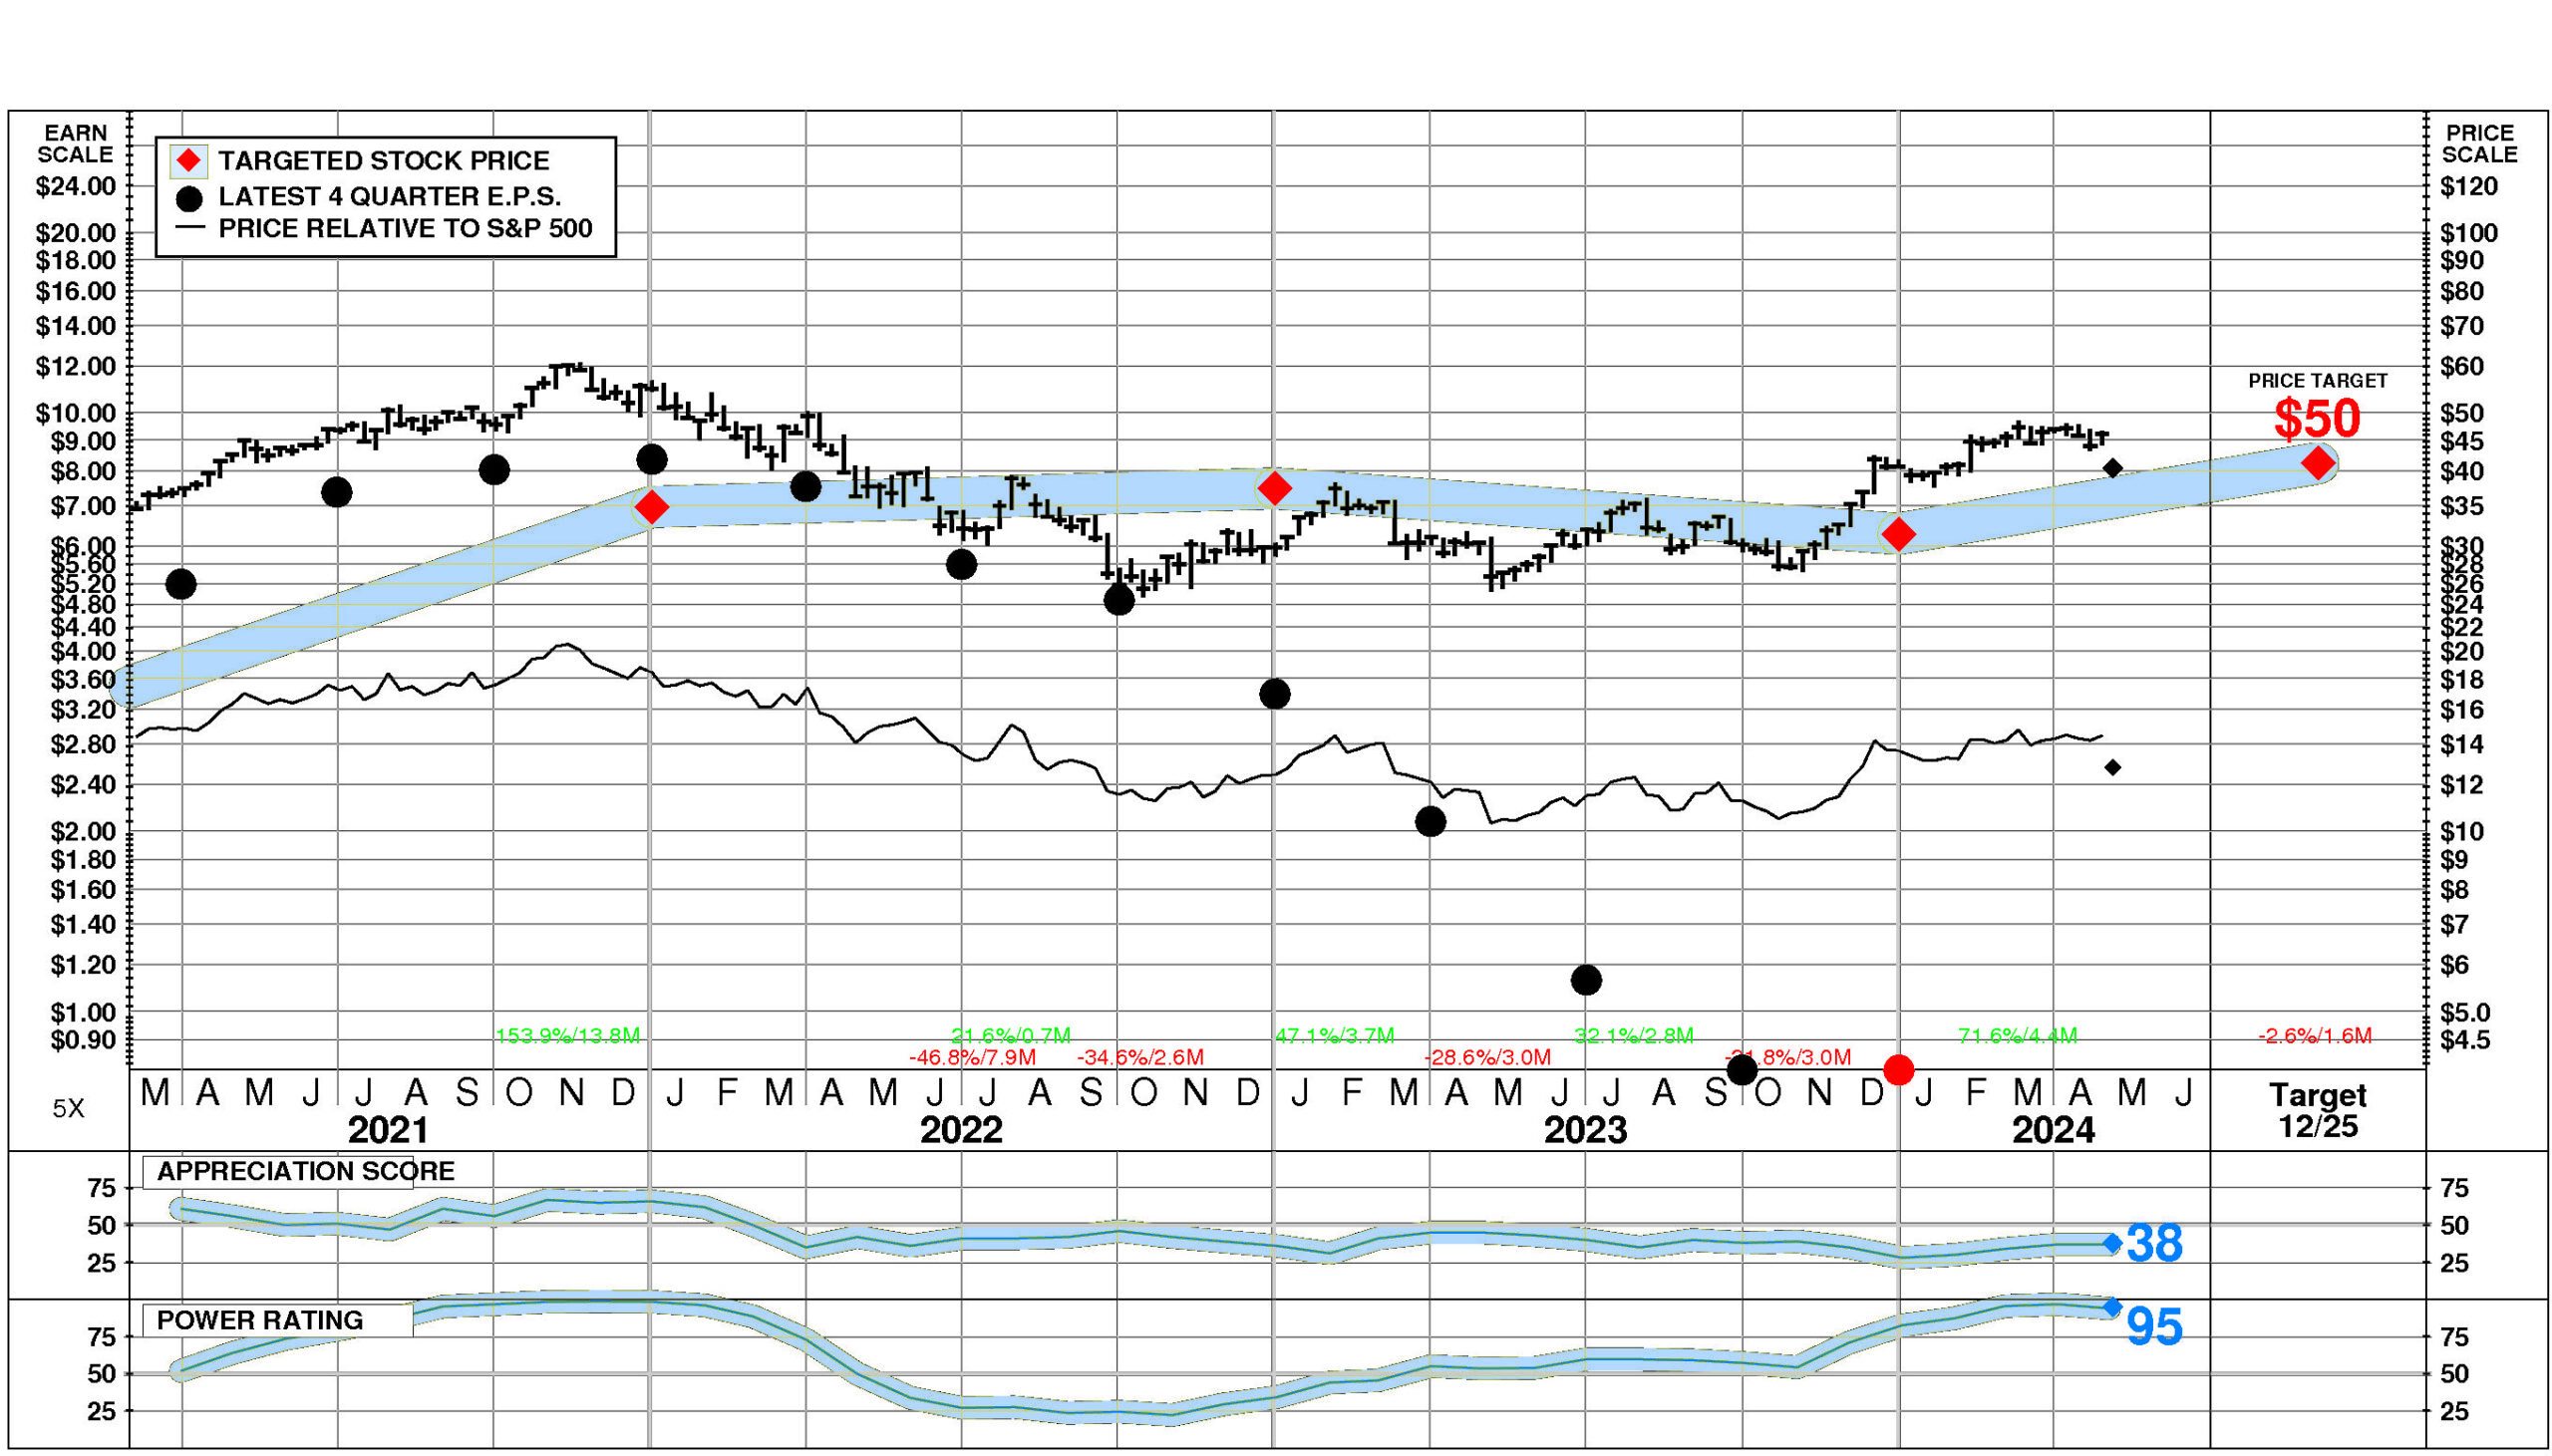
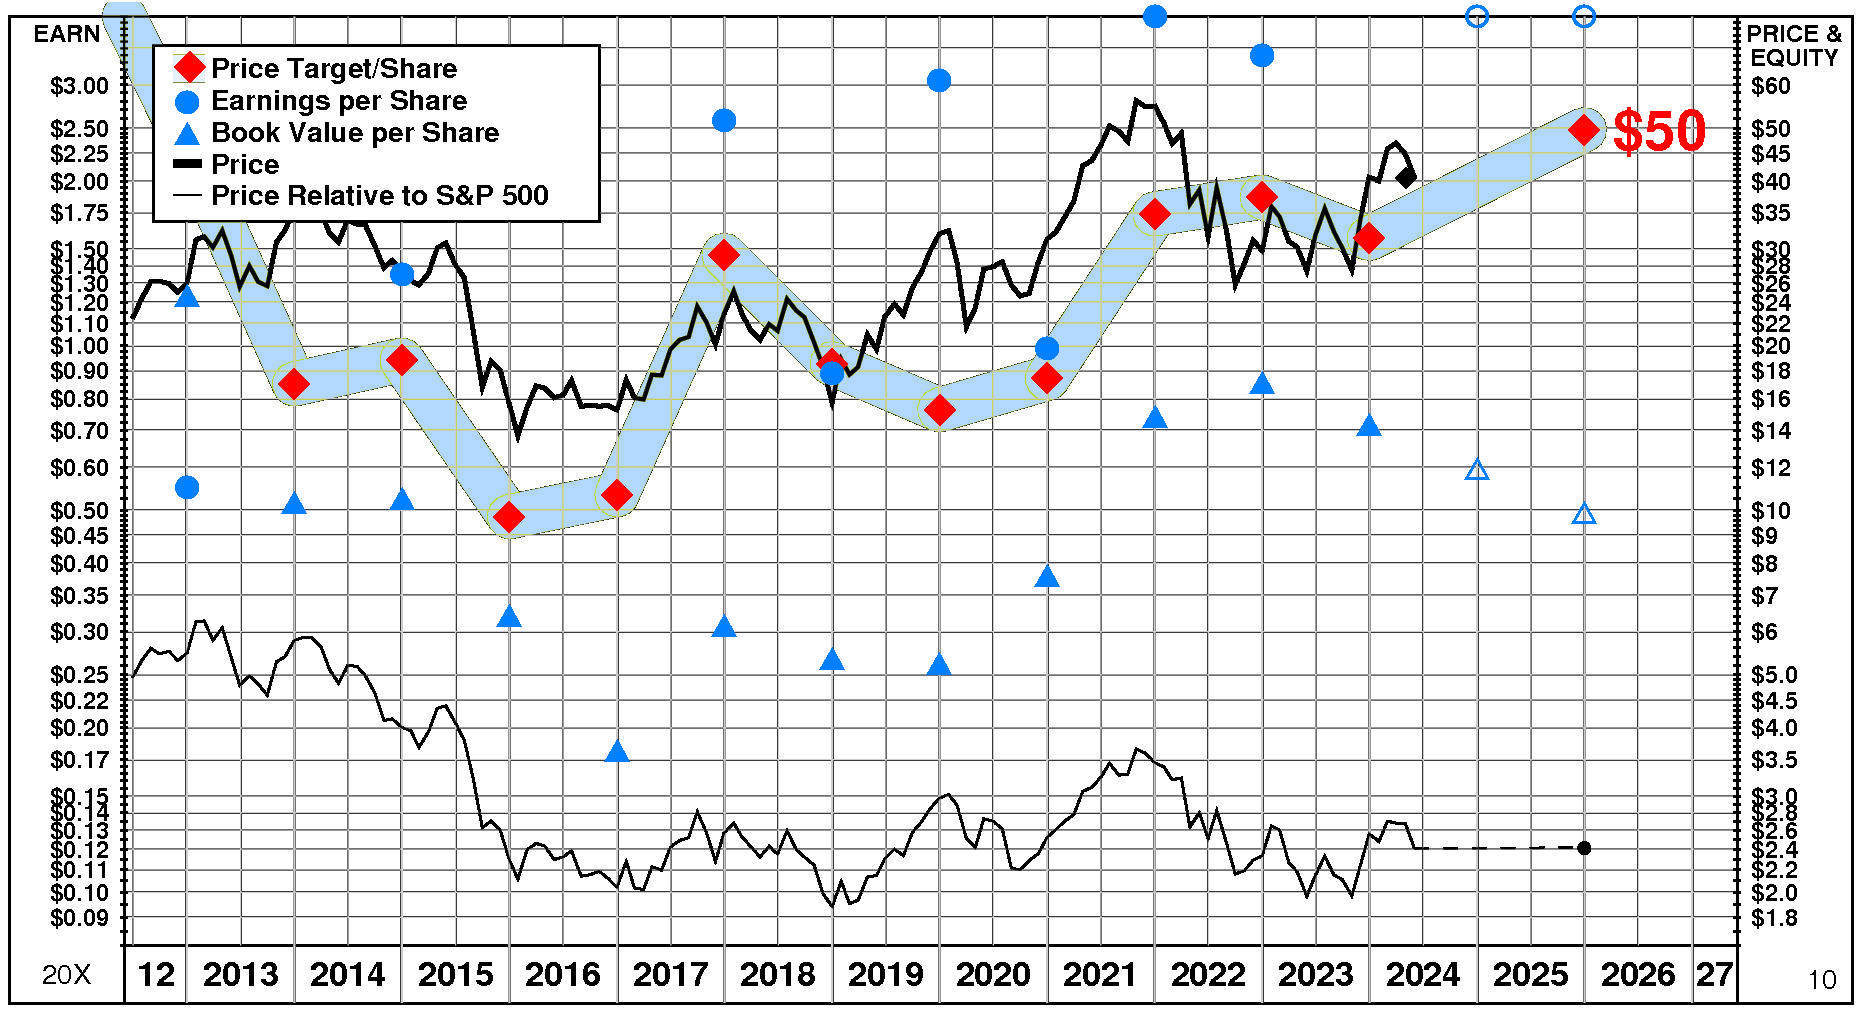
Carlyle Group’s stock is selling at targeted value. The current stock price of $40.58 compares to targeted value 12 months forward of $41.
This moderately low appreciation potential results in an appreciation score of 38 (62% of the universe has greater appreciation potential.)
Carlyle Group has a Power Rating of 95. (This very high Power Rating indicates that CG has a better chance of achieving attractive investment performance over the near to intermediate term than all but 5% of companies in the universe.)
Factors contributing to this very high Power Rating include: recent price action has been extremely favorable; the Investment Advice comparison group is in a strong phase currently; and earnings estimate behavior for CG has been slightly favorable recently.
INVESTMENT PROFILE
CG’s financial strength is high. Financial strength rating is 88.
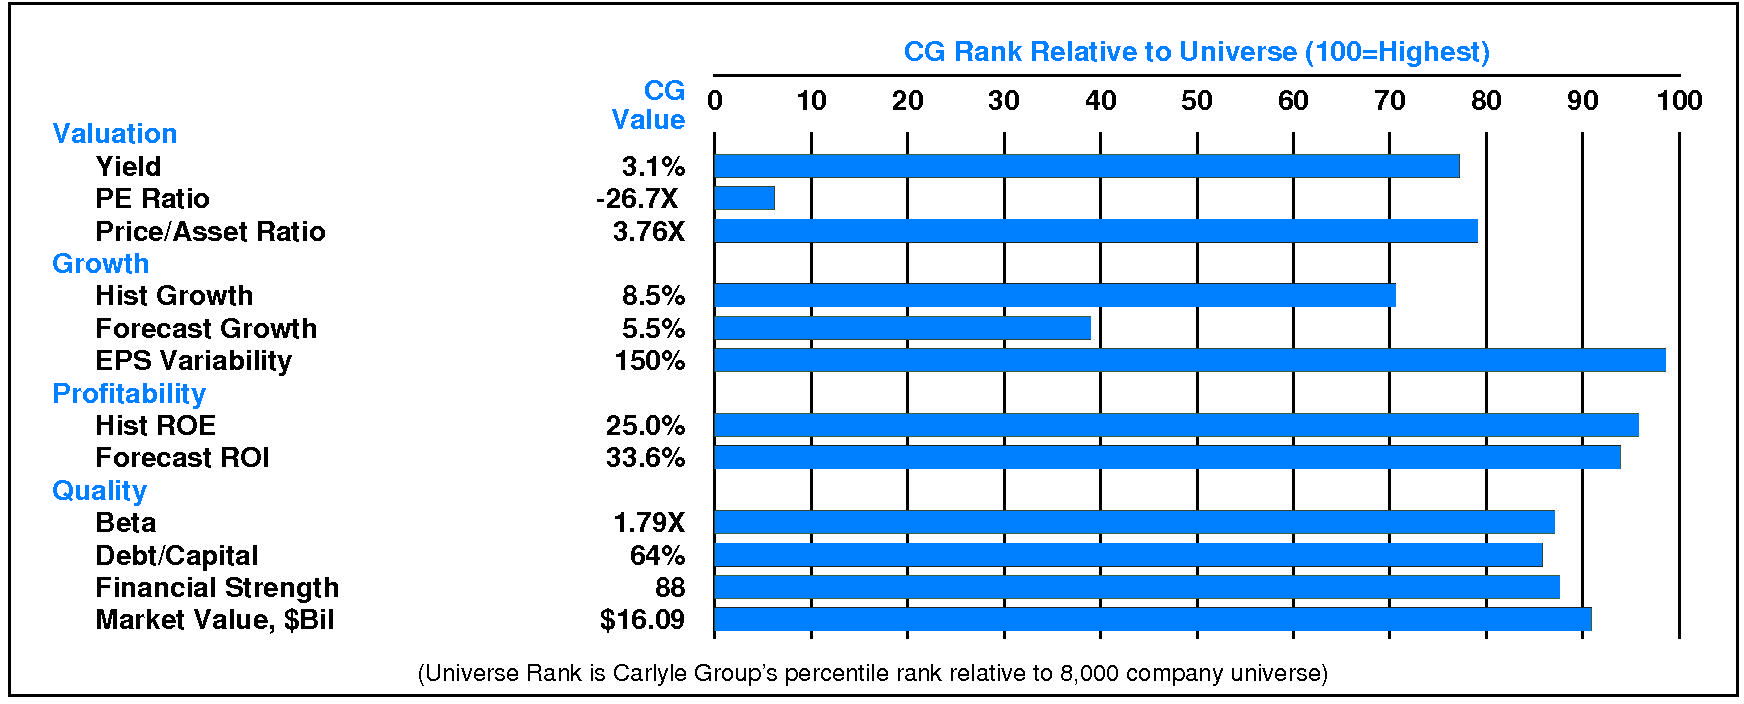
Relative to the S&P 500 Composite, Carlyle Group Inc has neutral Growth/Value characteristics; its appeal is likely to be to investors neutral towards Income; the perception is that CG is higher risk. Relative weaknesses include: high stock price volatility, high financial leverage, low expected growth, and high earnings variability. CG’s valuation is low: high dividend yield, low P/E ratio, and moderate price/book ratio. CG has low market capitalization.
CURRENT SIGNALS
Carlyle Group’s current operations are eroding. Return on equity is falling, reflecting: falling asset utilization; declining pretax margin; falling tax keep rate; and falling leverage.
Carlyle Group’s current technical position is very strong. The stock price is in a 4.4 month up move. The stock has appreciated 71.6% from its prior low. The stock price is above its 200 day moving average which is in an uptrend.
ALERTS
Recent notable negative changes in investment behavior have affected The Carlyle Group Inc (NASDAQ: CG): its shorter term price trend turned down.
Recent marginal negative changes in fundamentals have affected The Carlyle Group Inc (NASDAQ: CG): significant quarterly earnings deceleration occurred.
The stock is currently rated B.
The Carlyle Group Inc (NASDAQ: CG) stock declined slightly by -1.0% on 5/2/24. The stock closed at $40.58. Moreover, above average trading volume at 140% of normal accompanied the decline. The stock has been exceptionally strong relative to the market over the last nine months but has declined -12.0% during the last week.
CASH FLOW
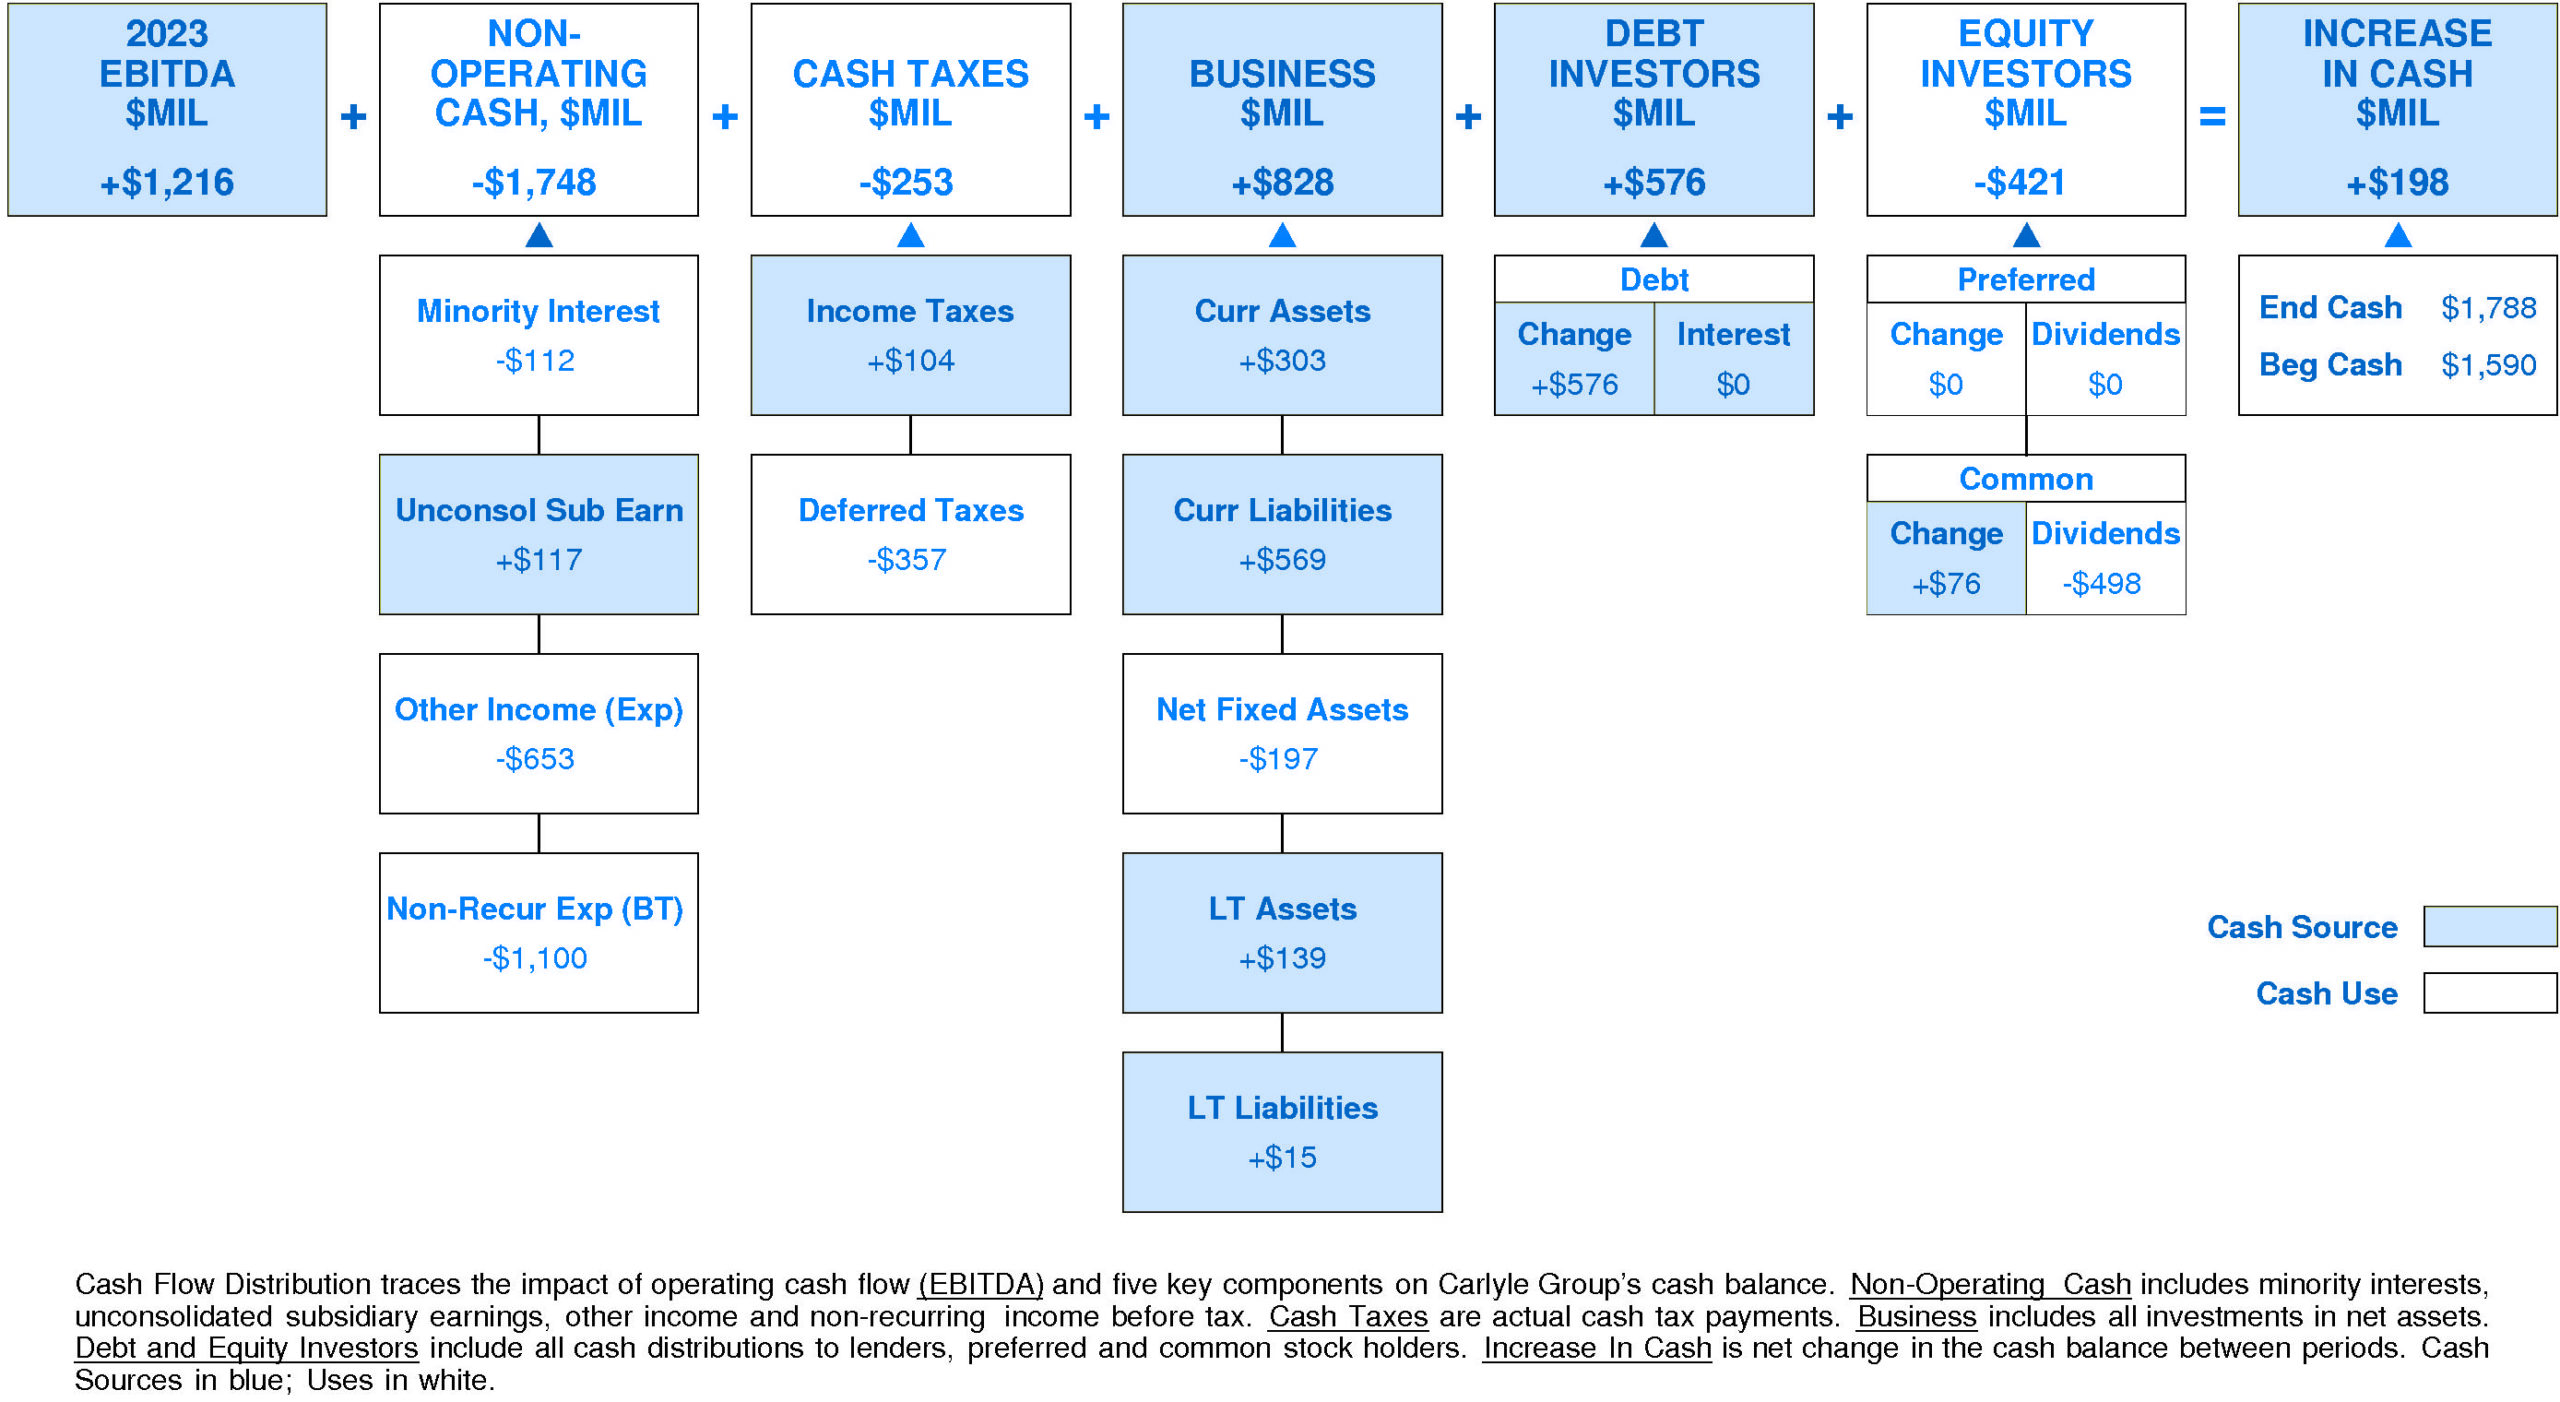
In 2023, Carlyle Group generated a significant increase in cash of +$198 million (+12%). Sources of cash were larger than uses. Cash generated from 2023 EBITDA totaled +$1,216 million. Non-operating uses consumed -$1,748 million (-144% of EBITDA). Cash taxes consumed -$253 million (-21% of EBITDA). Withdrawal of investment from the business totaled +$828 million (+68% of EBITDA). On a net basis, debt investors furnished +$576 million (+47% of EBITDA) while equity investors received -$421 million (-35% of EBITDA).
Carlyle Group’s Non-operating Income, %EBITDA has exhibited a volatile overall uptrend over the period. This improvement was accompanied by a similar trend for the Carlyle Group Peer Group. (Since 2021 Non-operating Income, %EBITDA has experienced a very sharp decline.) In most years, Carlyle Group was in the lower quartile and third quartile. Currently, Carlyle Group is lower quartile at -144% of EBITDA (-$1,748 million).
Carlyle Group’s Cash Taxes, %EBITDA has experienced a minor downtrend over the period. This downtrend was accompanied by stability for the Carlyle Group Peer Group. In most years, Carlyle Group was in the third quartile and second quartile. Currently, Carlyle Group is lower quartile at -21% of EBITDA (-$253 million).
Carlyle Group’s Business Re-investment, %EBITDA has suffered a volatile overall downtrend over the period. This downtrend was accompanied by a similar trend for the Carlyle Group Peer Group. (Since 2021 Business Re-investment, %EBITDA has experienced a very sharp recovery.) In most years, Carlyle Group was in the third quartile and top quartile. Currently, Carlyle Group is upper quartile at +68% of EBITDA (+$828 million).
Carlyle Group’s Debt Investors, %EBITDA has experienced a volatile overall uptrend over the period. This improvement was accompanied by stability for the Carlyle Group Peer Group. In most years, Carlyle Group was in the second quartile and top quartile. Currently, Carlyle Group is at the upper quartile at +47% of EBITDA (+$576 million).
Carlyle Group’s Equity Investors, %EBITDA has exhibited a volatile overall uptrend over the period. This improvement was accompanied by a similar trend for the Carlyle Group Peer Group. (Since 2020 Equity Investors, %EBITDA has experienced a very sharp decline.) In most years, Carlyle Group was in the third quartile and top quartile. Currently, Carlyle Group is below median at -35% of EBITDA (-$421 million).
Carlyle Group’s Change in Cash, %EBITDA has experienced a volatile overall uptrend over the period. This improvement was accompanied by a similar trend for the Carlyle Group Peer Group. In most years, Carlyle Group was in the top quartile and lower quartile. Currently, Carlyle Group is upper quartile at +16% of EBITDA (+$198 million).
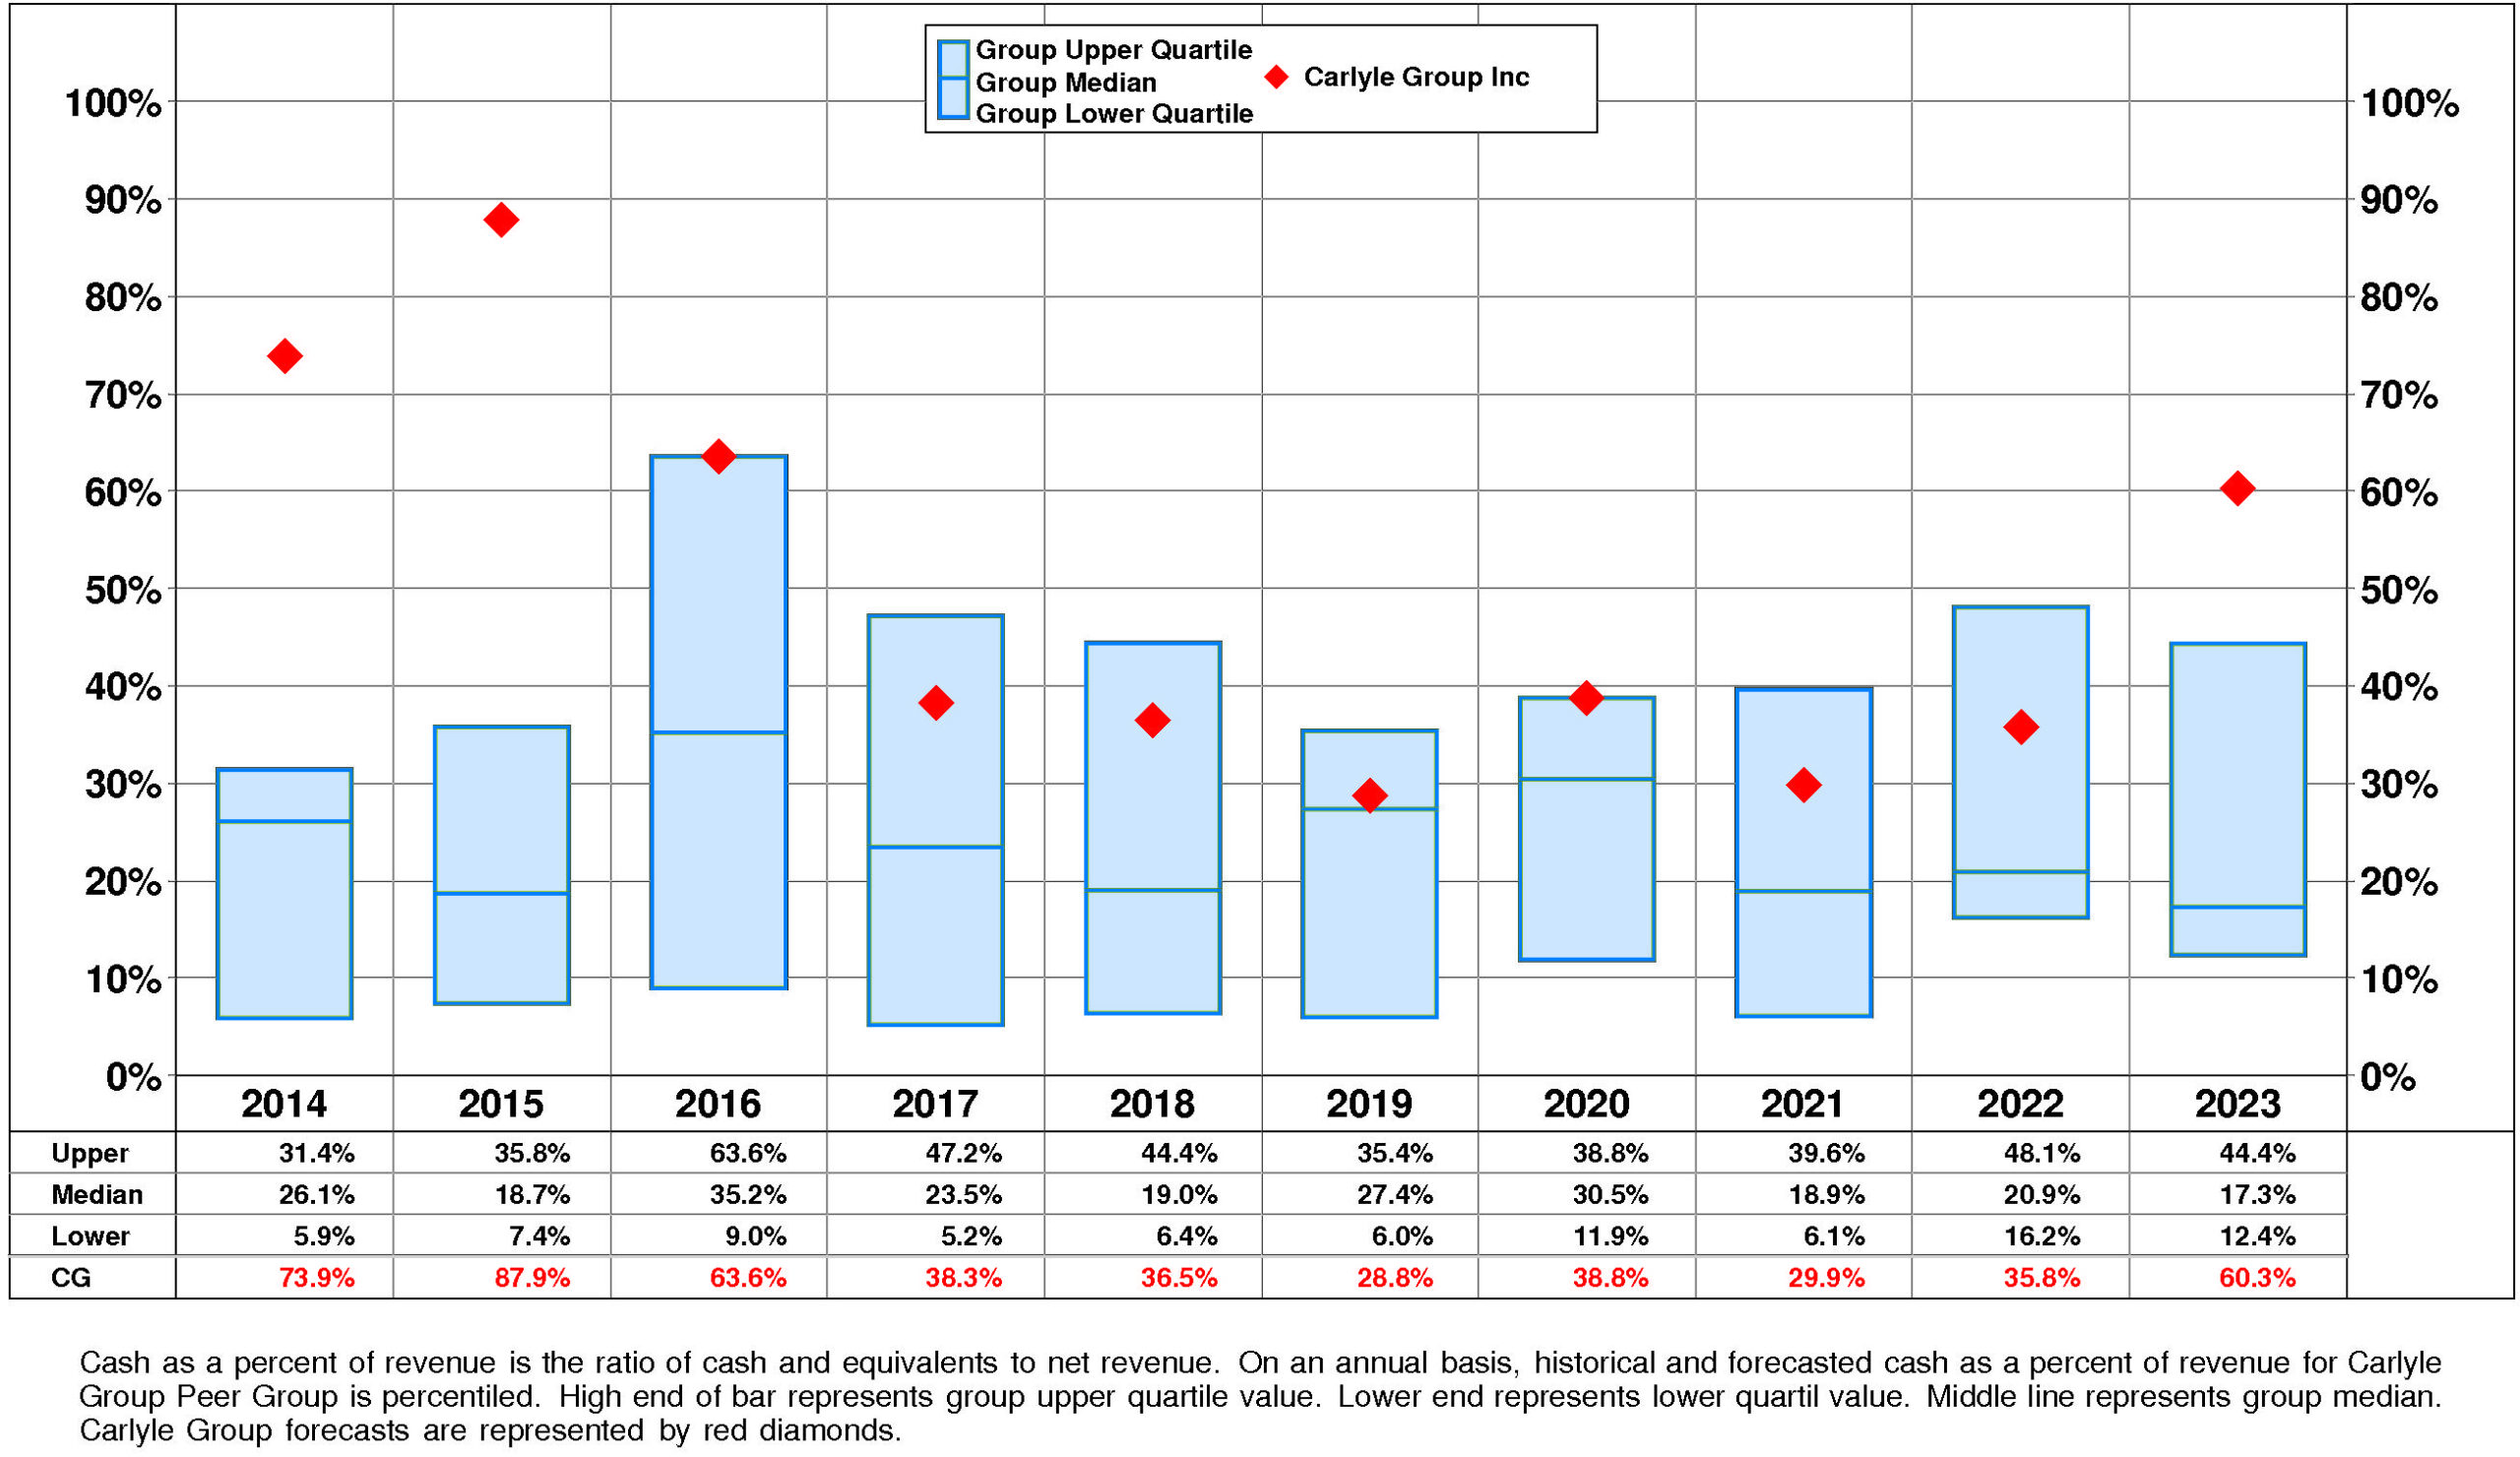
Carlyle Group’s Cash, %Revenue has suffered a very strong overall downtrend over the period. This downtrend was accompanied by a similar trend for the Carlyle Group Peer Group. (Since 2021 Cash, %Revenue has experienced a very sharp recovery.) In most years, Carlyle Group was in the top quartile and second quartile. Currently, Carlyle Group is upper quartile at +60%.
PROFITABILITY
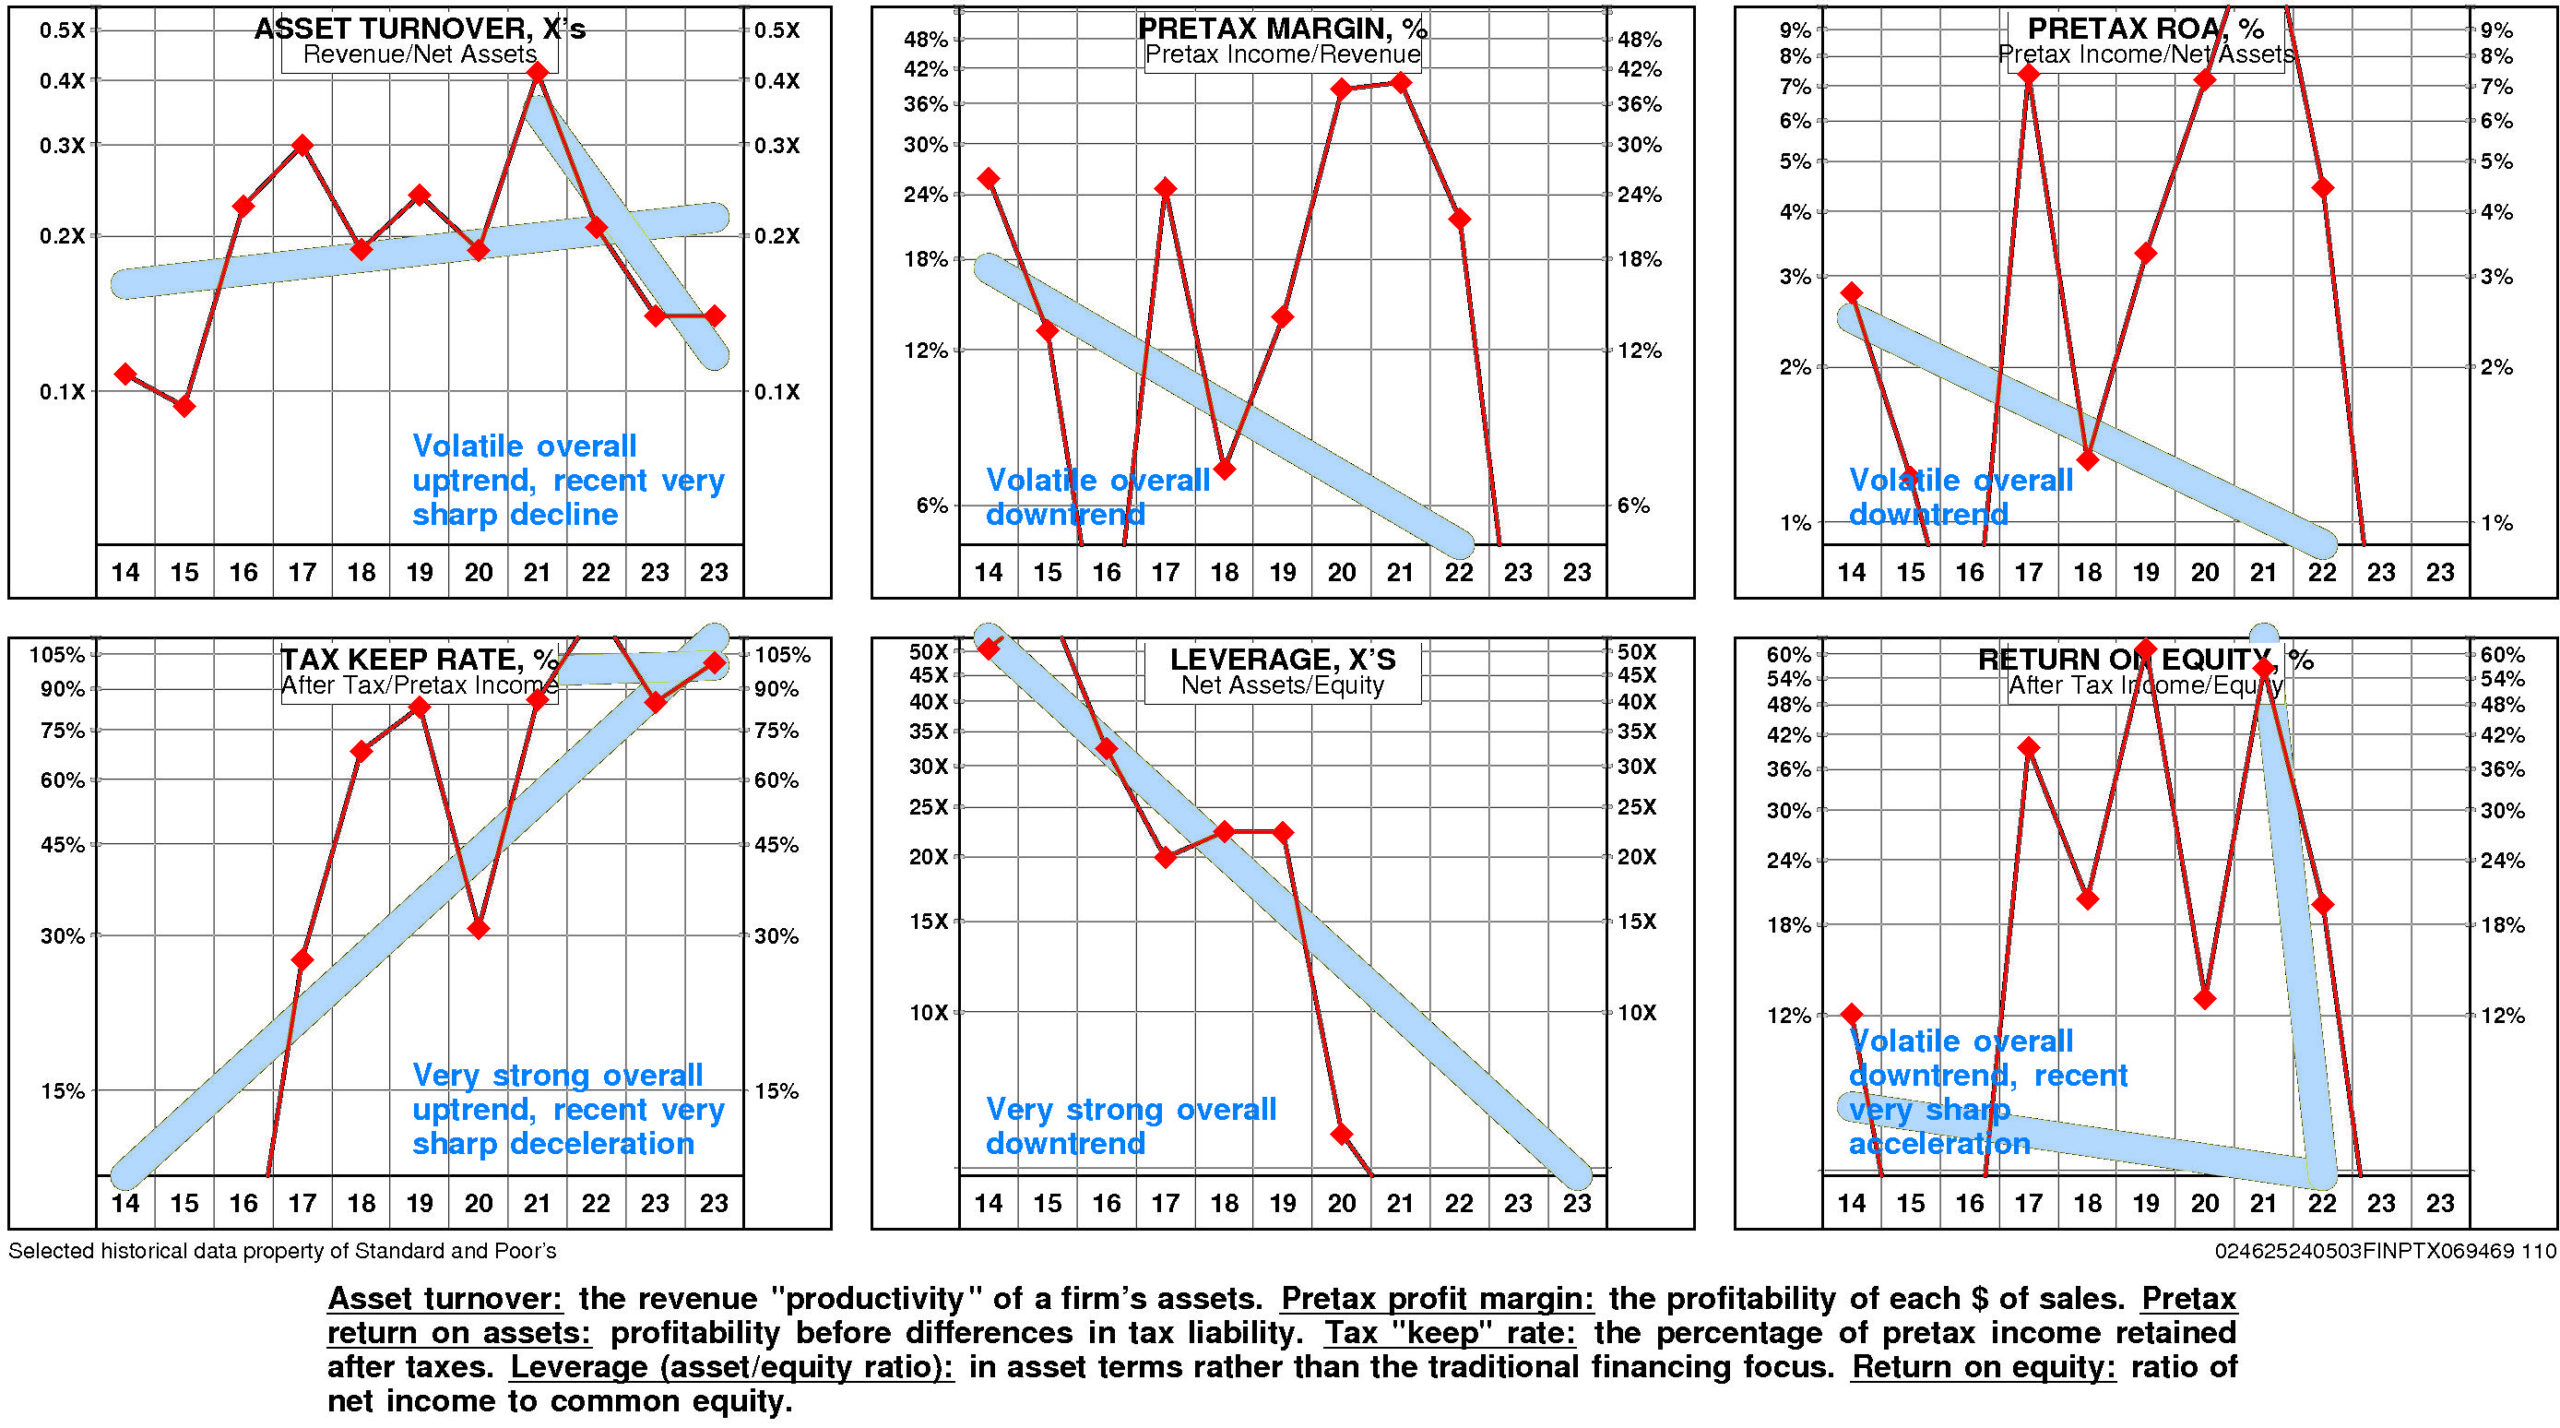
Carlyle Group’s return on equity has eroded very significantly since 2014. The current level is -11.7% versus the high of 12.1% and the low of -11.7%.
This very significant erosion was due to very strong negative trend in pretax operating return and little change in non-operating factors.
The productivity of Carlyle Group’s assets rose over the full period 2014-2023: asset turnover has enjoyed a volatile overall uptrend although it experienced a very sharp decline after the 2021 high.
Carlyle Group’s pretax margin experienced a volatile overall downtrend over the period 2014-2023.
Non-operating factors (income taxes and financial leverage) had little influence on return on equity.
Carlyle Group’s return on equity is lower quartile (-11.7%) for the four quarters ended December, 2023.
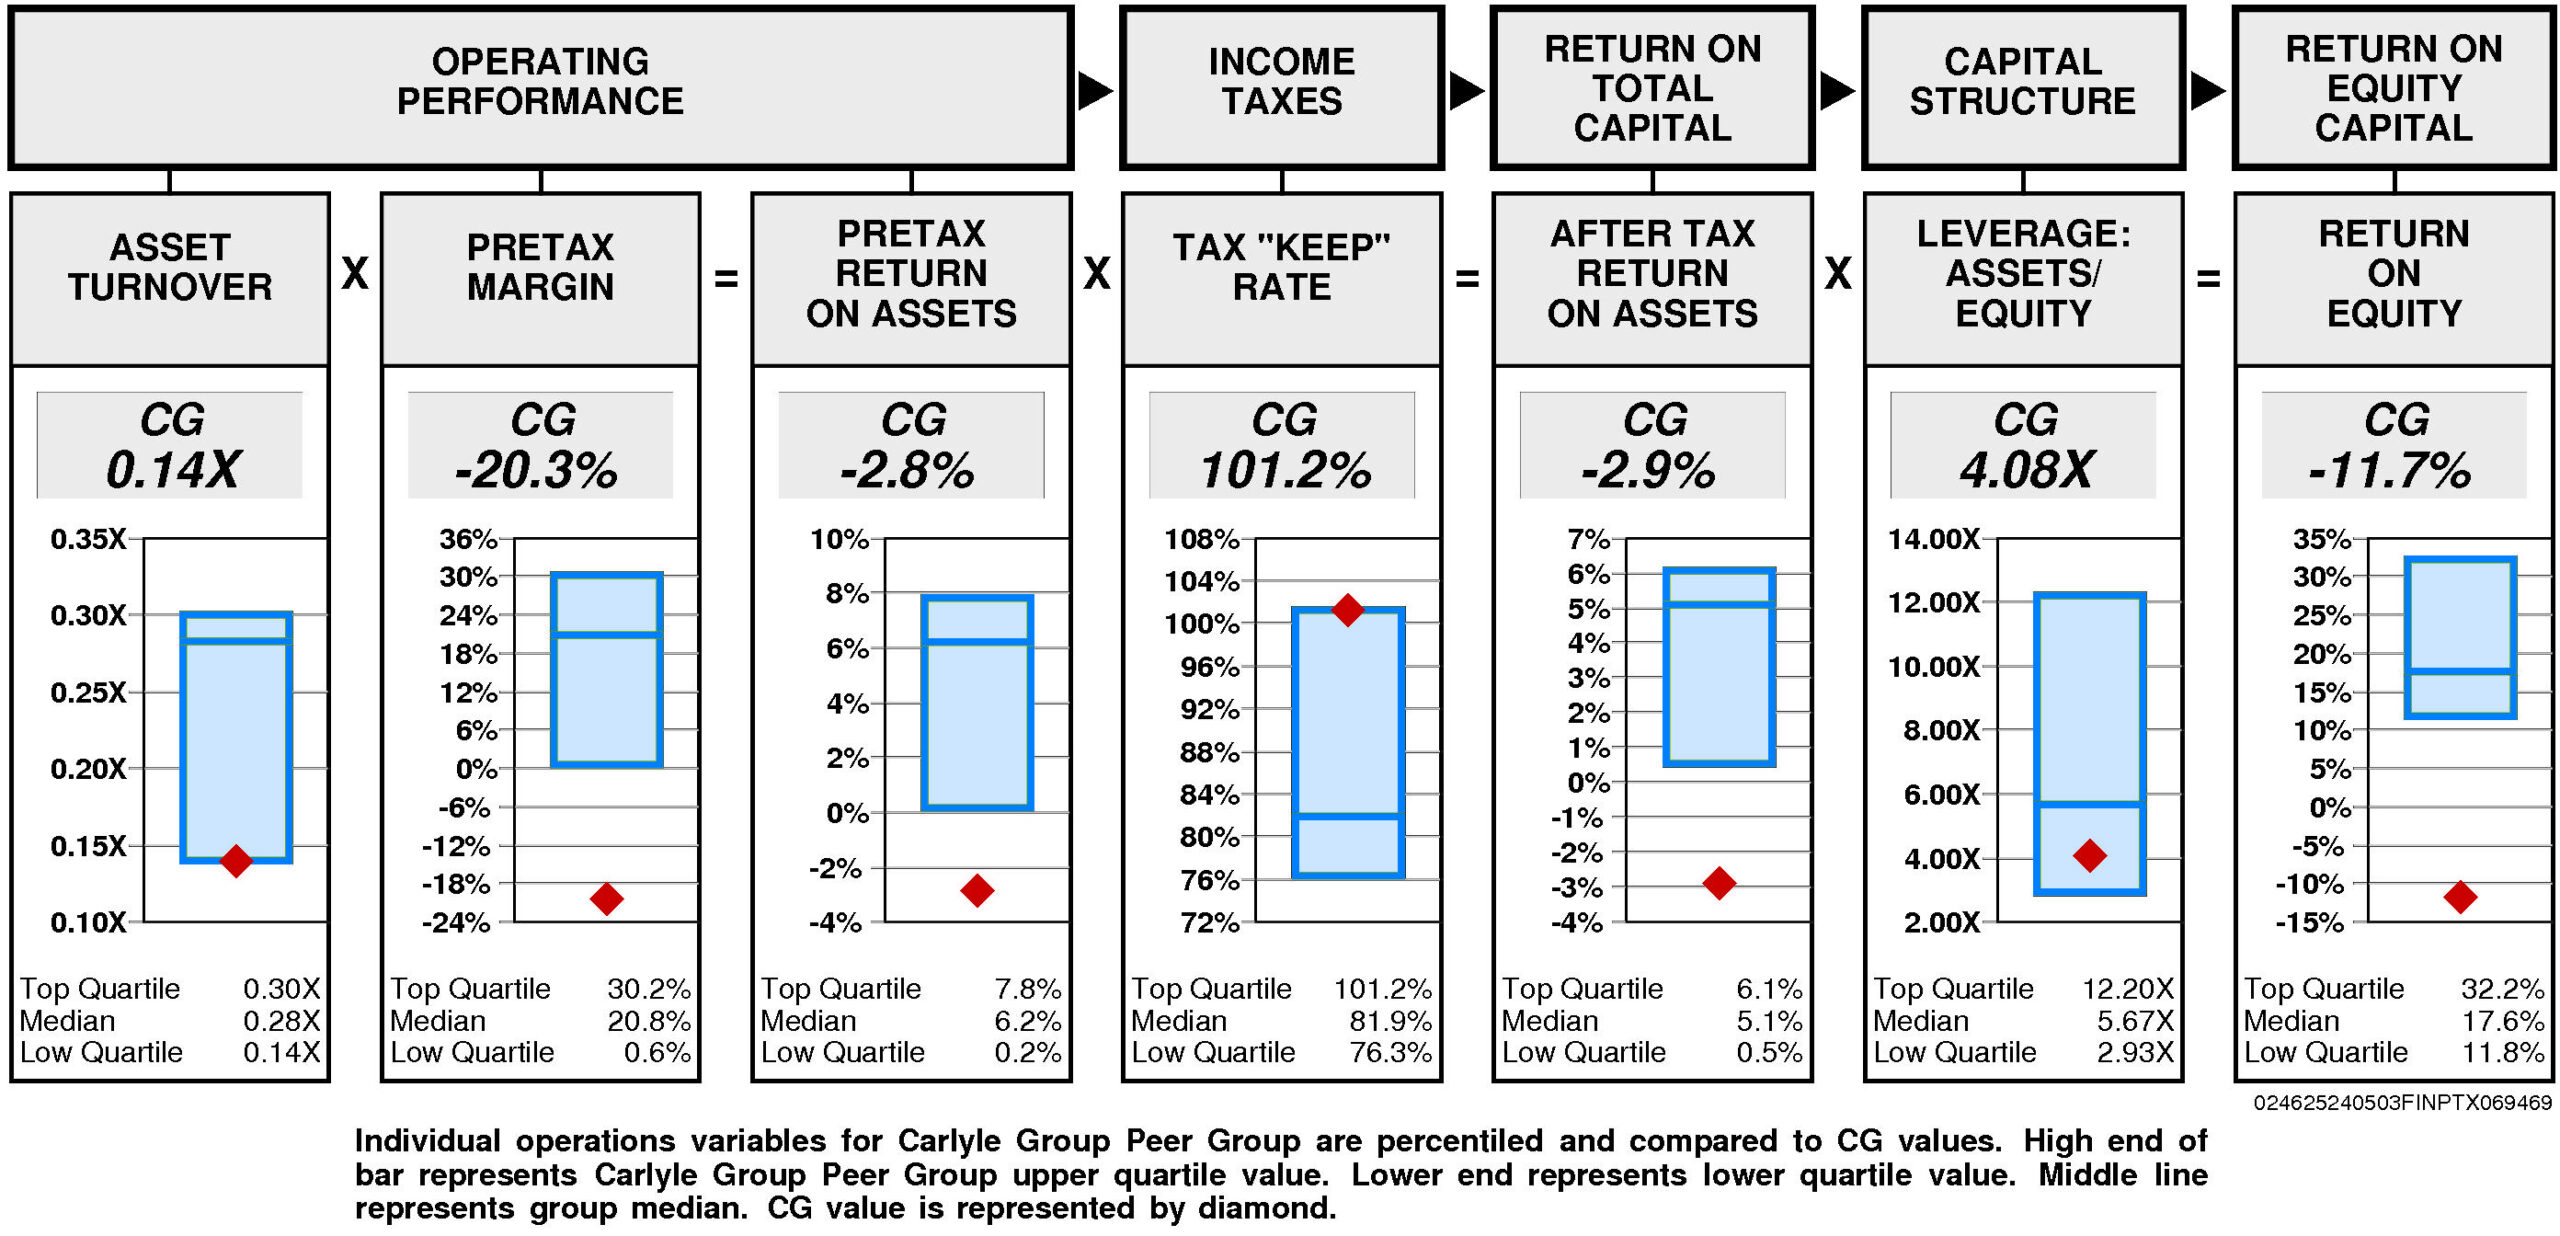
Operating performance (pretax return on assets) is lower quartile (-2.8%) reflecting asset turnover that is at the lower quartile (0.14X) and lower quartile pretax margin (-20.3%).
Tax “keep” rate (income tax management) is at the upper quartile (101.2%) resulting in after tax return on assets that is lower quartile.
Financial leverage (leverage) is below median (4.08X).
GROWTH RATES
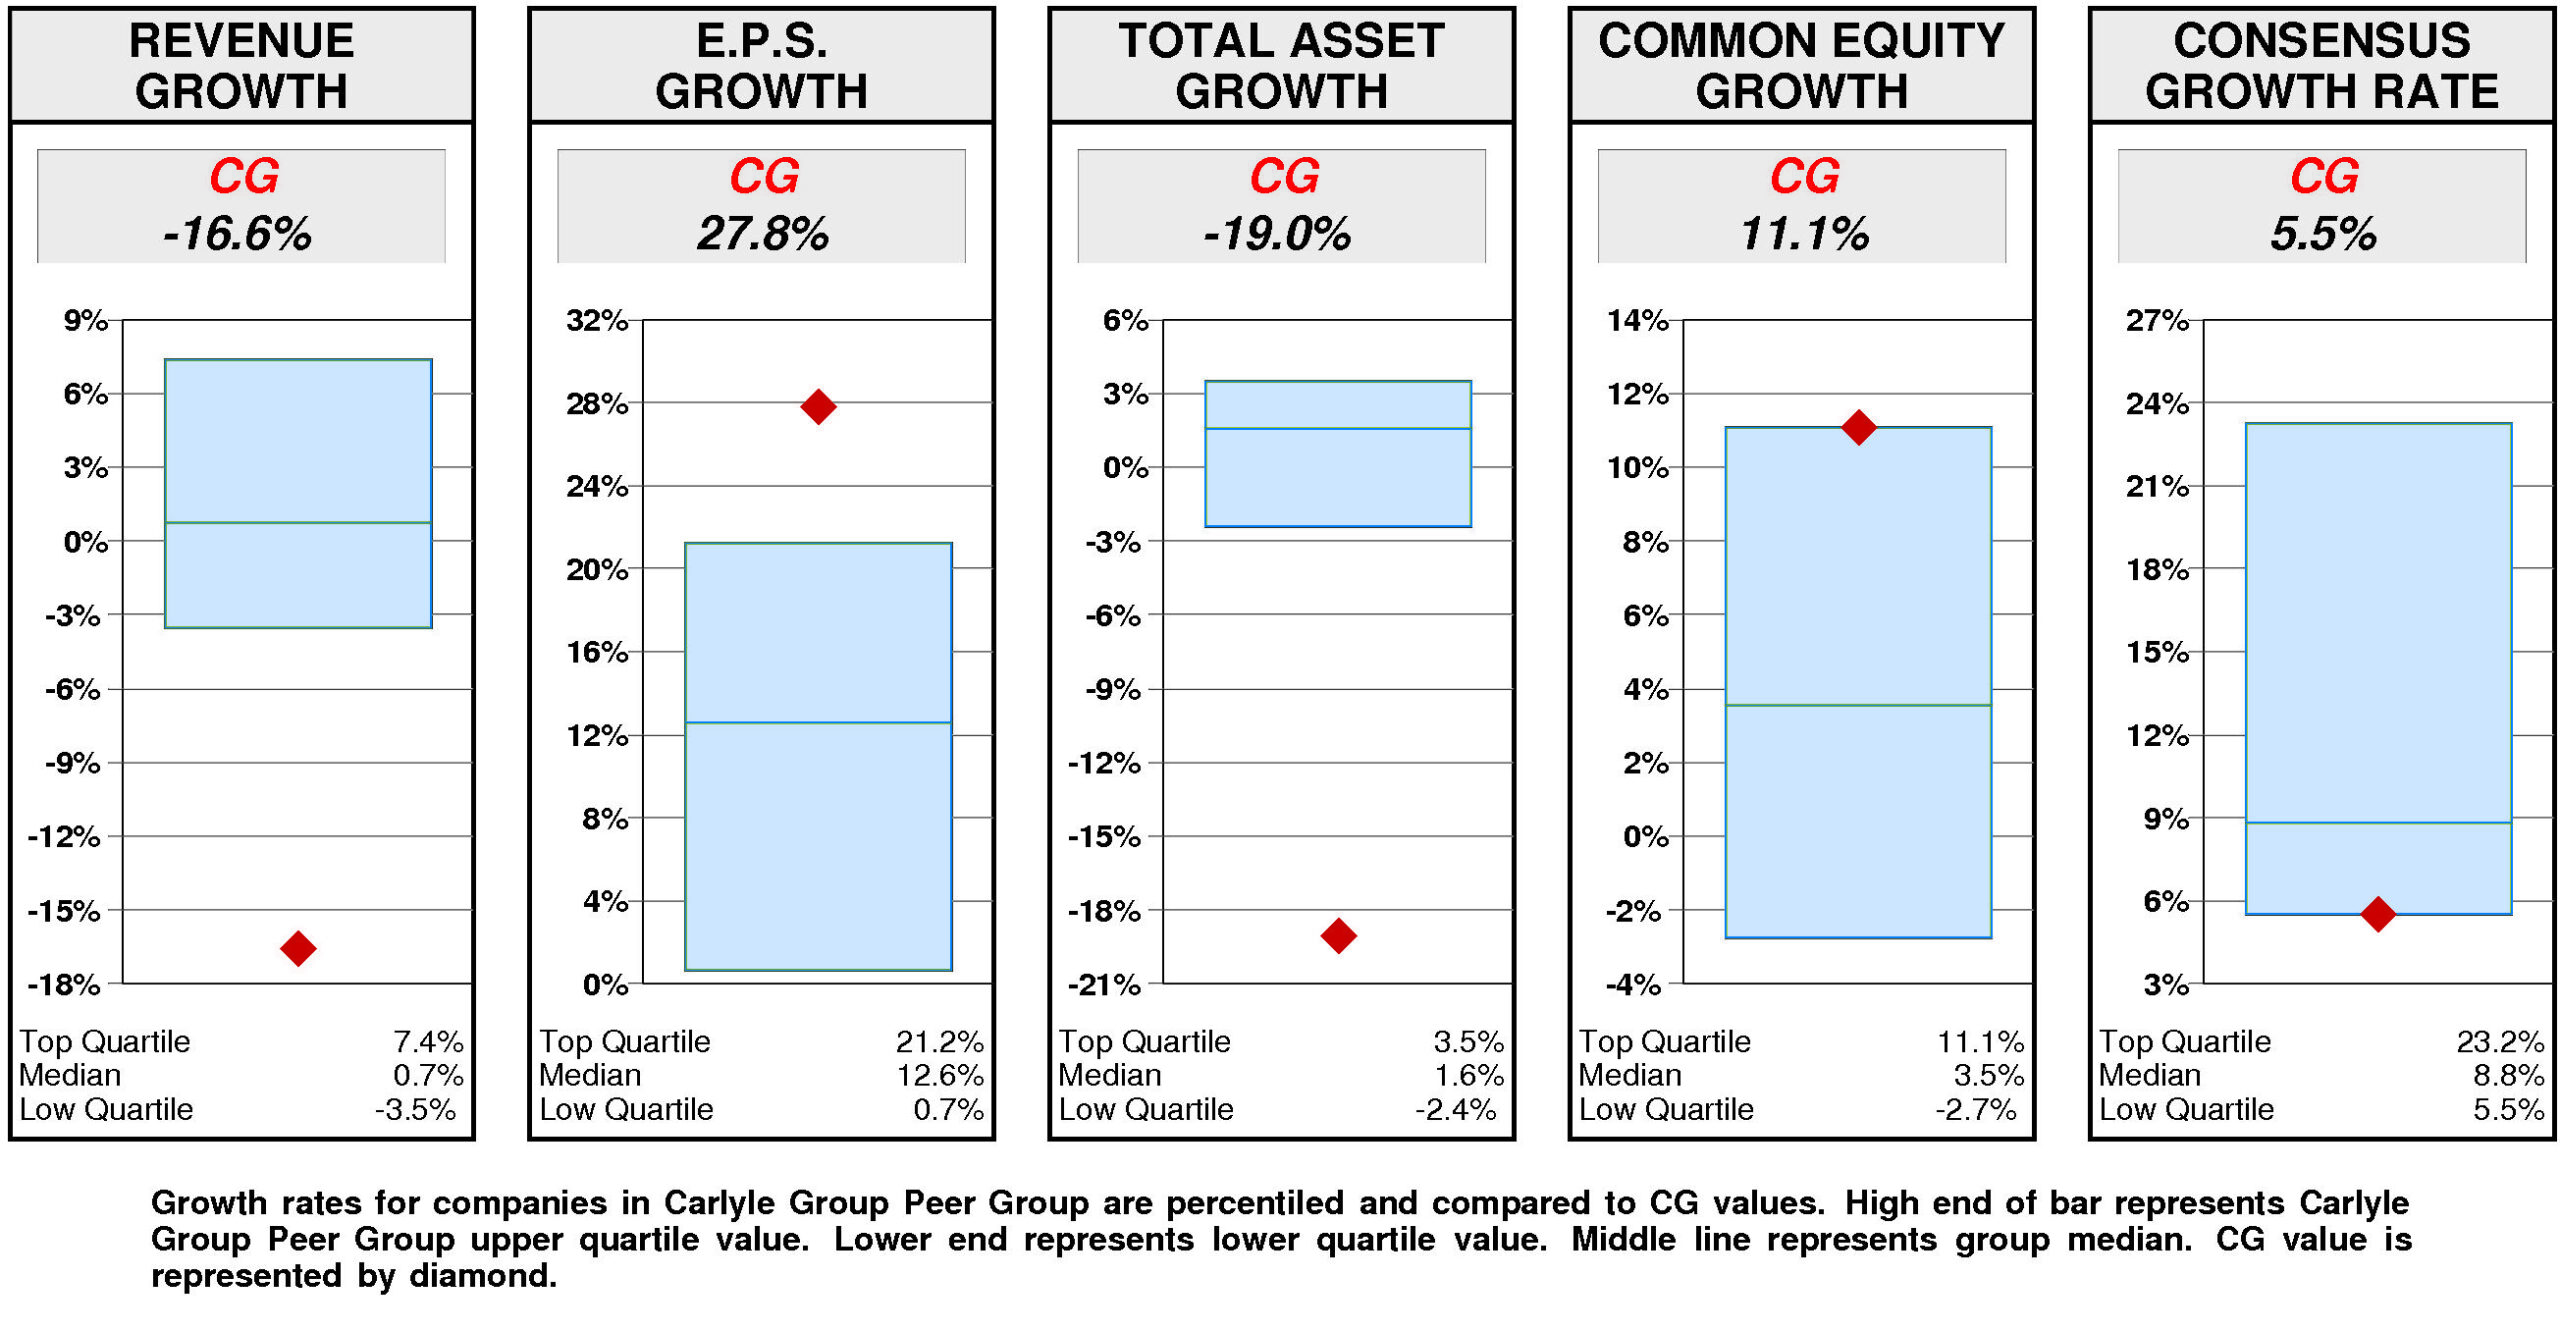
There are no significant differences between Carlyle Group’s longer term growth and growth in recent years.
Carlyle Group’s historical income statement growth and balance sheet growth have diverged. Revenue growth has paralleled asset growth; earnings growth has exceeded equity growth.
Annual revenue growth has been -16.6% per year.
Total asset growth has been -19.0% per year.
Annual E.P.S. growth has been 27.8% per year.
Equity growth has been 11.1% per year.
Carlyle Group’s consensus growth rate forecast (average of Wall Street analysts) is 5.5% — above the average of the historical growth measures.
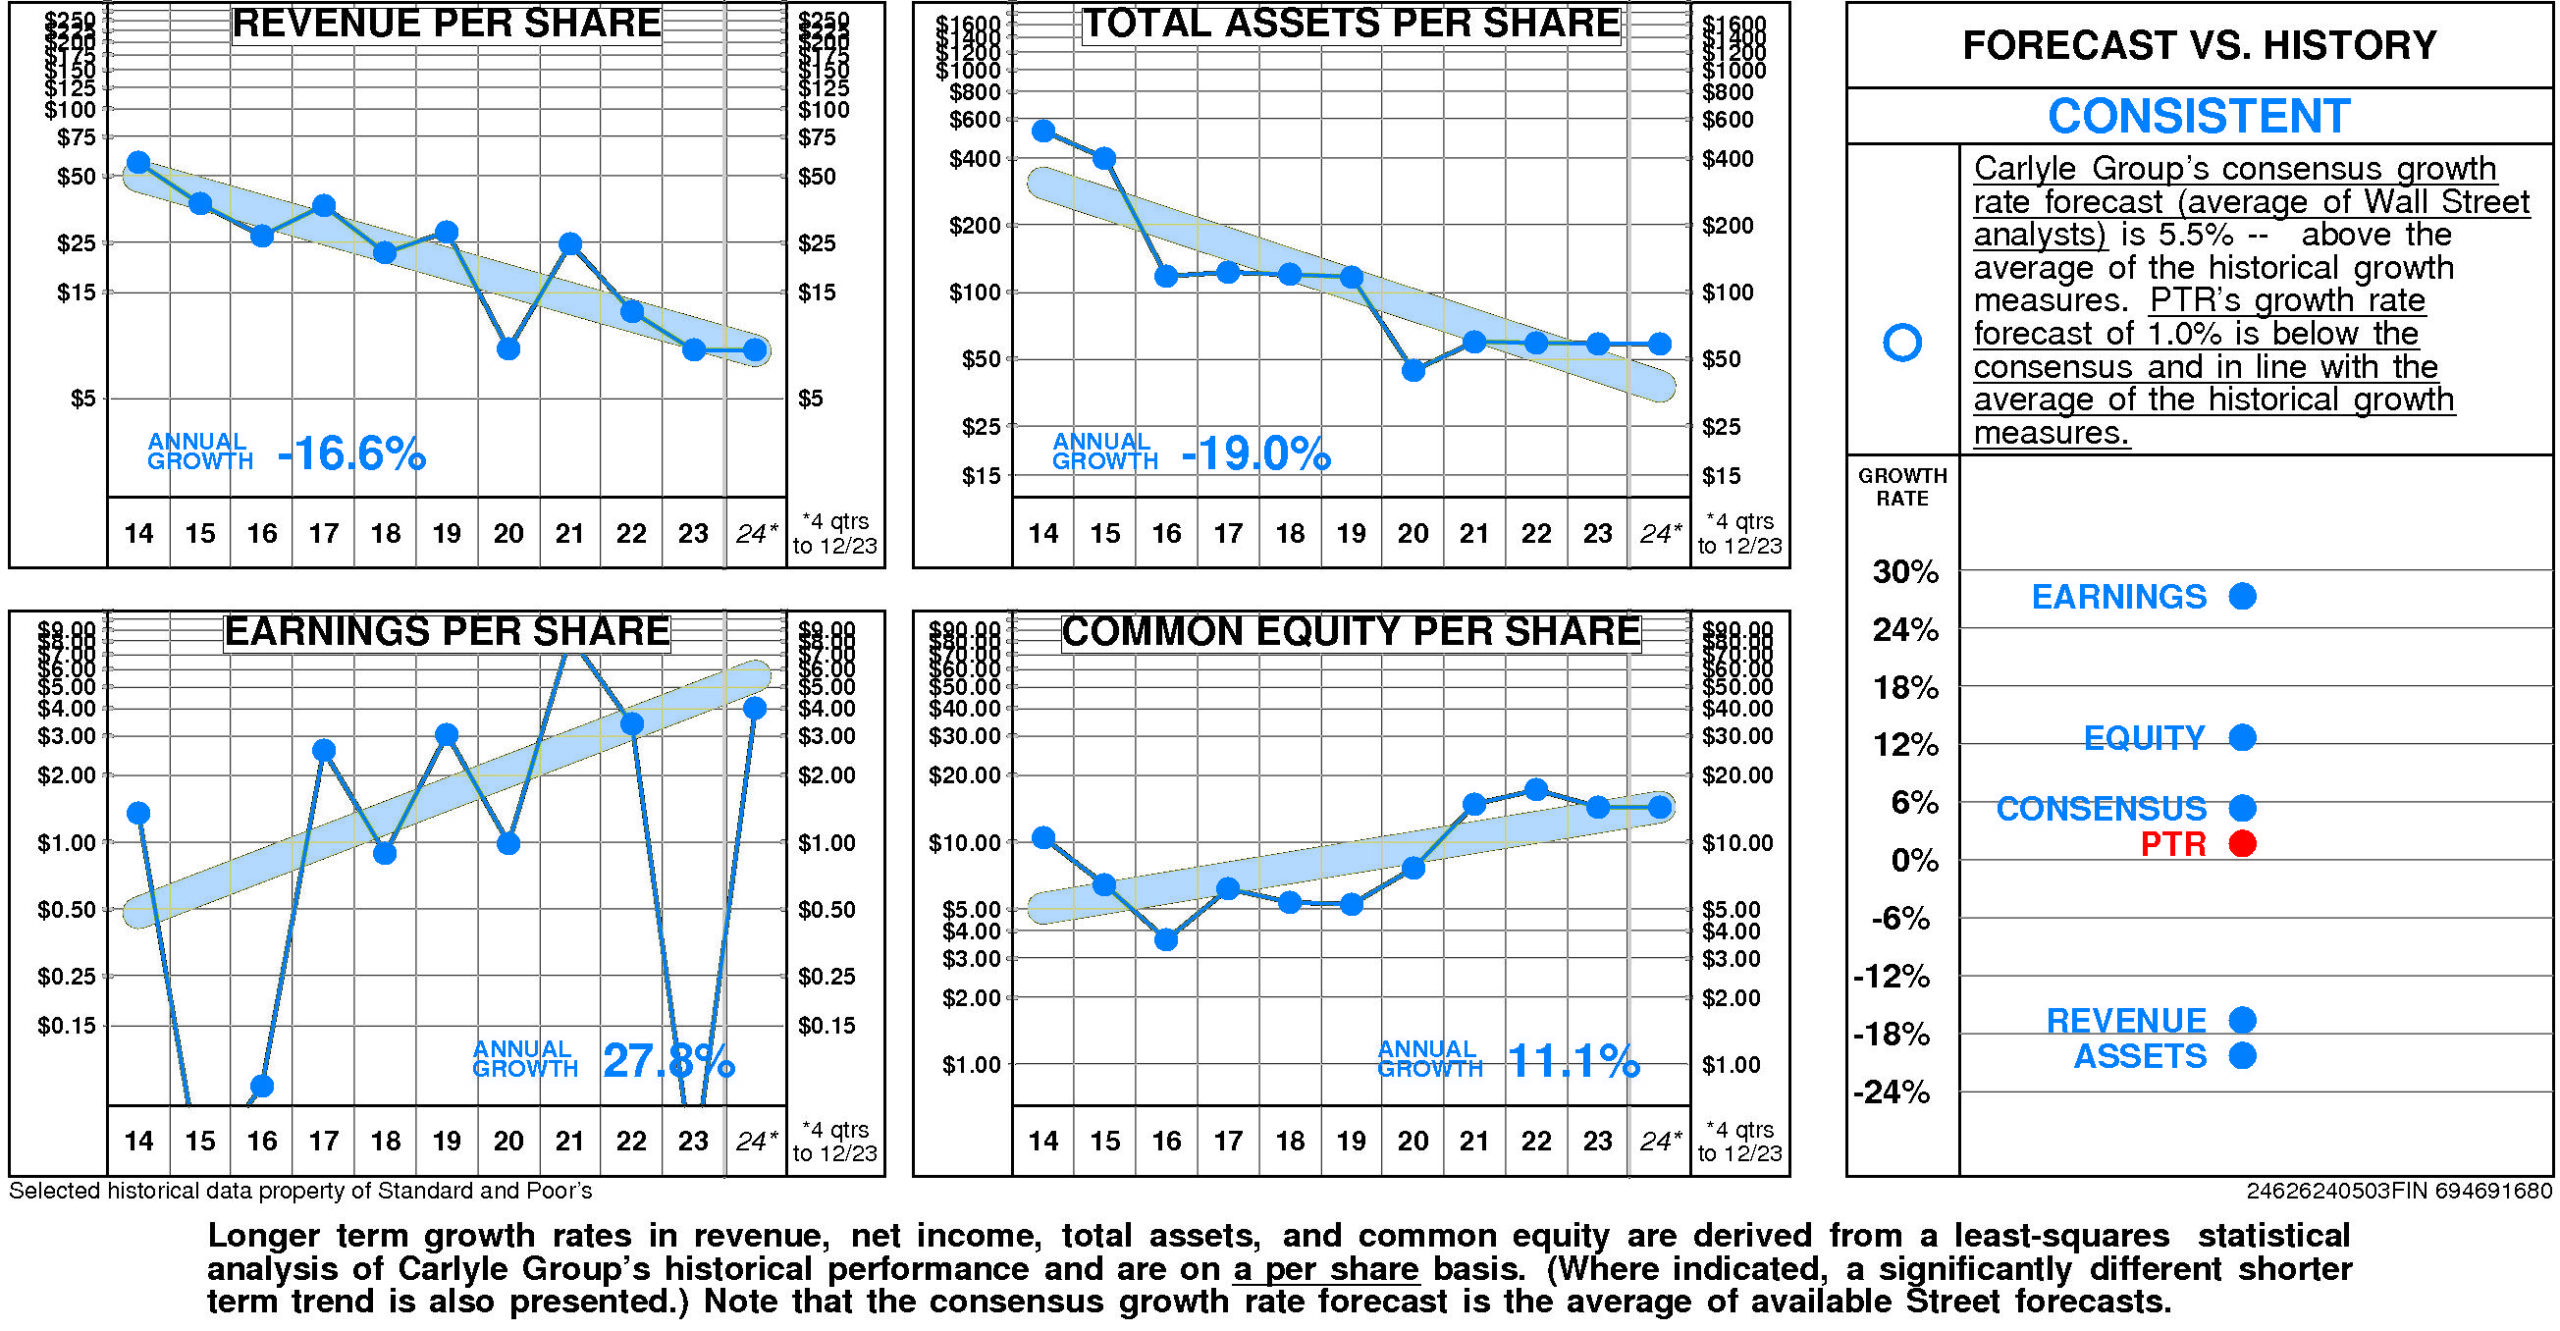
Relative to the Carlyle Group Peer Group, Carlyle Group’s historical growth measures are erratic. E.P.S. growth (27.8%) has been upper quartile. Equity growth (11.1%) has been at the upper quartile. Revenue growth (-16.6%) has been lower quartile. Total asset growth (-19.0%) has been lower quartile.
Consensus growth forecast (5.5%) is at the lower quartile.
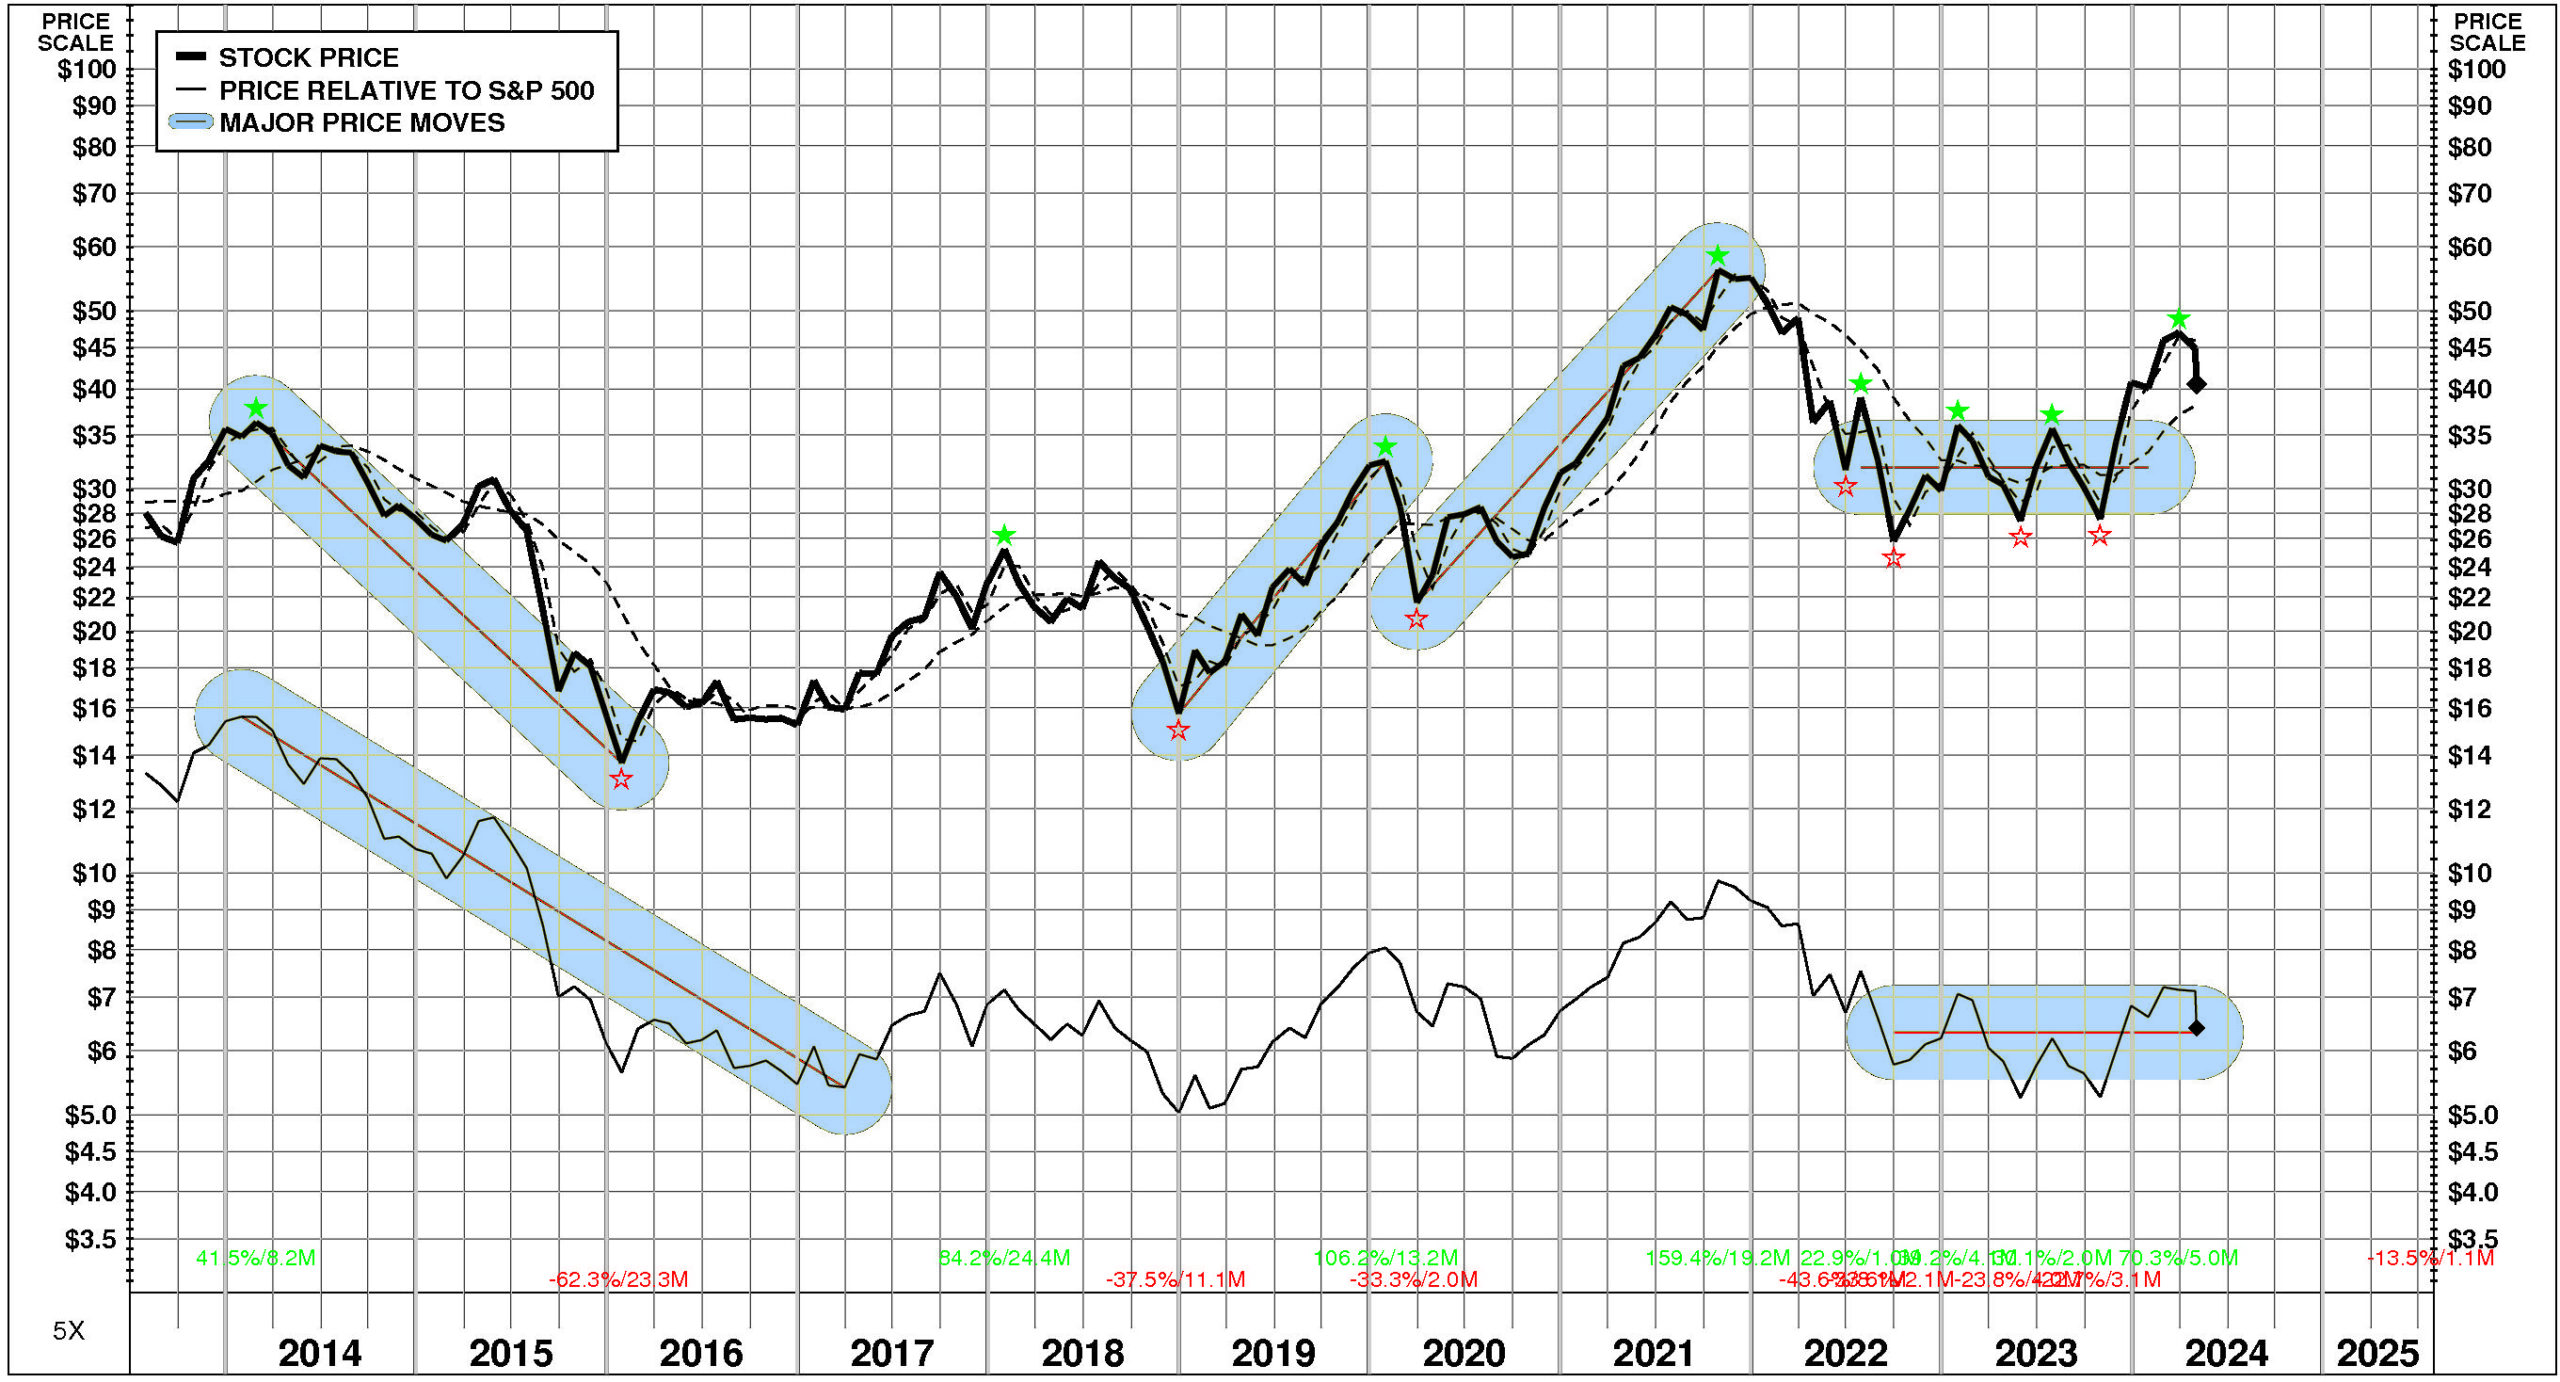
PRICE HISTORY
Over the full time period, Carlyle Group’s stock price performance has been variable and significantly below market. Between July, 2013 and May, 2024, Carlyle Group’s stock price rose +45%; relative to the market, this was a -52% loss. Significant price moves during the period: 1) March, 2020 – October, 2021: +159%; 2) December, 2018 – January, 2020: +106%; and 3) February, 2014 – January, 2016: -62%.
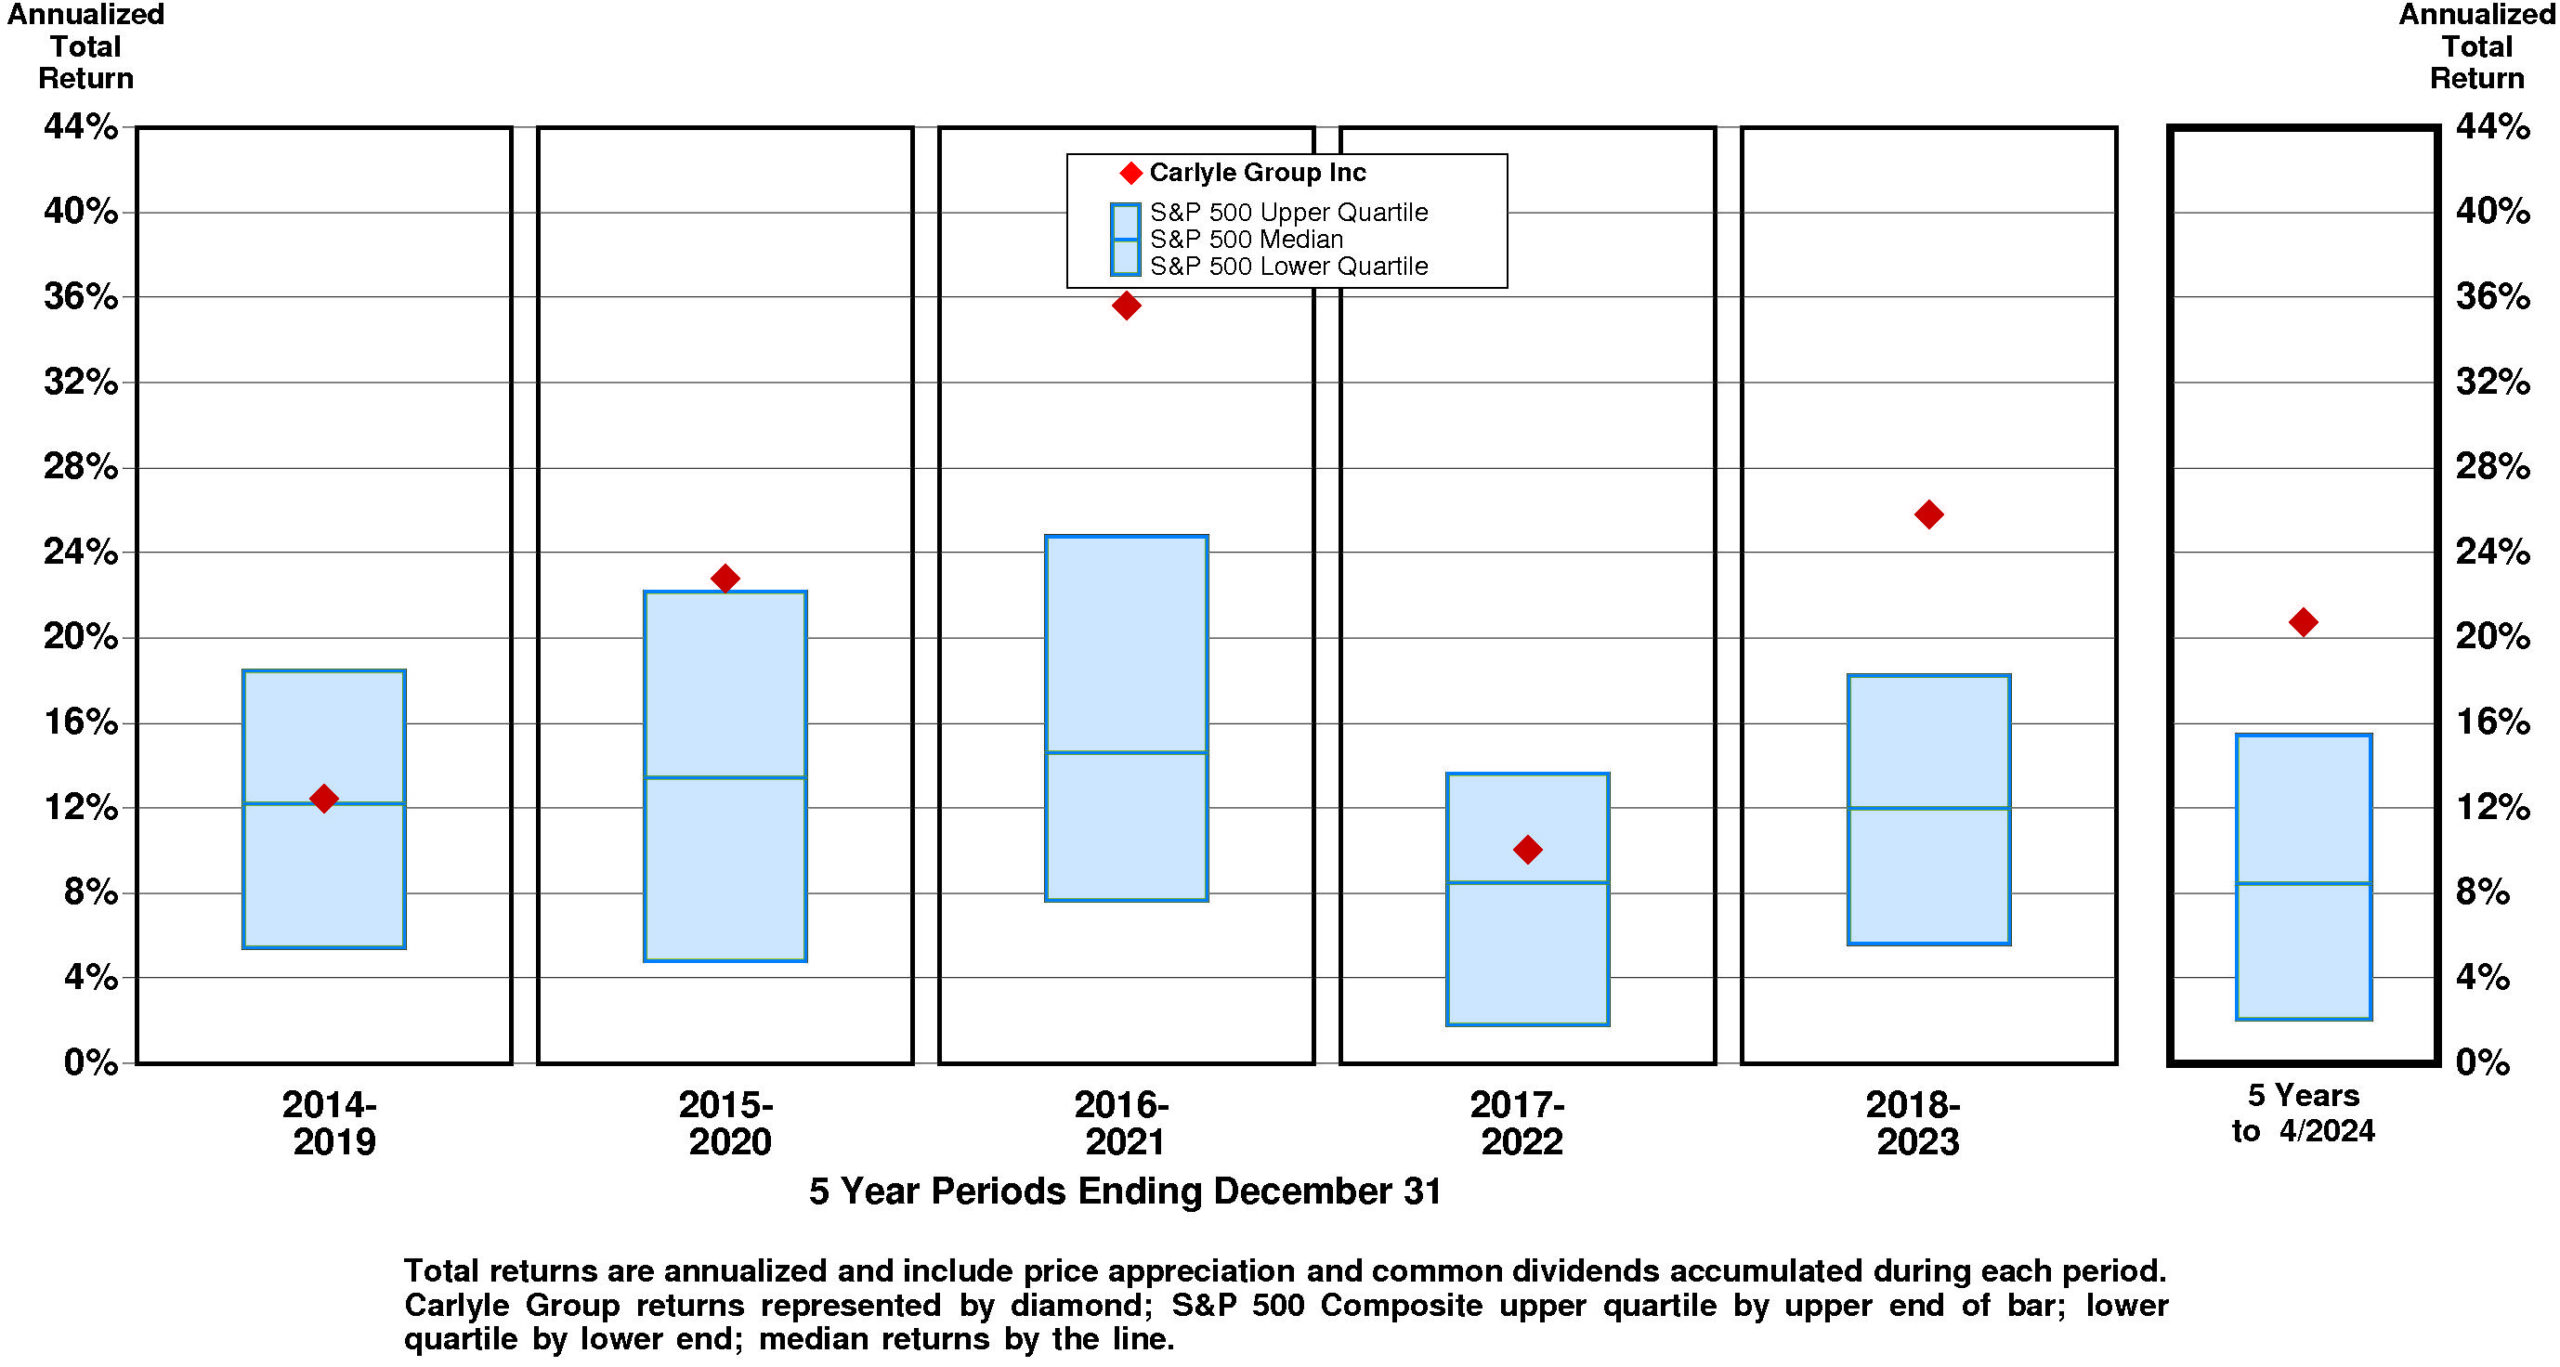
TOTAL INVESTMENT RETURNS
Current annual total return performance of 53.9% is upper quartile relative to the S&P 500 Composite.
In addition to being upper quartile relative to S&P 500 Composite, current annual total return performance through April, 2024 of 53.9% is above median relative to Carlyle Group Inc (The) Peer Group.
Current 5-year total return performance of 20.7% is upper quartile relative to the S&P 500 Composite.
Through April, 2024, with upper quartile current 5-year total return of 20.7% relative to S&P 500 Composite, Carlyle Group’s total return performance is upper quartile relative to Carlyle Group Inc (The) Peer Group.
VALUATION BENCHMARKS
Relative to S&P 500 Composite, CG’s overall valuation is high. Ratio of enterprise value/earnings before interest and taxes is upper quartile. Ratio of enterprise value/revenue is upper quartile. Price/equity ratio is slightly below median. Ratio of enterprise value/assets is below median. Price/earnings ratio is unavailable.
Relative to Carlyle Group Peer Group, CG’s overall valuation is high. Ratio of enterprise value/earnings before interest and taxes is upper quartile. Ratio of enterprise value/revenue is above median. Ratio of enterprise value/assets is above median. Price/equity ratio is slightly below median. Price/earnings ratio is unavailable.
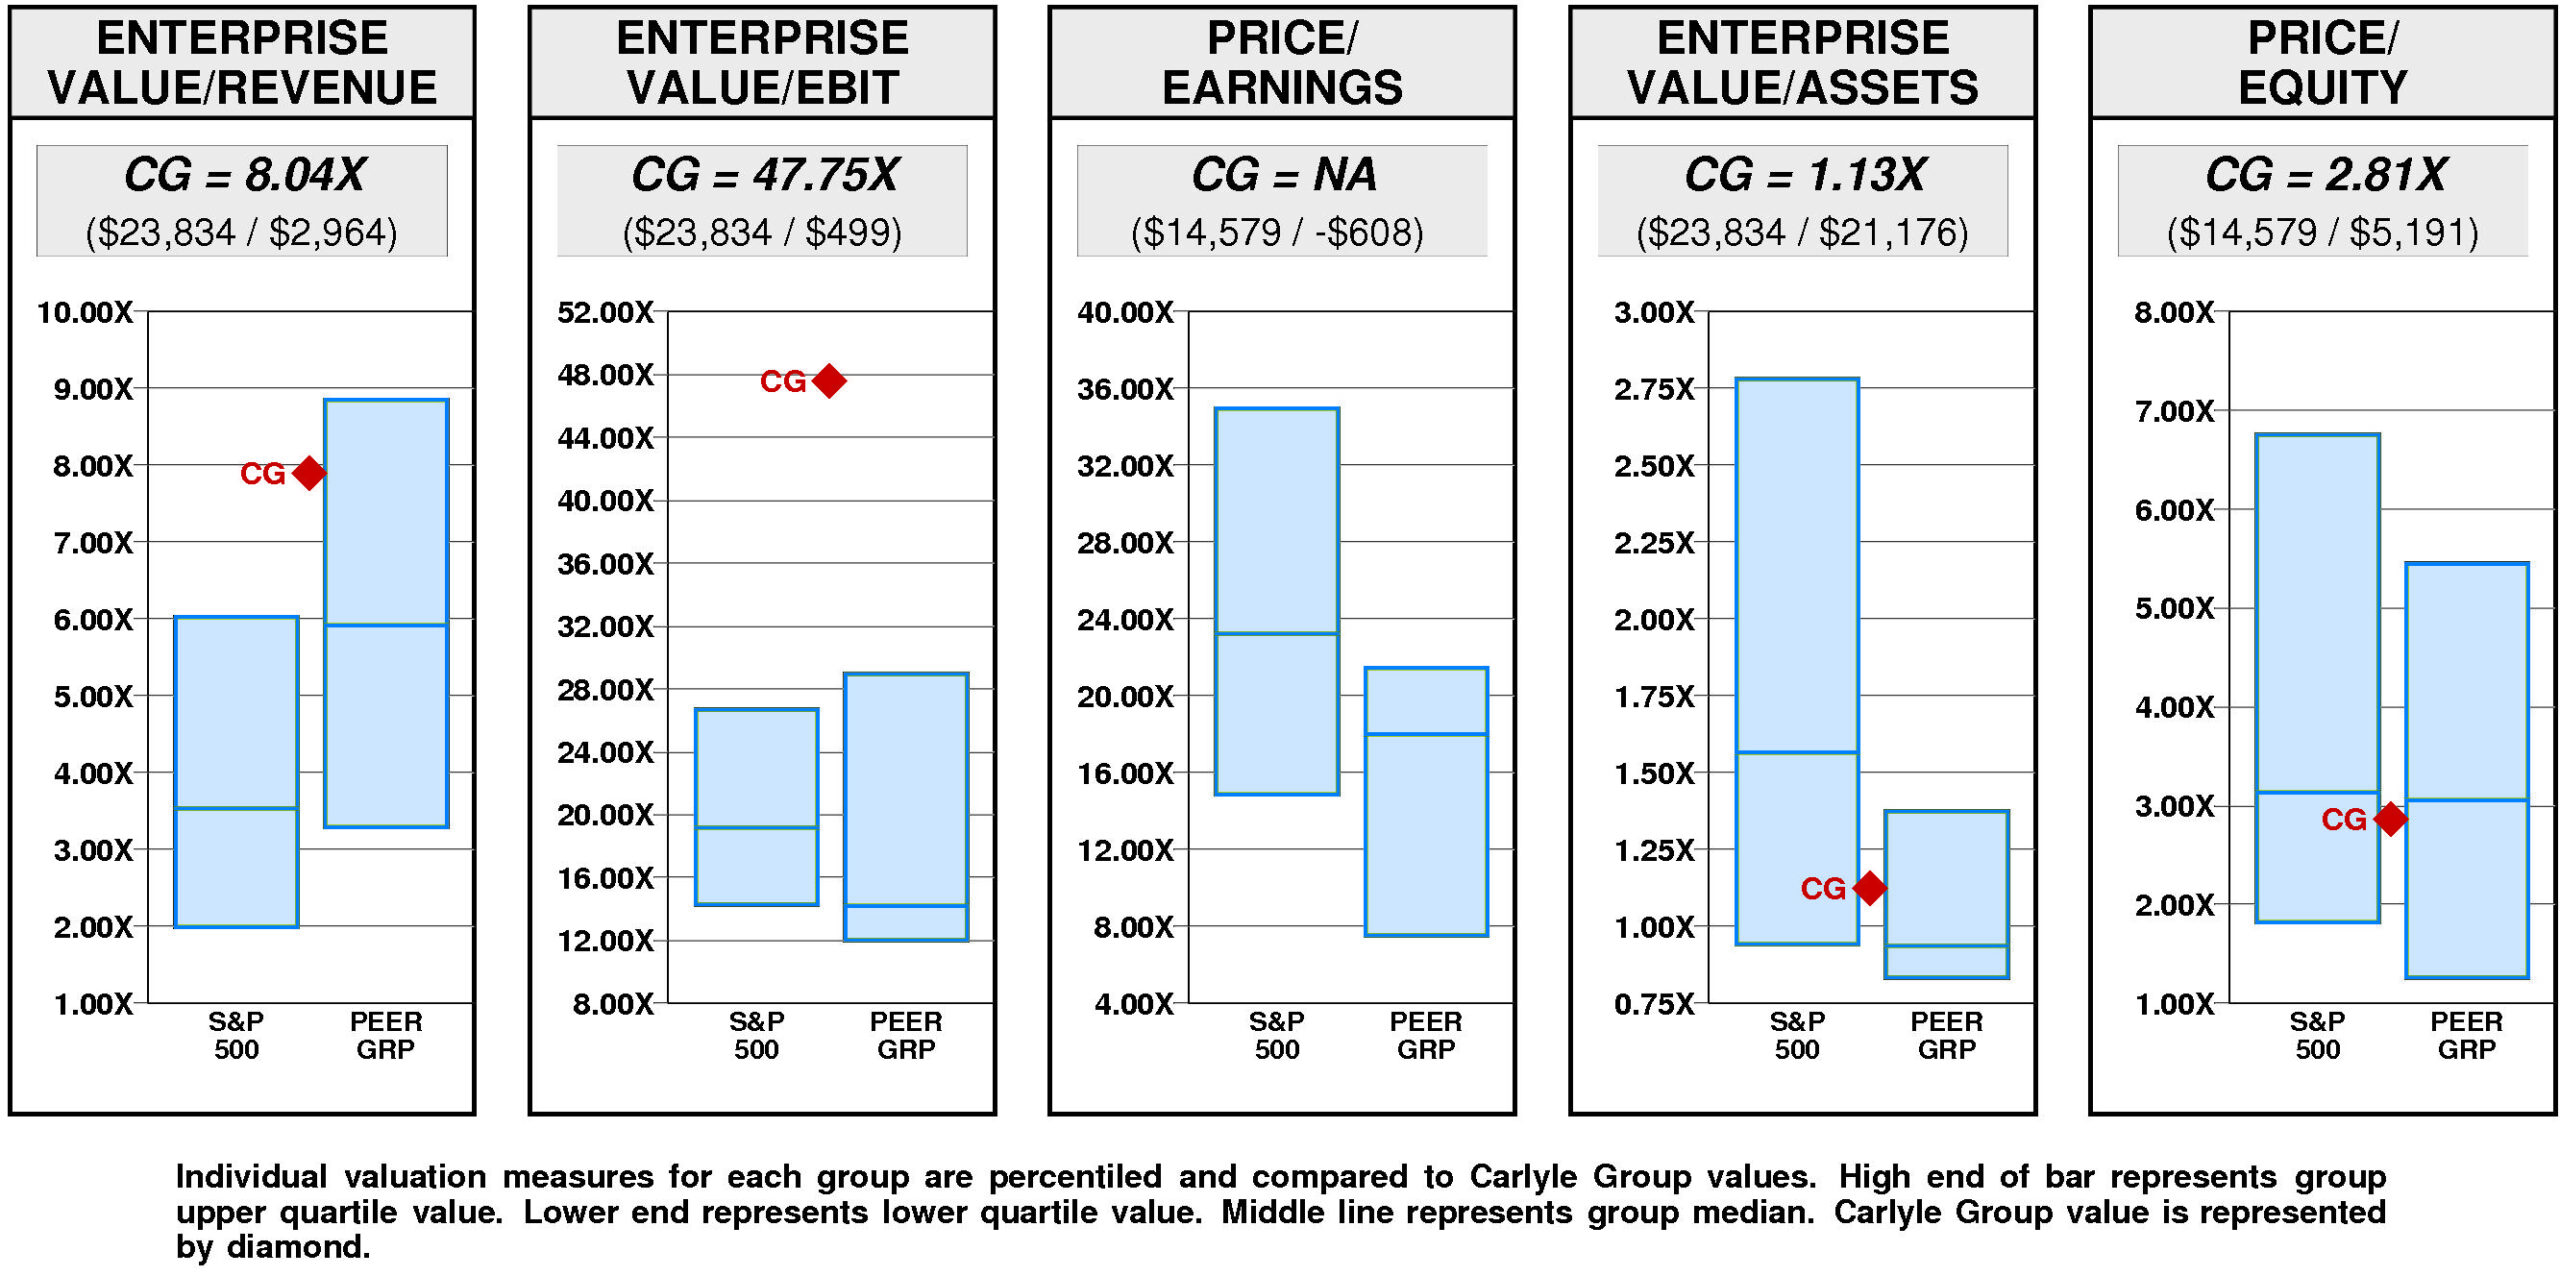
Carlyle Group has a major value gap compared to the median. For CG to achieve median valuation, its current ratio of enterprise value/revenue would have to fall from the current level of 8.04X to 5.92X. If CG’s ratio of enterprise value/revenue were to fall to 5.92X, its stock price would be lower by $-18 to $23.
For CG to achieve upper quartile valuation relative to the Carlyle Group Peer Group, its current ratio of enterprise value/revenue would have to rise from the current level of 8.04X to 8.85X. If CG’s ratio of enterprise value/revenue were to rise to 8.85X, its stock price would increase by $7 from the current level of $41.
VALUE TARGETS
CG is expected to continue to be a major Value Builder reflecting capital returns that are forecasted to exceed the cost of capital.
Carlyle Group’s current Price Target of $50 represents a +22% change from the current price of $40.58.
This moderately low appreciation potential results in an appreciation score of 38 (62% of the universe has greater appreciation potential.)
Notwithstanding this moderately low Appreciation Score of 38, the high Power Rating of 95 results in an Value Trend Rating of B.
Carlyle Group’s current Price Target is $50 (+58% from the 2023 Target of $31 and +22% from the 05/02/24 price of $40.58). This dramatic rise in the Target is the result of a -23% decrease in the equity base and a +105% increase in the price/equity multiple. The forecasted increase in return on equity has a very large positive impact on the price/equity multiple and the forecasted increase in growth has a slight positive impact as well. Partially offsetting these Drivers, the forecasted increase in cost of equity has a large negative impact.
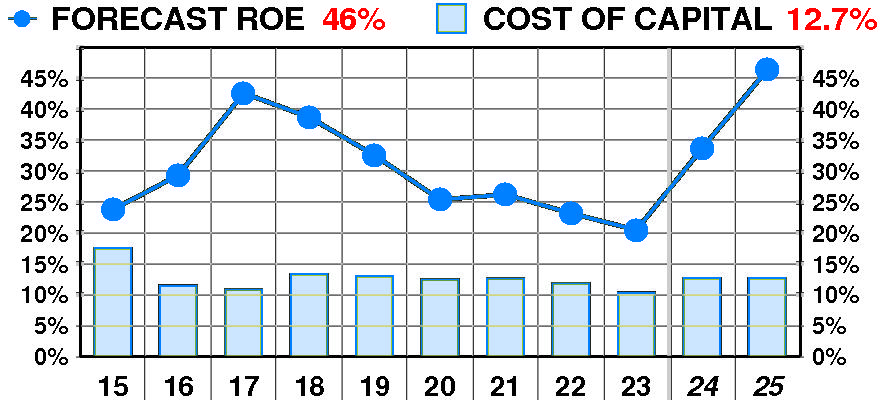
PTR’s return on equity forecast is 46.3% — substantially above our recent forecasts. Forecasted return on equity suffered a dramatic, erratic decline between 2015 and 2023. The current forecast is significantly above the 2015 low of 24%.
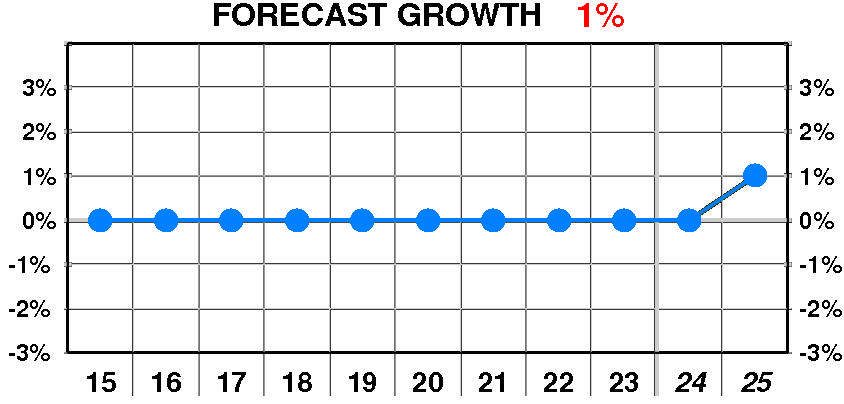
PTR’s growth forecast is 1.0% — in line with our recent forecasts. Forecasted growth erratic between 2015 and 2023. The current forecast is steady at the 2015 peak of 0%.
PTR’s cost of equity forecast is 12.7% — slightly above recent levels. Forecasted cost of equity enjoyed a dramatic, erratic decline between 2015 and 2023. The current forecast is below the 2015 peak of 17.5%.
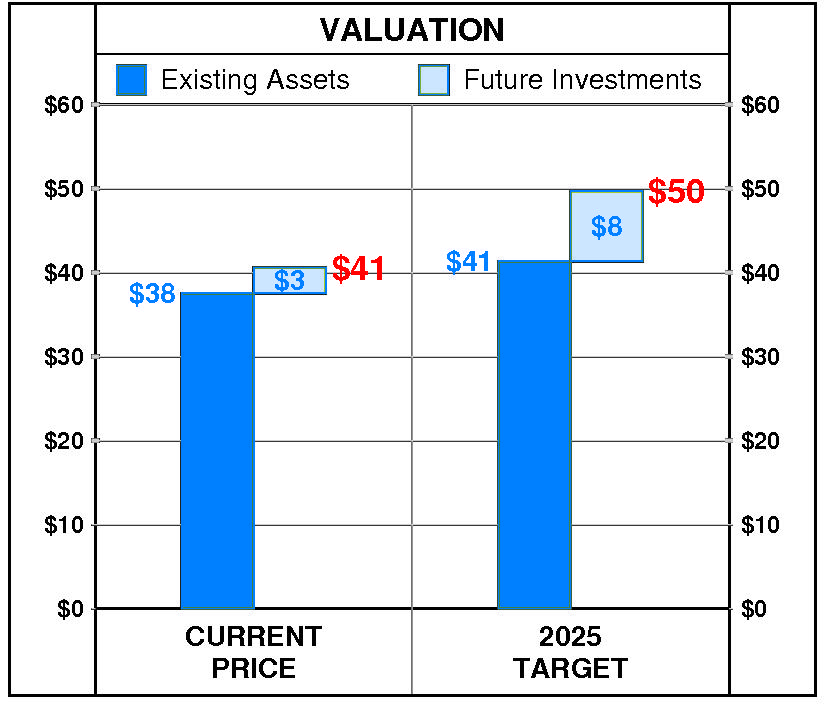
At Carlyle Group’s current price of $40.58, investors are placing a positive value of $3 on its future investments. This view is consistent with the company’s most recent performance that reflected a growth rate of 0.0% per year, and a return on equity of 20.5% versus a cost of equity of 10.3%.
PTR’s 2025 Price Target of $50 is based on these forecasts and reflects an estimated value of existing assets of $41 and a value of future investments of $8.
Be the first to comment