![]()
BUSINESS
Proto Labs, Inc., together with its subsidiaries, operates as an e-commerce driven digital manufacturer of custom prototypes and on-demand production parts in the worldwide. The company offers injection molding; computer numerical control machining; three-dimensional (3D) printing, which include stereolithography, selective laser sintering, direct metal laser sintering, multi jet fusion, polyjet, and carbon DLS processes; and sheet metal fabrication products, including quick-turn and e-commerce-enabled custom sheet metal parts. It serves developers and engineers, who use 3D computer-aided design software to design products across a range of end markets. The company was incorporated in 1999 and is headquartered in Maple Plain, Minnesota.
INVESTMENT RATING
With future capital returns forecasted to be above the cost of capital, PRLB is expected to be a modest Value Builder.
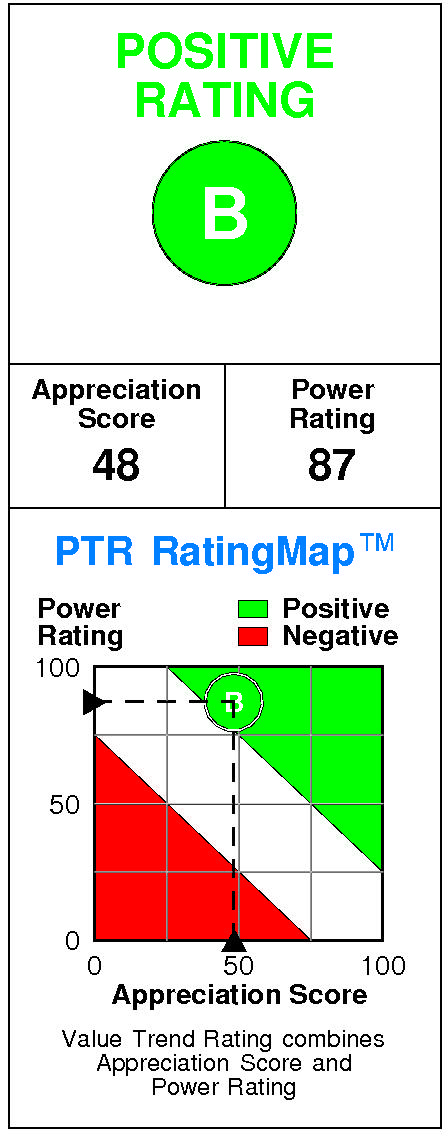
Proto Labs has a current Value Trend Rating of B (Positive).
With this rating, PTR’s two proprietary measures of a stock’s current attractiveness are providing inconsistent signals. Proto Labs has a neutral Appreciation Score of 48 but a very high Power Rating of 87, resulting in the Positive Value Trend Rating.
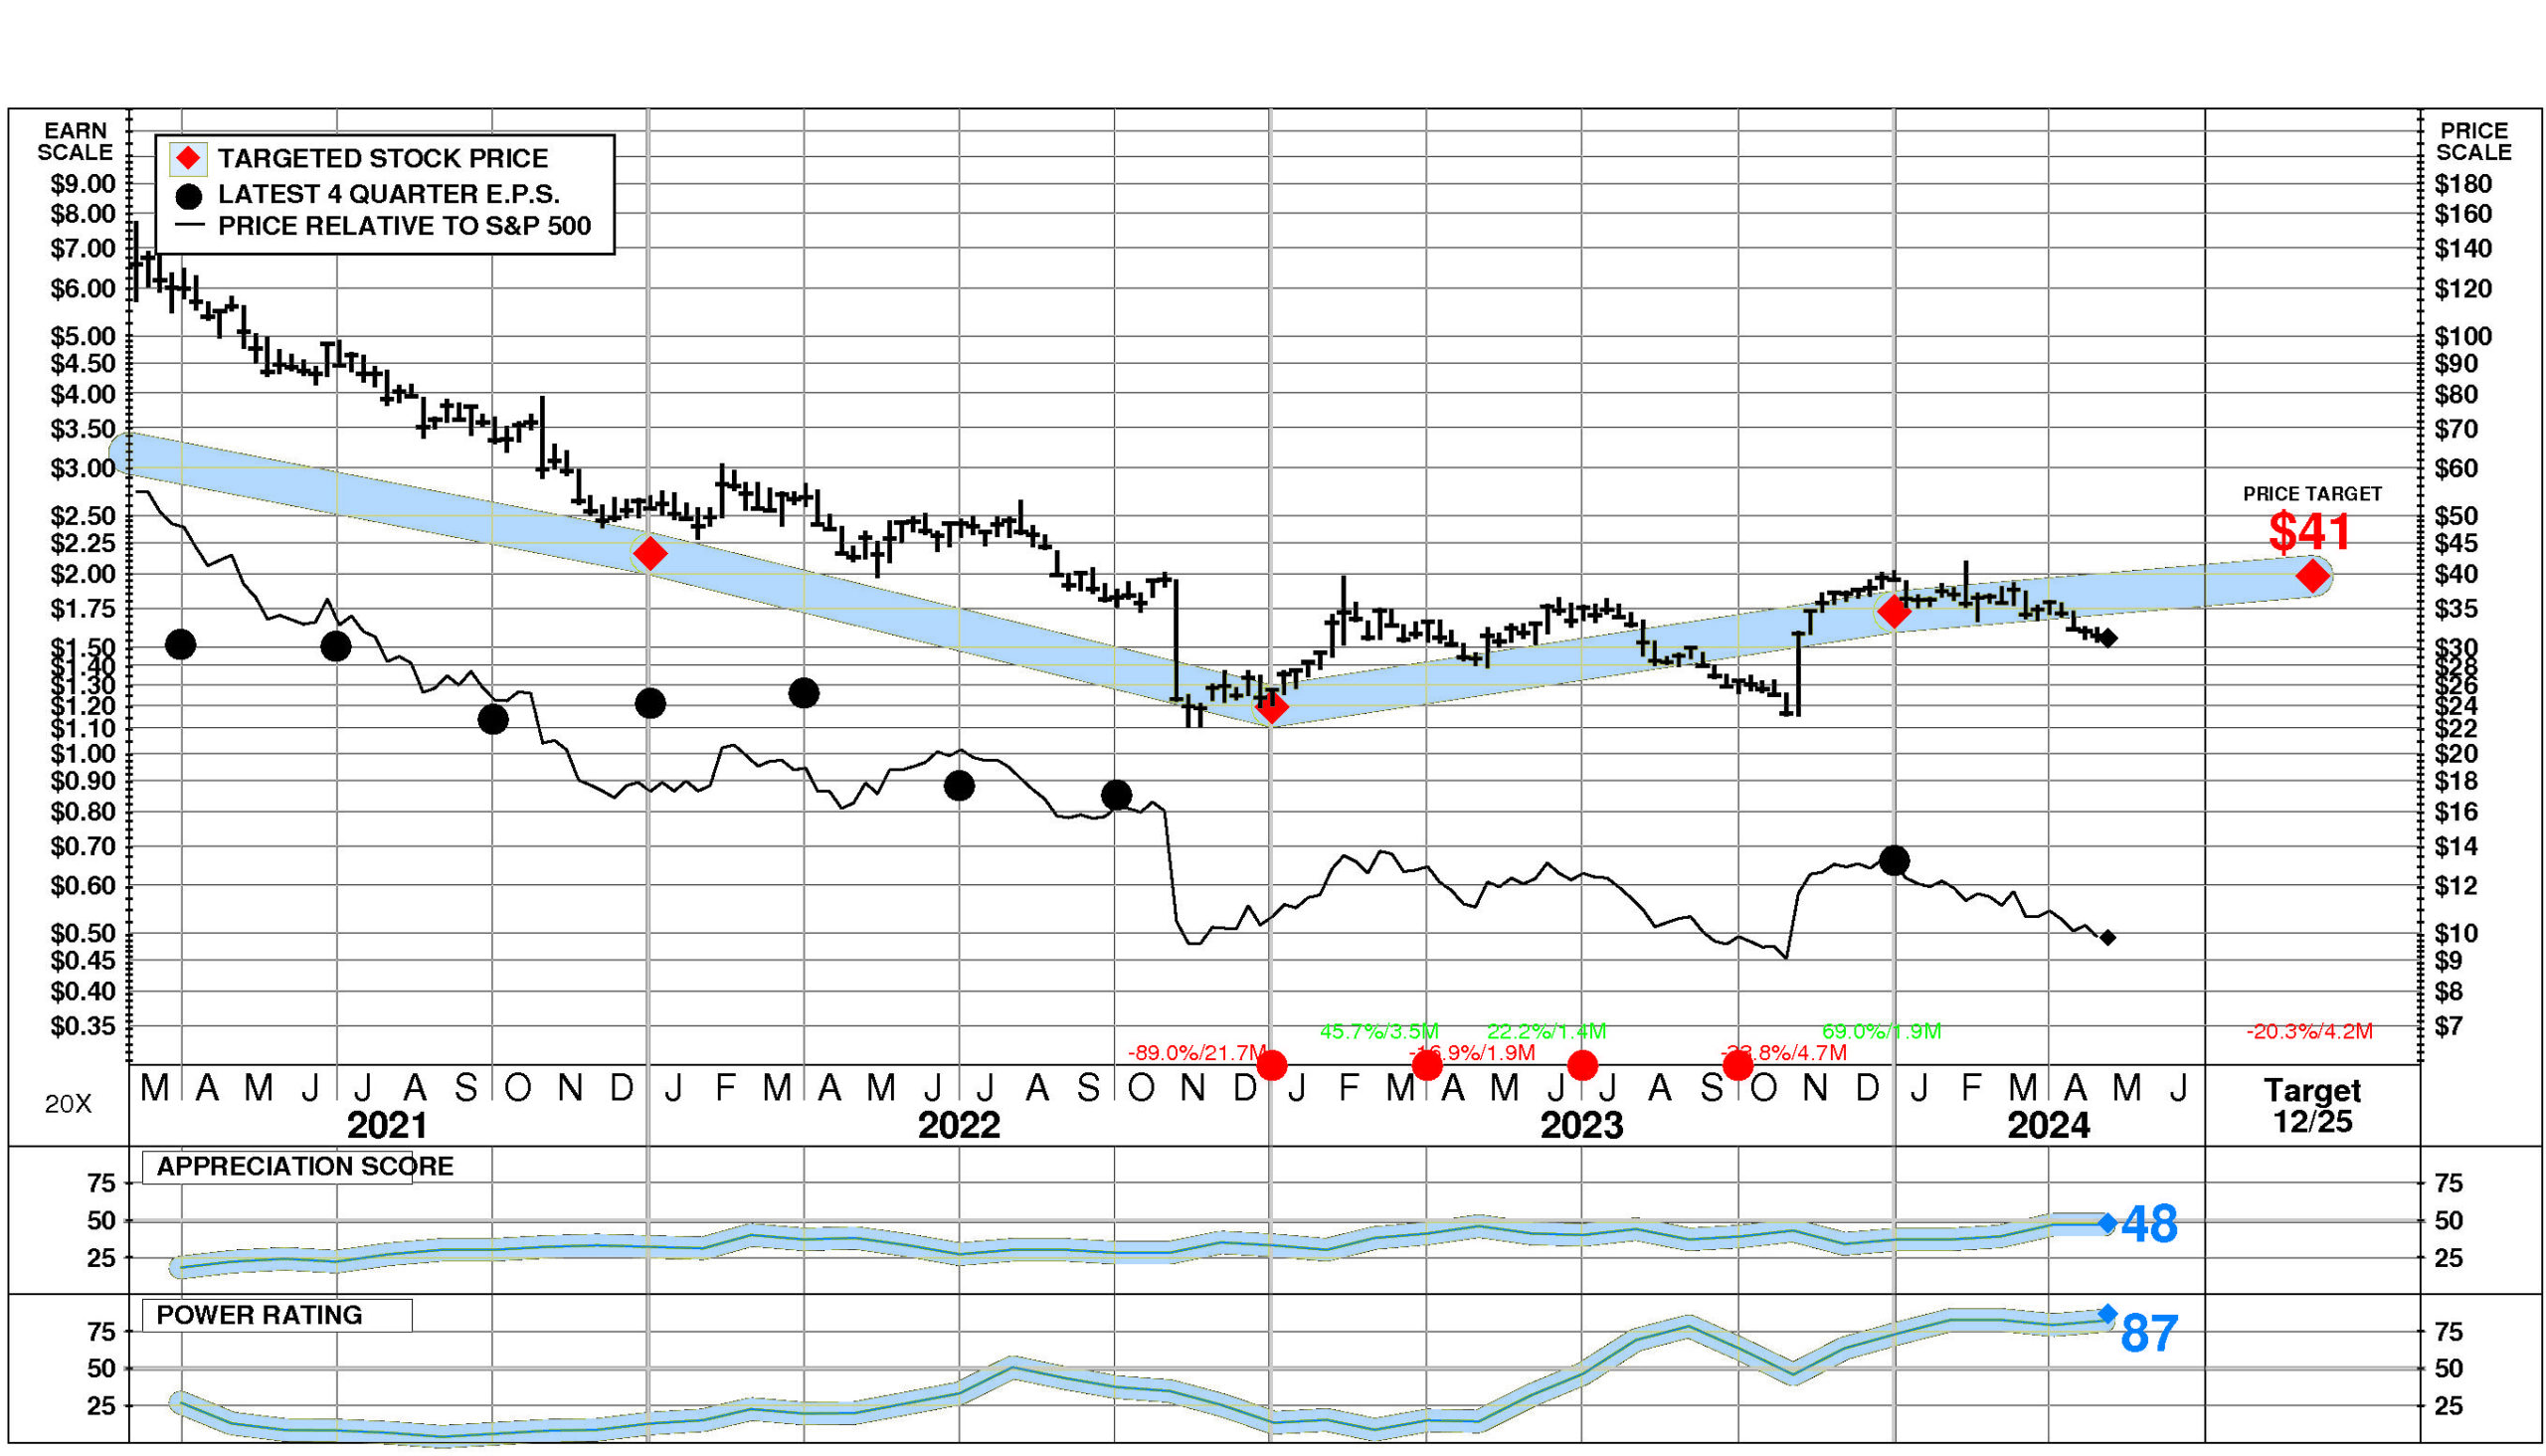
Proto Labs’ stock is selling well below targeted value. The current stock price of $31.14 compares to targeted value 12 months forward of $40.
This neutral appreciation potential results in an appreciation score of 48 (52% of the universe has greater appreciation potential.)
Proto Labs has a Power Rating of 87. (PRLB’s very high Power Rating indicates that it has a higher likelihood of achieving favorable investment performance over the near to intermediate term than all but 13% of companies in the universe.)
Factors contributing to this very high Power Rating include: the recent trend in PRLB’s earnings estimates has been extremely favorable; recent price action has been favorable; and the Special Industry Machinery, NEC comparison group is currently in a modestly favorable position.
INVESTMENT PROFILE
Proto Labs’ financial strength is high. Financial strength rating is 74.
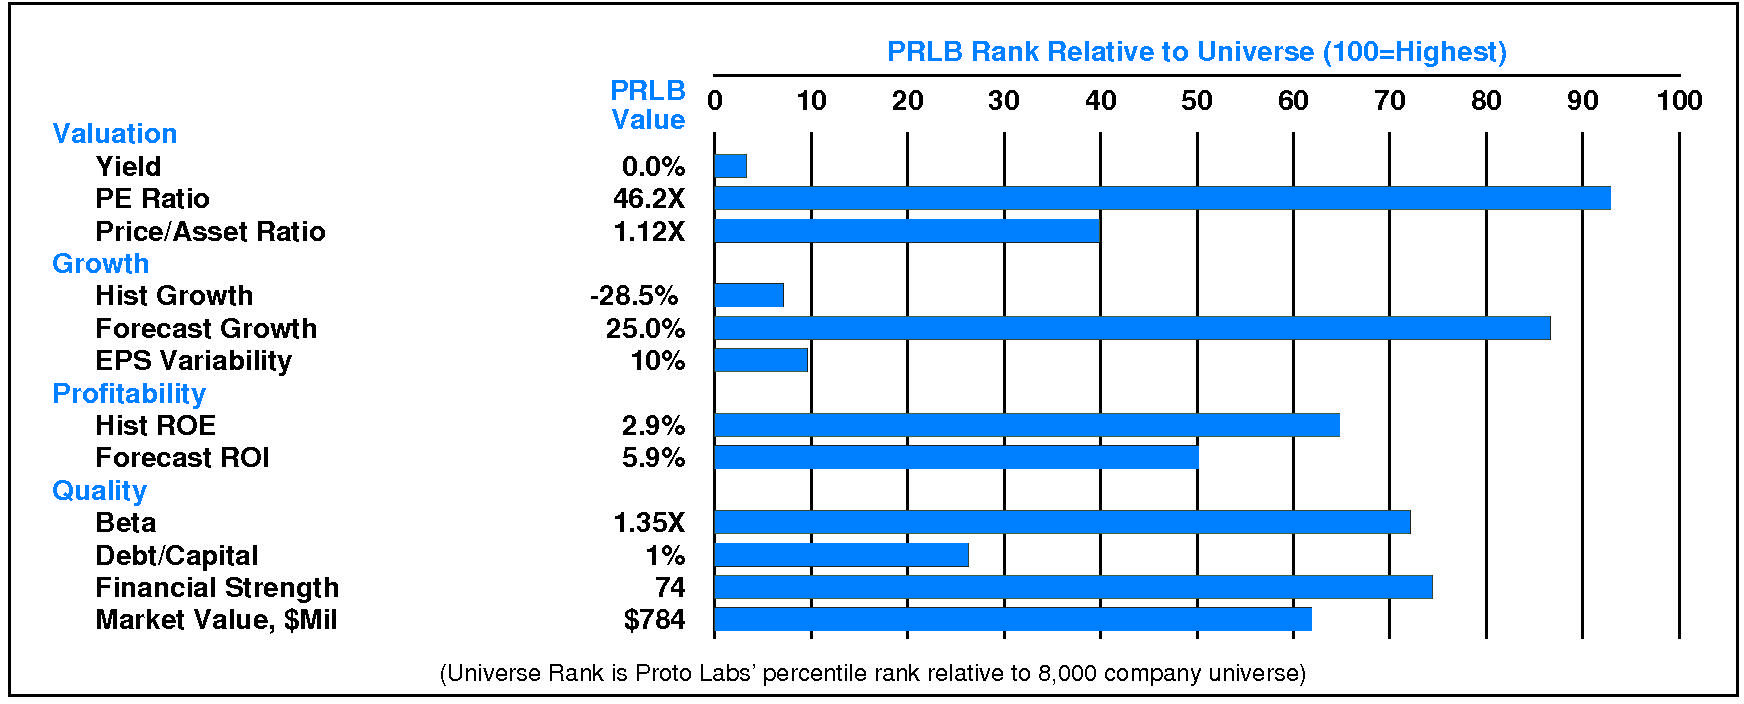
Relative to the S&P 500 Composite, Proto Labs Inc has slightly more Value than Growth characteristics; its appeal is likely to be to Capital Gain-oriented investors; the perception is that PRLB is lower risk. Relative weaknesses include: low forecasted profitability, low historical profitability, high stock price volatility, and low historical growth. Proto Labs’ valuation is moderate: low dividend yield, moderate P/E ratio, and low price/book ratio. PRLB has unusually low market capitalization.
CURRENT SIGNALS
Proto Labs’ current operations are eroding. Return on equity is falling, reflecting: declining pretax margin; falling tax keep rate; and falling leverage.
Proto Labs’ current technical position is very weak. The stock price is in a 4.2 month down move. The stock has declined 16.8% from its prior high. The stock price is below its 200 day moving average which is in a downtrend.
ALERTS
Slight positive changes in fundamentals have recently occurred for Proto Labs Inc (NYSE: PRLB): significant quarterly earnings acceleration occurred.
The stock is currently rated B.
Proto Labs Inc (NYSE: PRLB) stock increased 1.3% on 5/2/24. The shares closed at $31.14. Trading volume in this advance was normal. The stock has been exceptionally strong relative to the market over the last nine months but has declined -2.5% during the last week.
CASH FLOW
In 2023, Proto Labs generated a very significant increase in cash of +$22.68 million (+28%). Sources of cash were much larger than uses. Cash generated from 2023 EBITDA totaled +$65.91 million. Non-operating uses consumed -$0.43 million (-1% of EBITDA). Cash taxes consumed -$18.31 million (-28% of EBITDA). Withdrawal of investment from the business totaled +$10.95 million (+17% of EBITDA). On a net basis, debt investors pulled out -$15.87 million (-24% of EBITDA) while equity investors removed -$19.57 million (-30% of EBITDA).
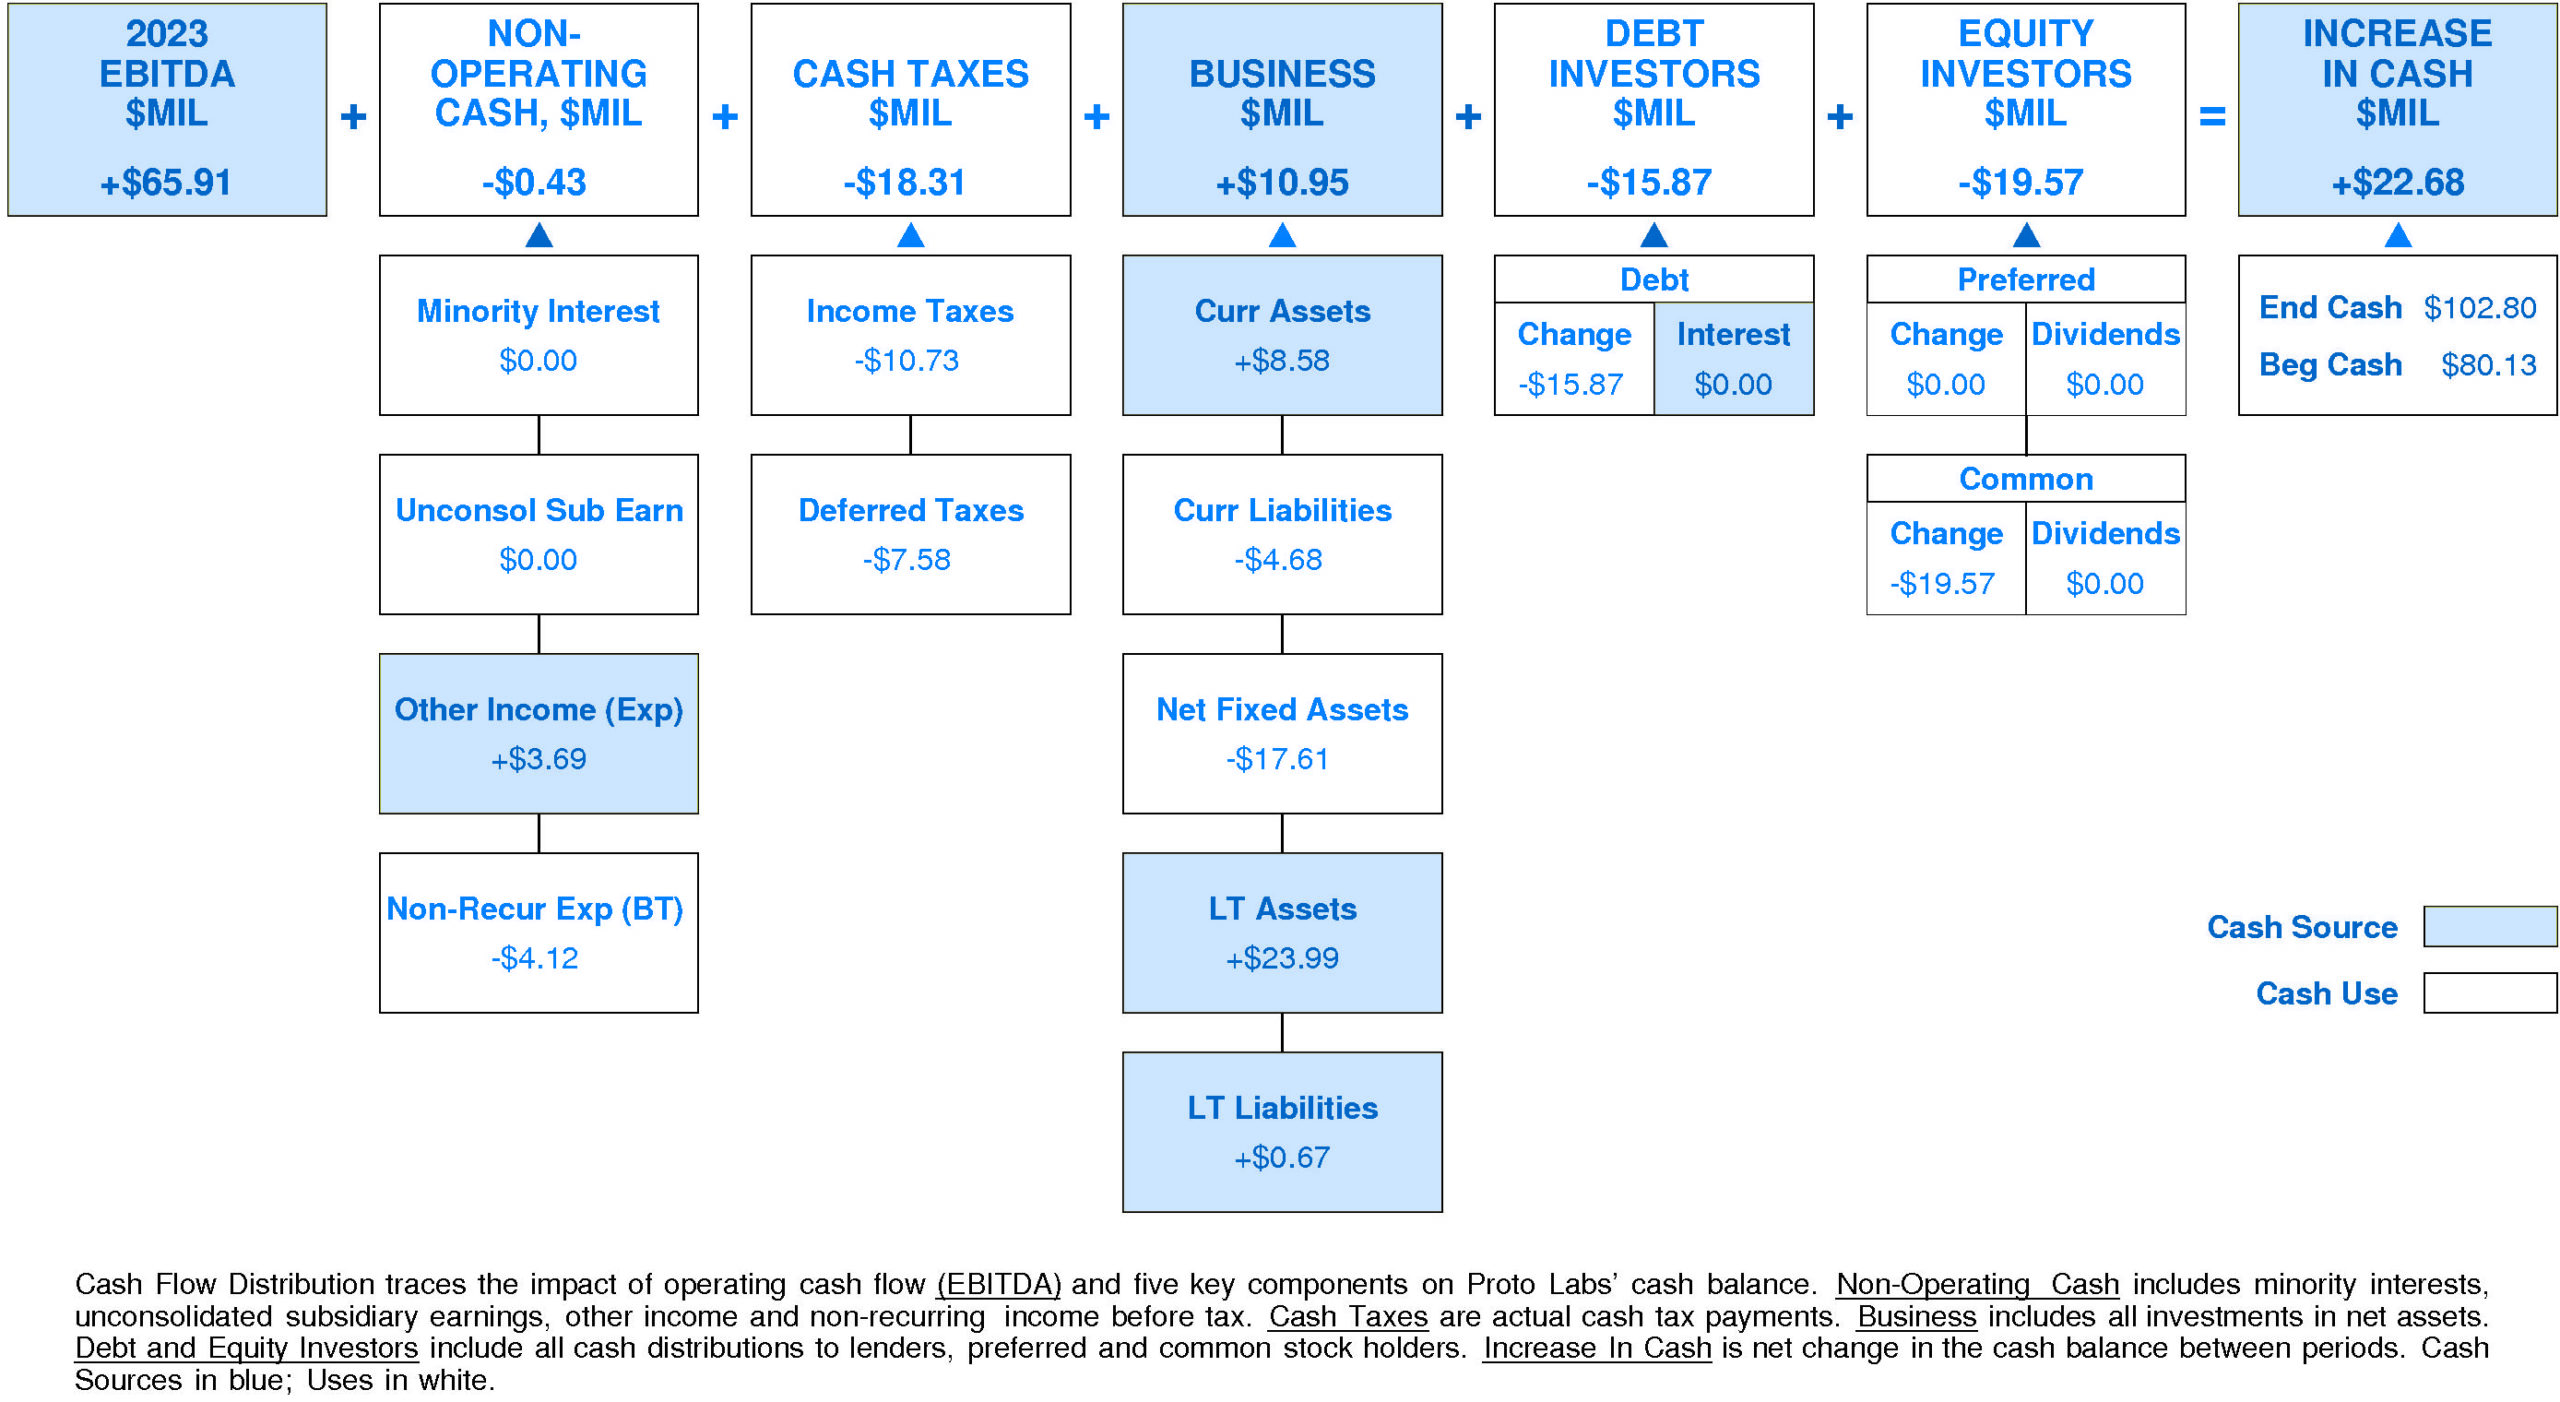
Proto Labs’ Non-operating Income, %EBITDA has suffered a volatile overall downtrend over the period. This downtrend was accompanied by stability for the Proto Labs Peer Group. In most years, Proto Labs was in the second quartile and top quartile. Currently, Proto Labs is slightly below median at -1% of EBITDA (-$0.43 million).
Proto Labs’ Cash Taxes, %EBITDA has exhibited a volatile overall uptrend over the period. This improvement was accompanied by a similar trend for the Proto Labs Peer Group. (Since 2020 Cash Taxes, %EBITDA has experienced a very sharp decline.) In most years, Proto Labs was in the top quartile and second quartile. Currently, Proto Labs is lower quartile at -28% of EBITDA (-$18.31 million).
Proto Labs’ Business Re-investment, %EBITDA has enjoyed a volatile overall uptrend over the period. This improvement was accompanied by stability for the Proto Labs Peer Group. In most years, Proto Labs was in the lower quartile and top quartile. Currently, Proto Labs is upper quartile at +17% of EBITDA (+$10.95 million).
Proto Labs’ Debt Investors, %EBITDA has experienced a downtrend over the period. This downtrend was accompanied by stability for the Proto Labs Peer Group. In most years, Proto Labs was in the third quartile and second quartile. Currently, Proto Labs is lower quartile at -24% of EBITDA (-$15.87 million).
Proto Labs’ Equity Investors, %EBITDA has exhibited little to no overall change over the period. This stability was accompanied by a downtrend for the Proto Labs Peer Group. In most years, Proto Labs was in the top quartile and second quartile. Currently, Proto Labs is lower quartile at -30% of EBITDA (-$19.57 million).
Proto Labs’ Change in Cash, %EBITDA has experienced a downtrend over the period. This downtrend was accompanied by an opposite trend for the Proto Labs Peer Group. (Since 2021 Change in Cash, %EBITDA has experienced a very sharp recovery.) In most years, Proto Labs was in the second quartile and lower quartile. Currently, Proto Labs is above median at +34% of EBITDA (+$22.68 million).
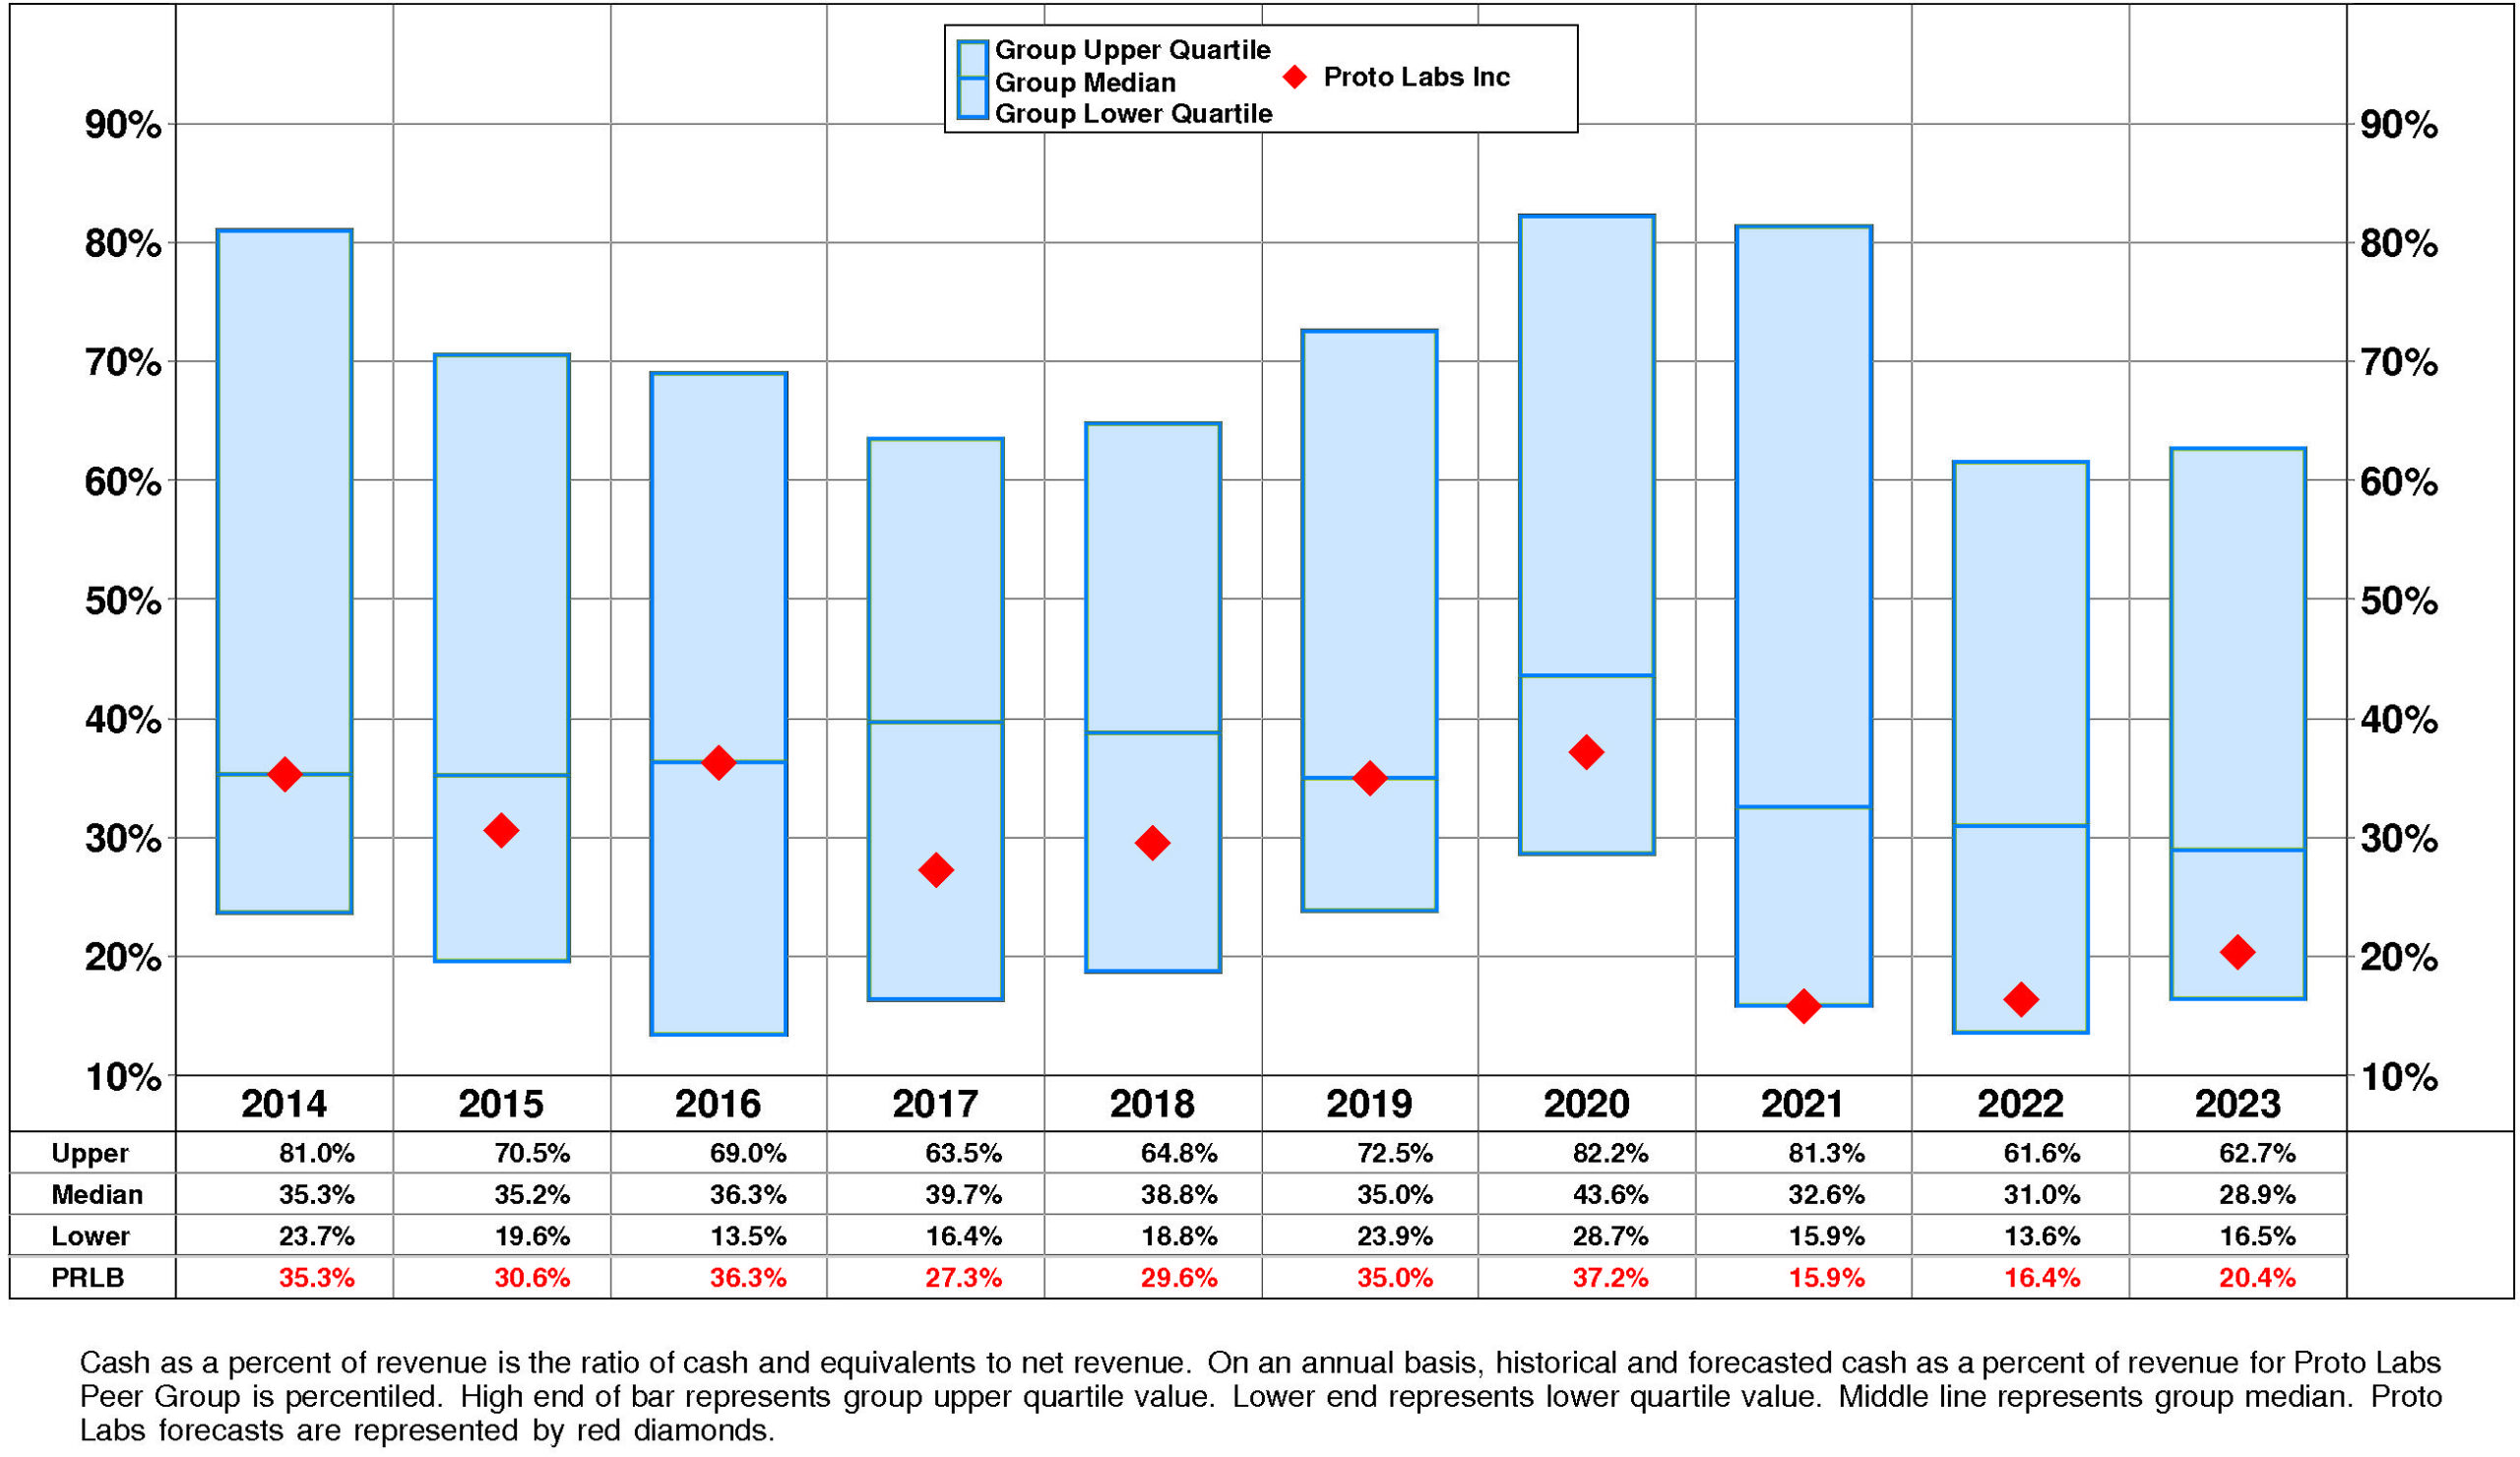
Proto Labs’ Cash, %Revenue has experienced a minor downtrend over the period. This downtrend was accompanied by a similar trend for the Proto Labs Peer Group. (Since 2021 Cash, %Revenue has experienced a minor recovery.) In most years, Proto Labs was in the third quartile and second quartile. Currently, Proto Labs is below median at +20%.
PROFITABILITY
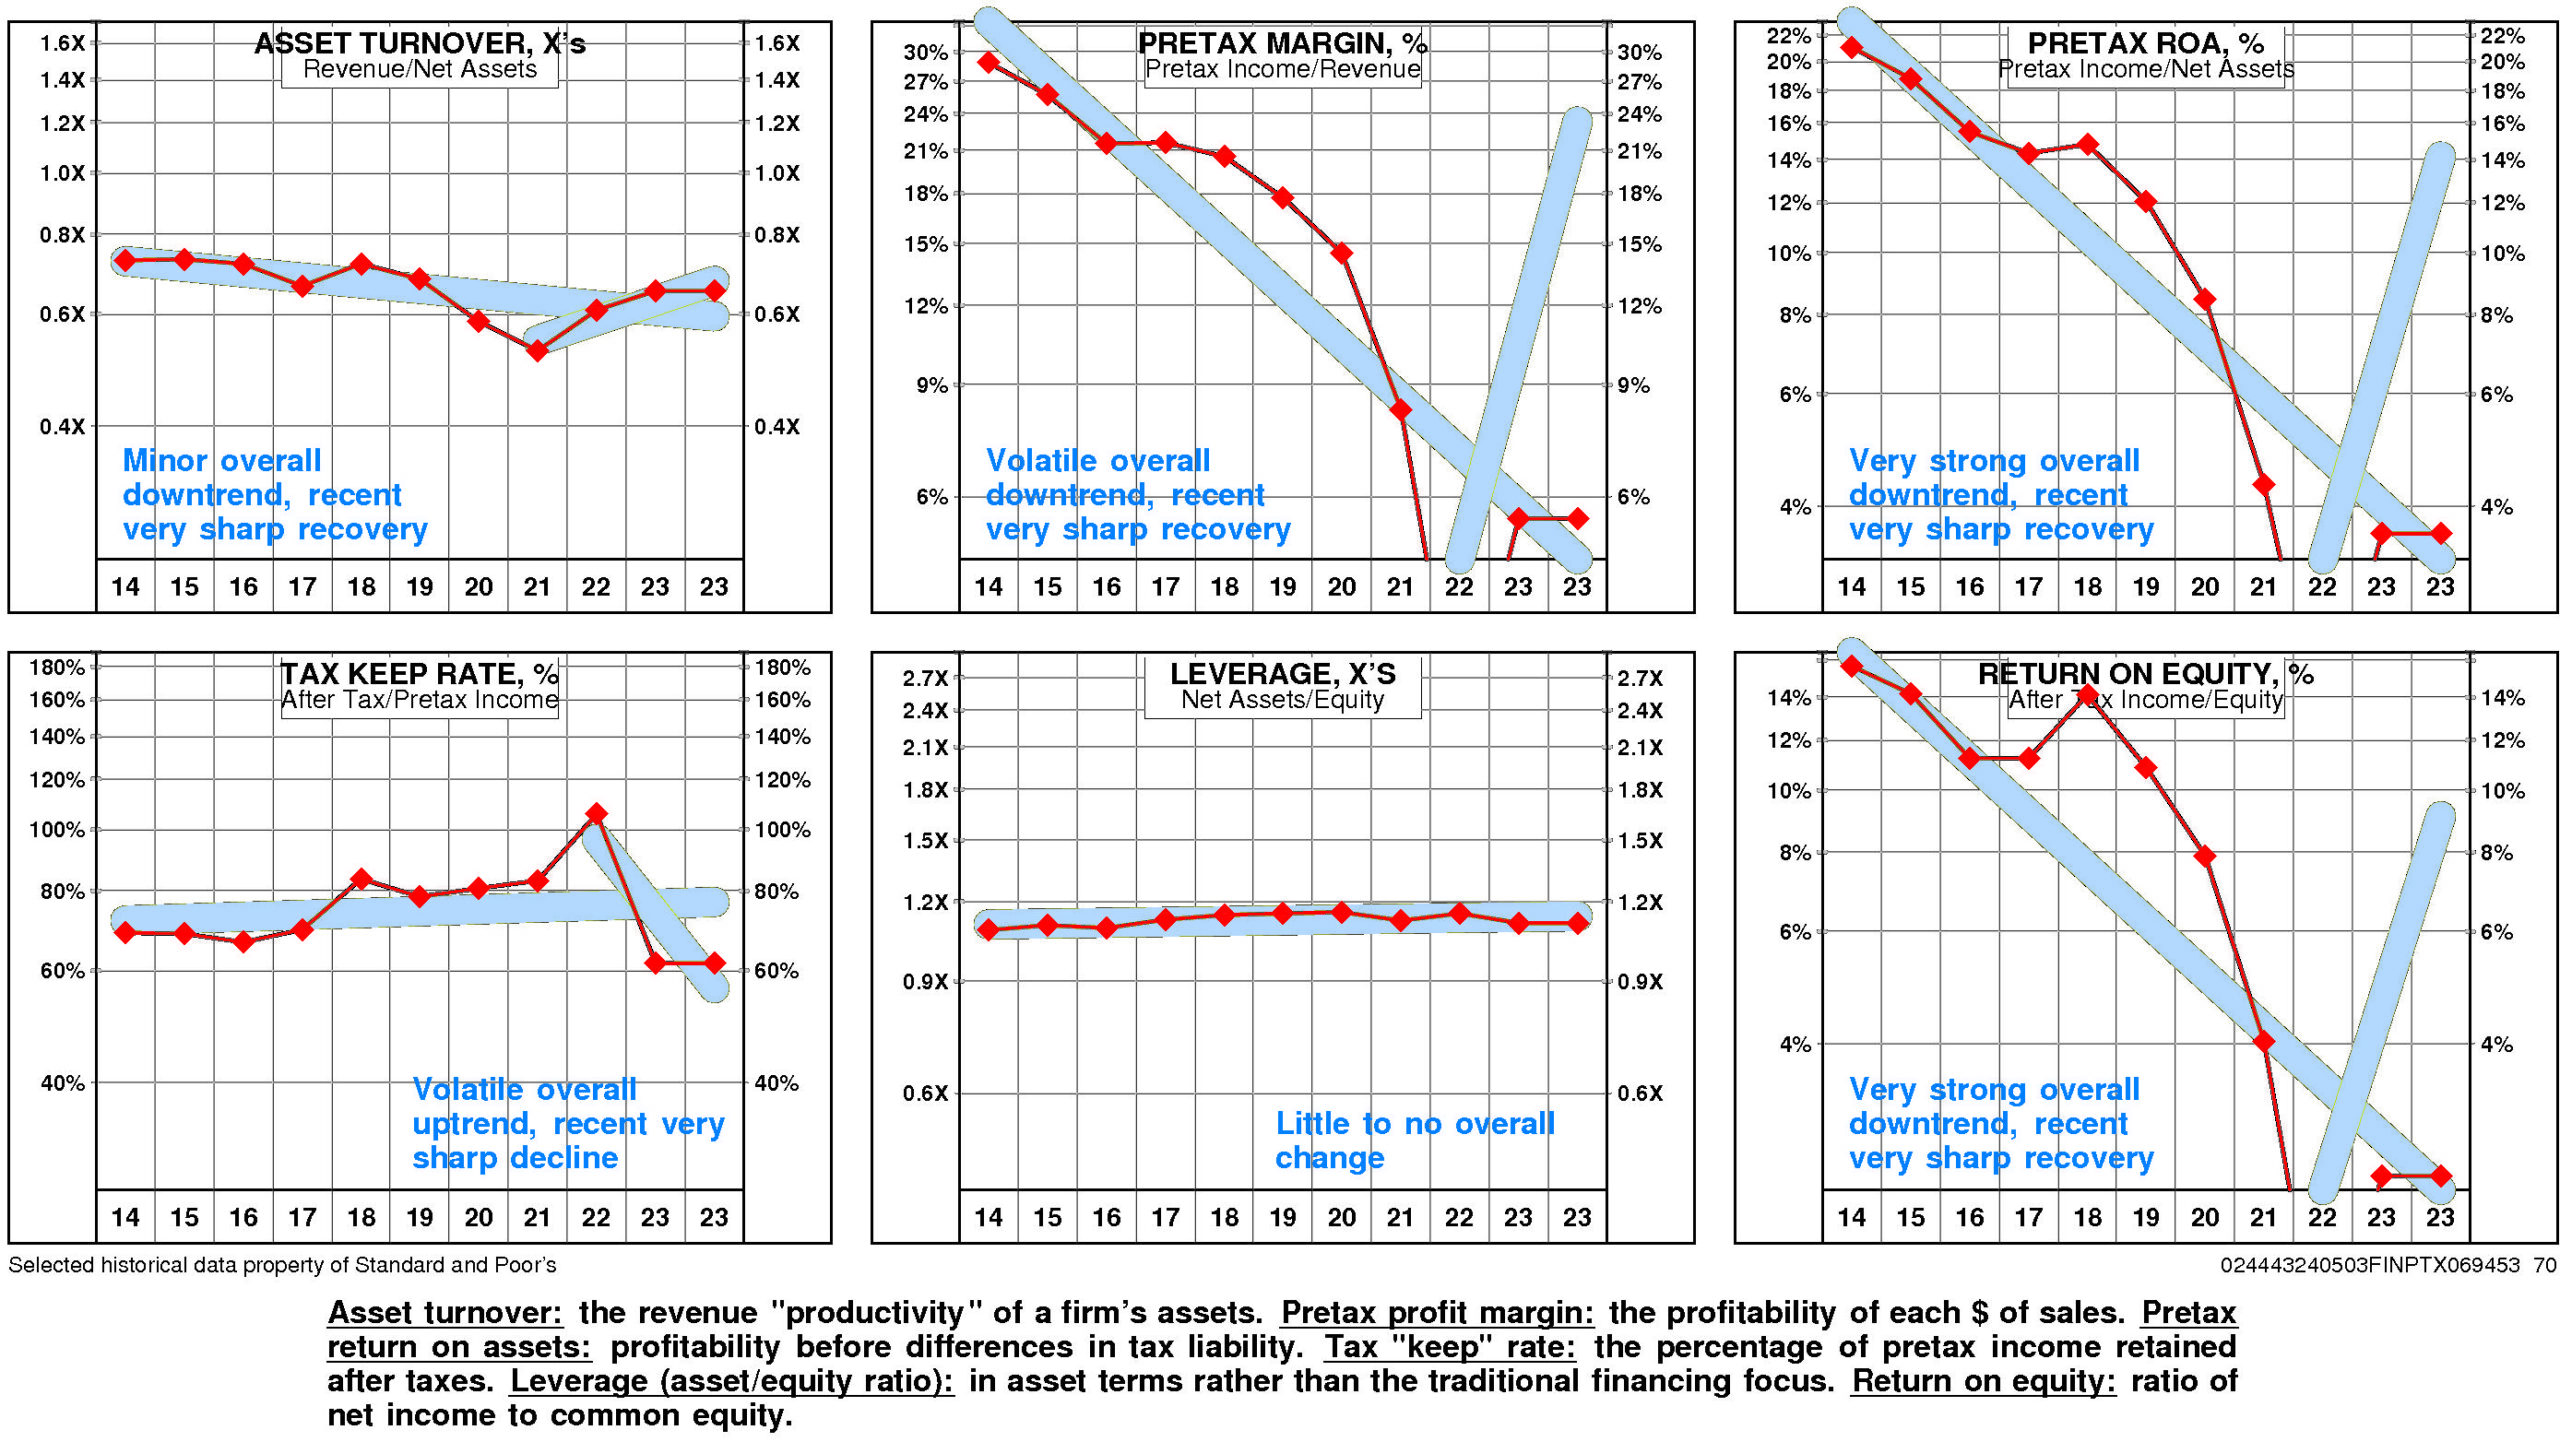
Proto Labs’ return on equity has eroded very significantly since 2014. The current level is 2.5% versus the high of 15.7% and the low of -14.8%.
This very significant erosion was due to very strong negative trend in pretax operating return and little change in non-operating factors.
The productivity of Proto Labs’ assets declined over the full period 2014-2023: asset turnover has experienced a minor downtrend although it experienced a very sharp recovery after the 2021 low.
Reinforcing this trend, pretax margin experienced a strong overall downtrend although it experienced a very sharp recovery after the 2022 low.
Non-operating factors (income taxes and financial leverage) had little influence on return on equity.
Proto Labs’ return on equity is lower quartile (2.5%) for the four quarters ended December, 2023.
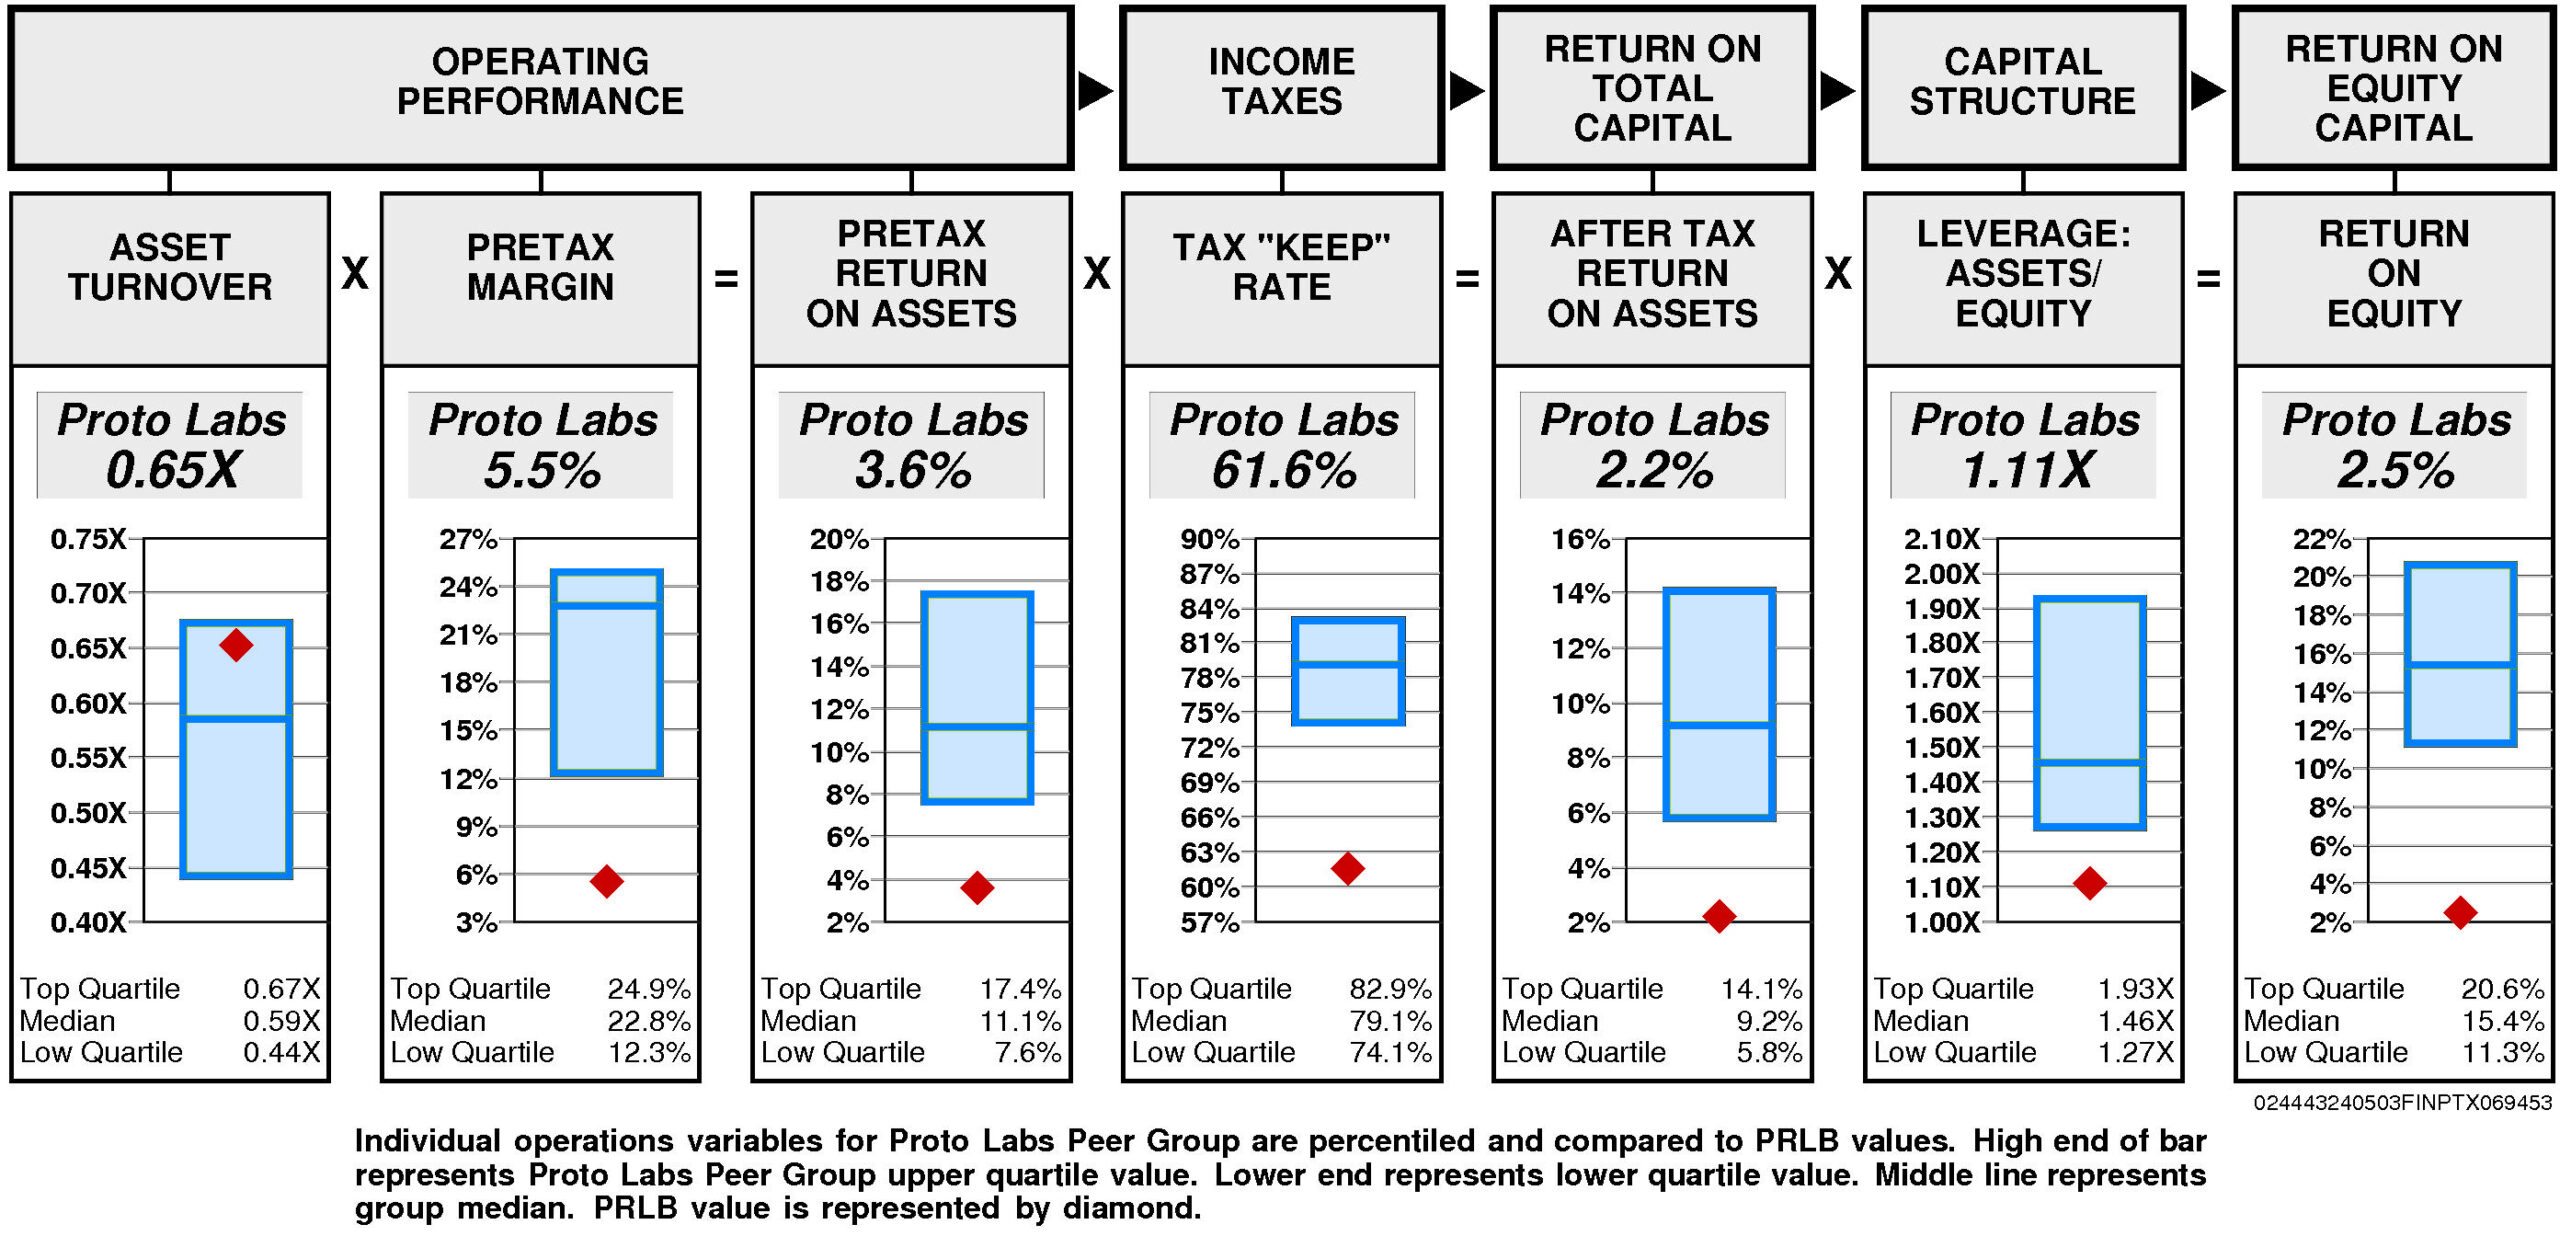
Operating performance (pretax return on assets) is lower quartile (3.6%) reflecting asset turnover that is substantially above median (0.65X) and lower quartile pretax margin (5.5%).
Tax “keep” rate (income tax management) is lower quartile (61.6%) resulting in after tax return on assets that is lower quartile.
Financial leverage (leverage) is lower quartile (1.11X).
GROWTH RATES
Overall, Proto Labs’ growth rate has slowed very considerably in recent years.
Proto Labs’ historical income statement growth and balance sheet growth have diverged. Revenue growth has paralleled asset growth; earnings growth has fallen short of equity growth.
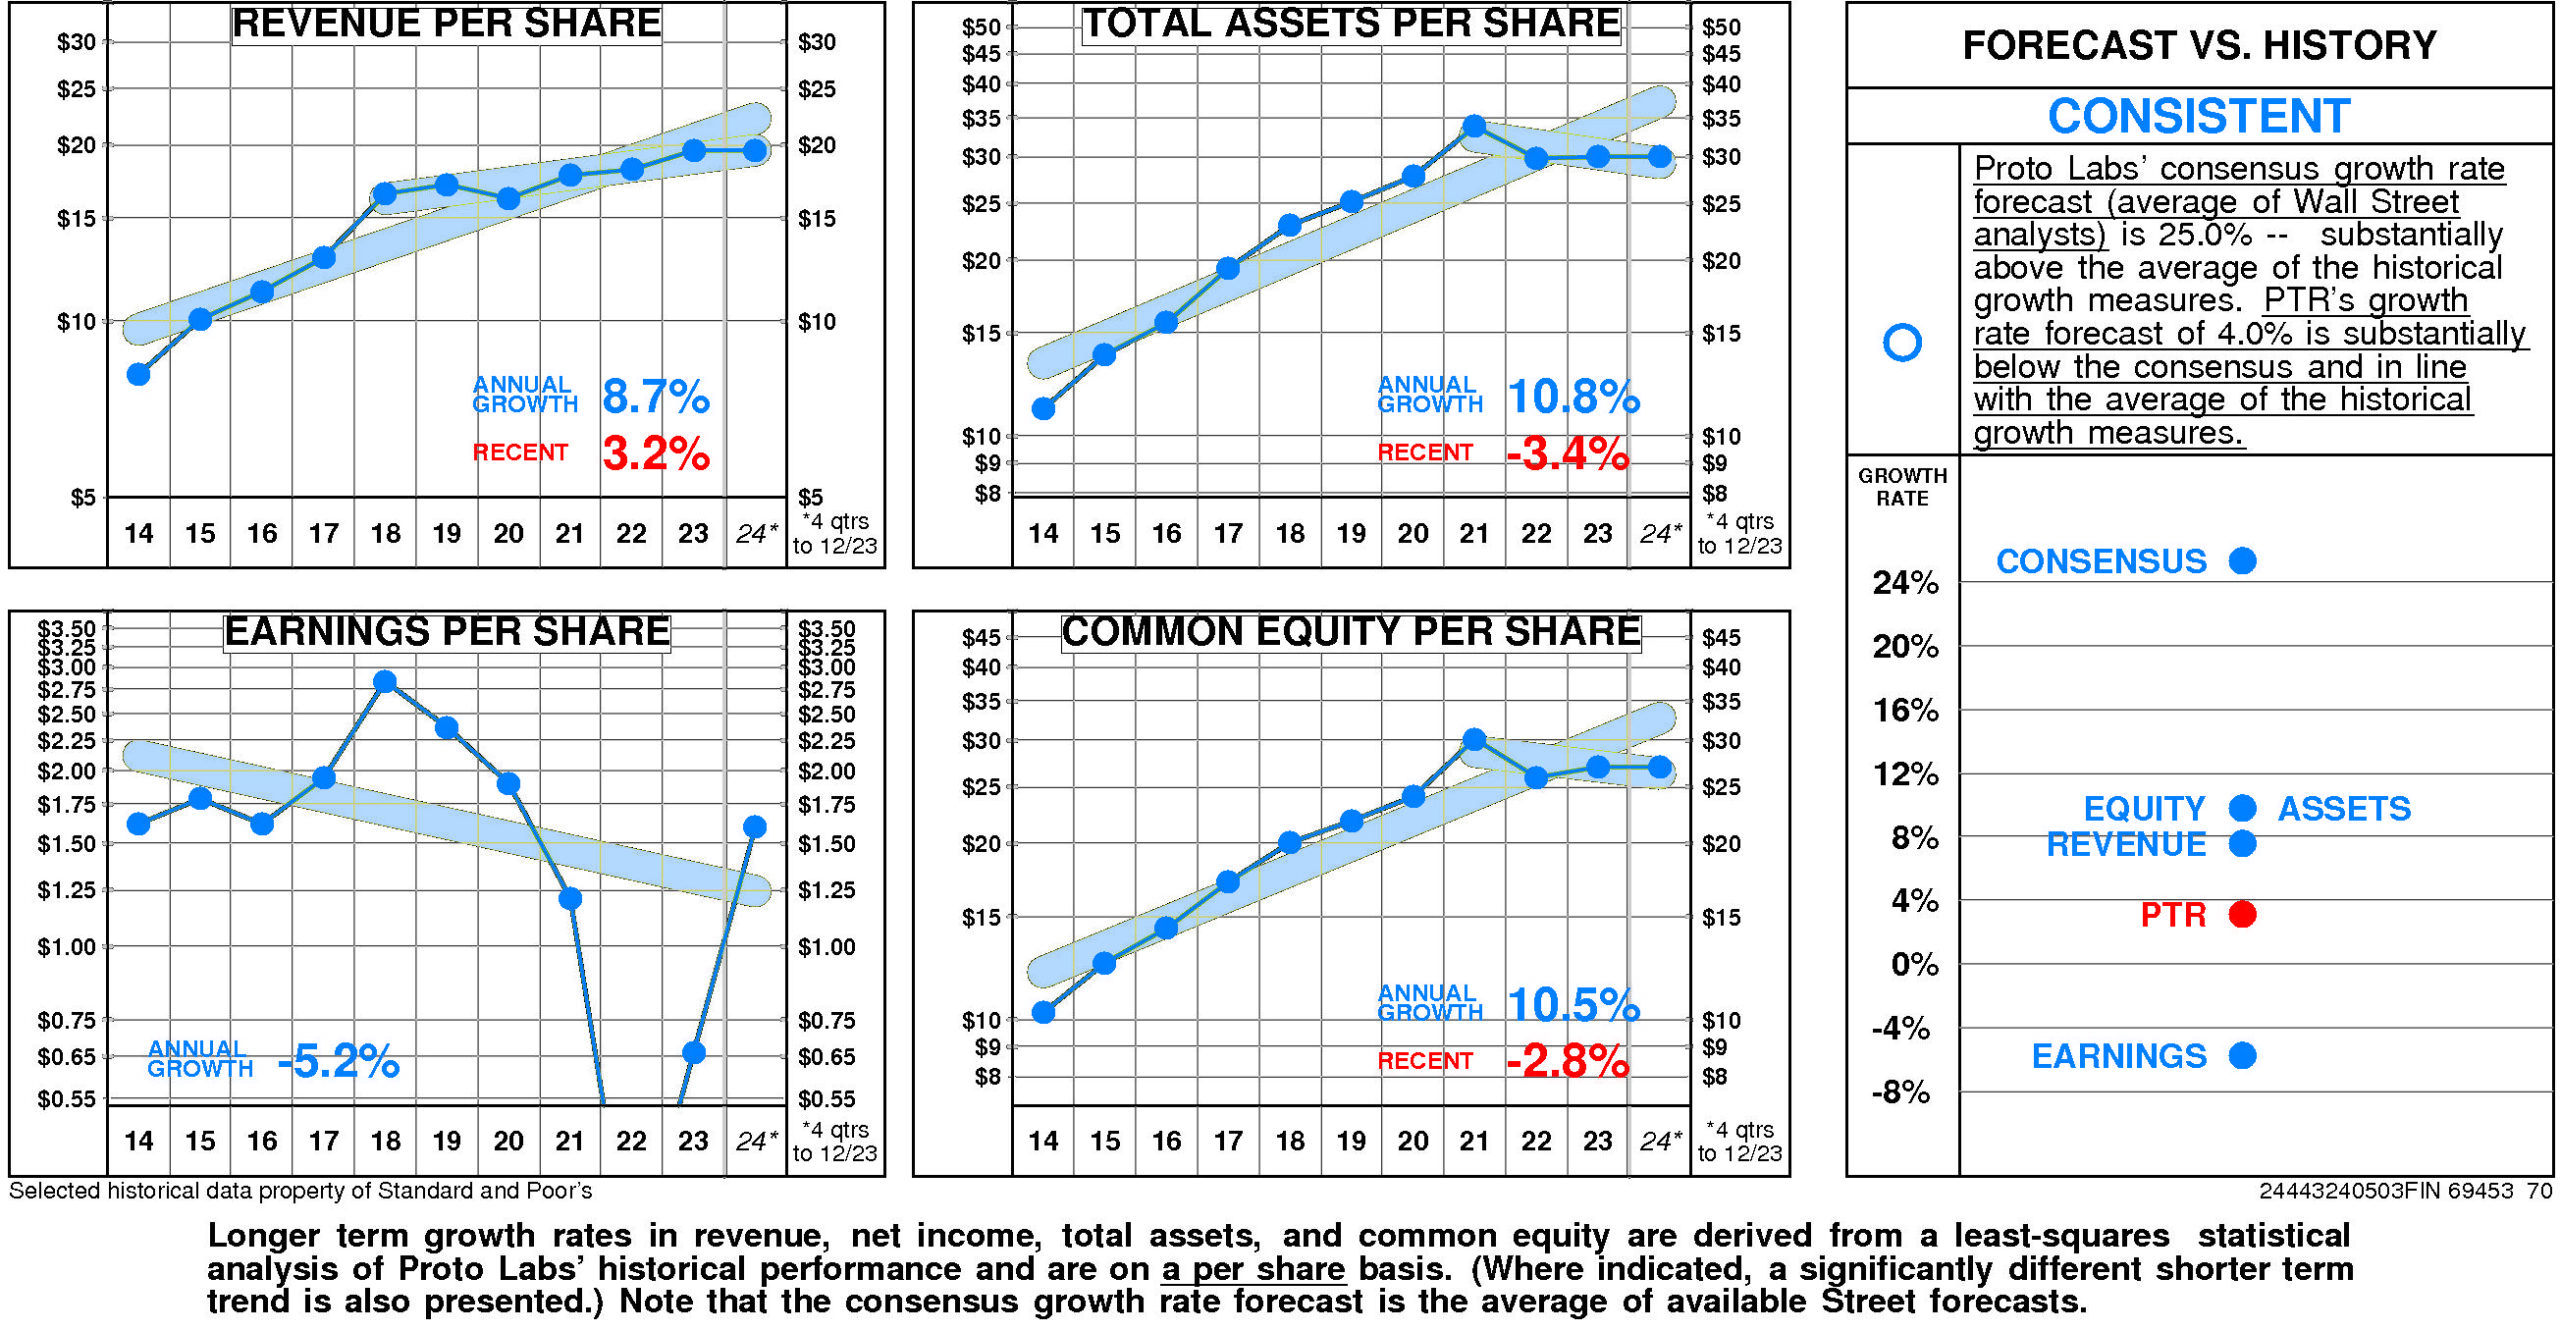
Annual revenue growth has been 8.7% per year. (More recently it has been 3.2%.)
Total asset growth has been 10.8% per year. (More recently it has been -3.4%.)
Annual E.P.S. growth has been -5.2% per year.
Equity growth has been 10.5% per year. (More recently it has been -2.8%.)
Proto Labs’ consensus growth rate forecast (average of Wall Street analysts) is 25.0% — substantially above the average of the historical growth measures.
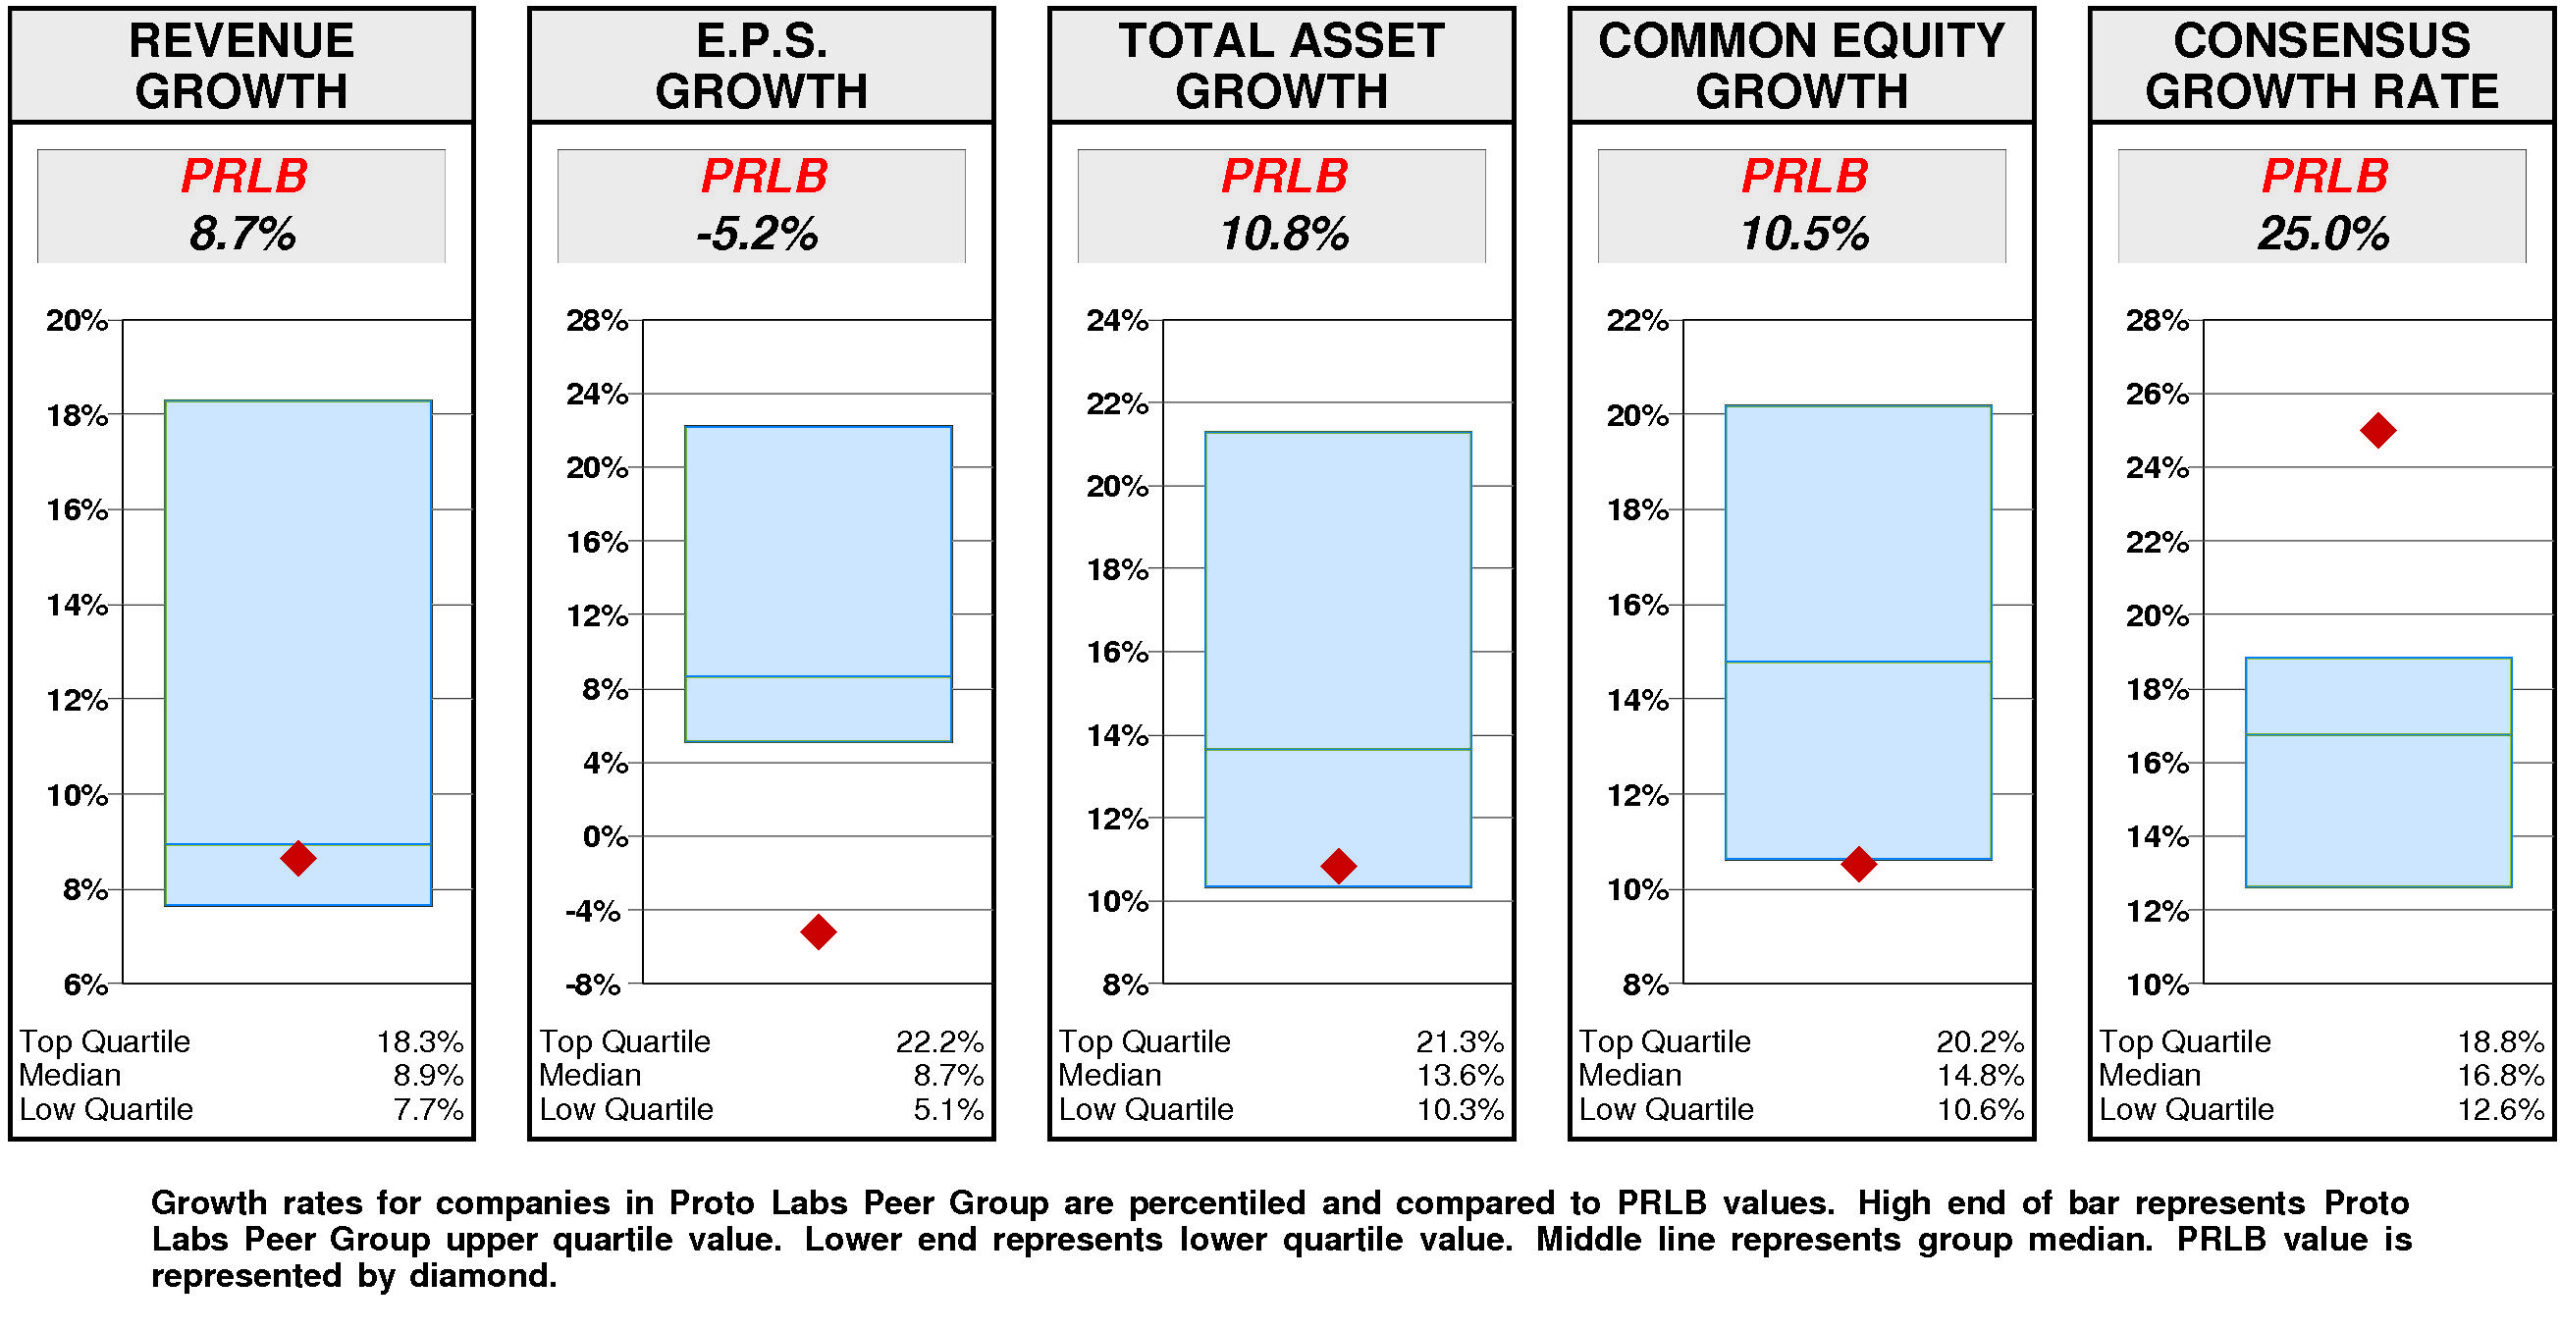
Relative to the Proto Labs Peer Group, Proto Labs’ historical growth measures are erratic. Revenue growth (8.7%) has been slightly below median. Total asset growth (10.8%) has been substantially below median. Equity growth (10.5%) has been at the lower quartile. E.P.S. growth (-5.2%) has been lower quartile.
Consensus growth forecast (25.0%) is upper quartile.
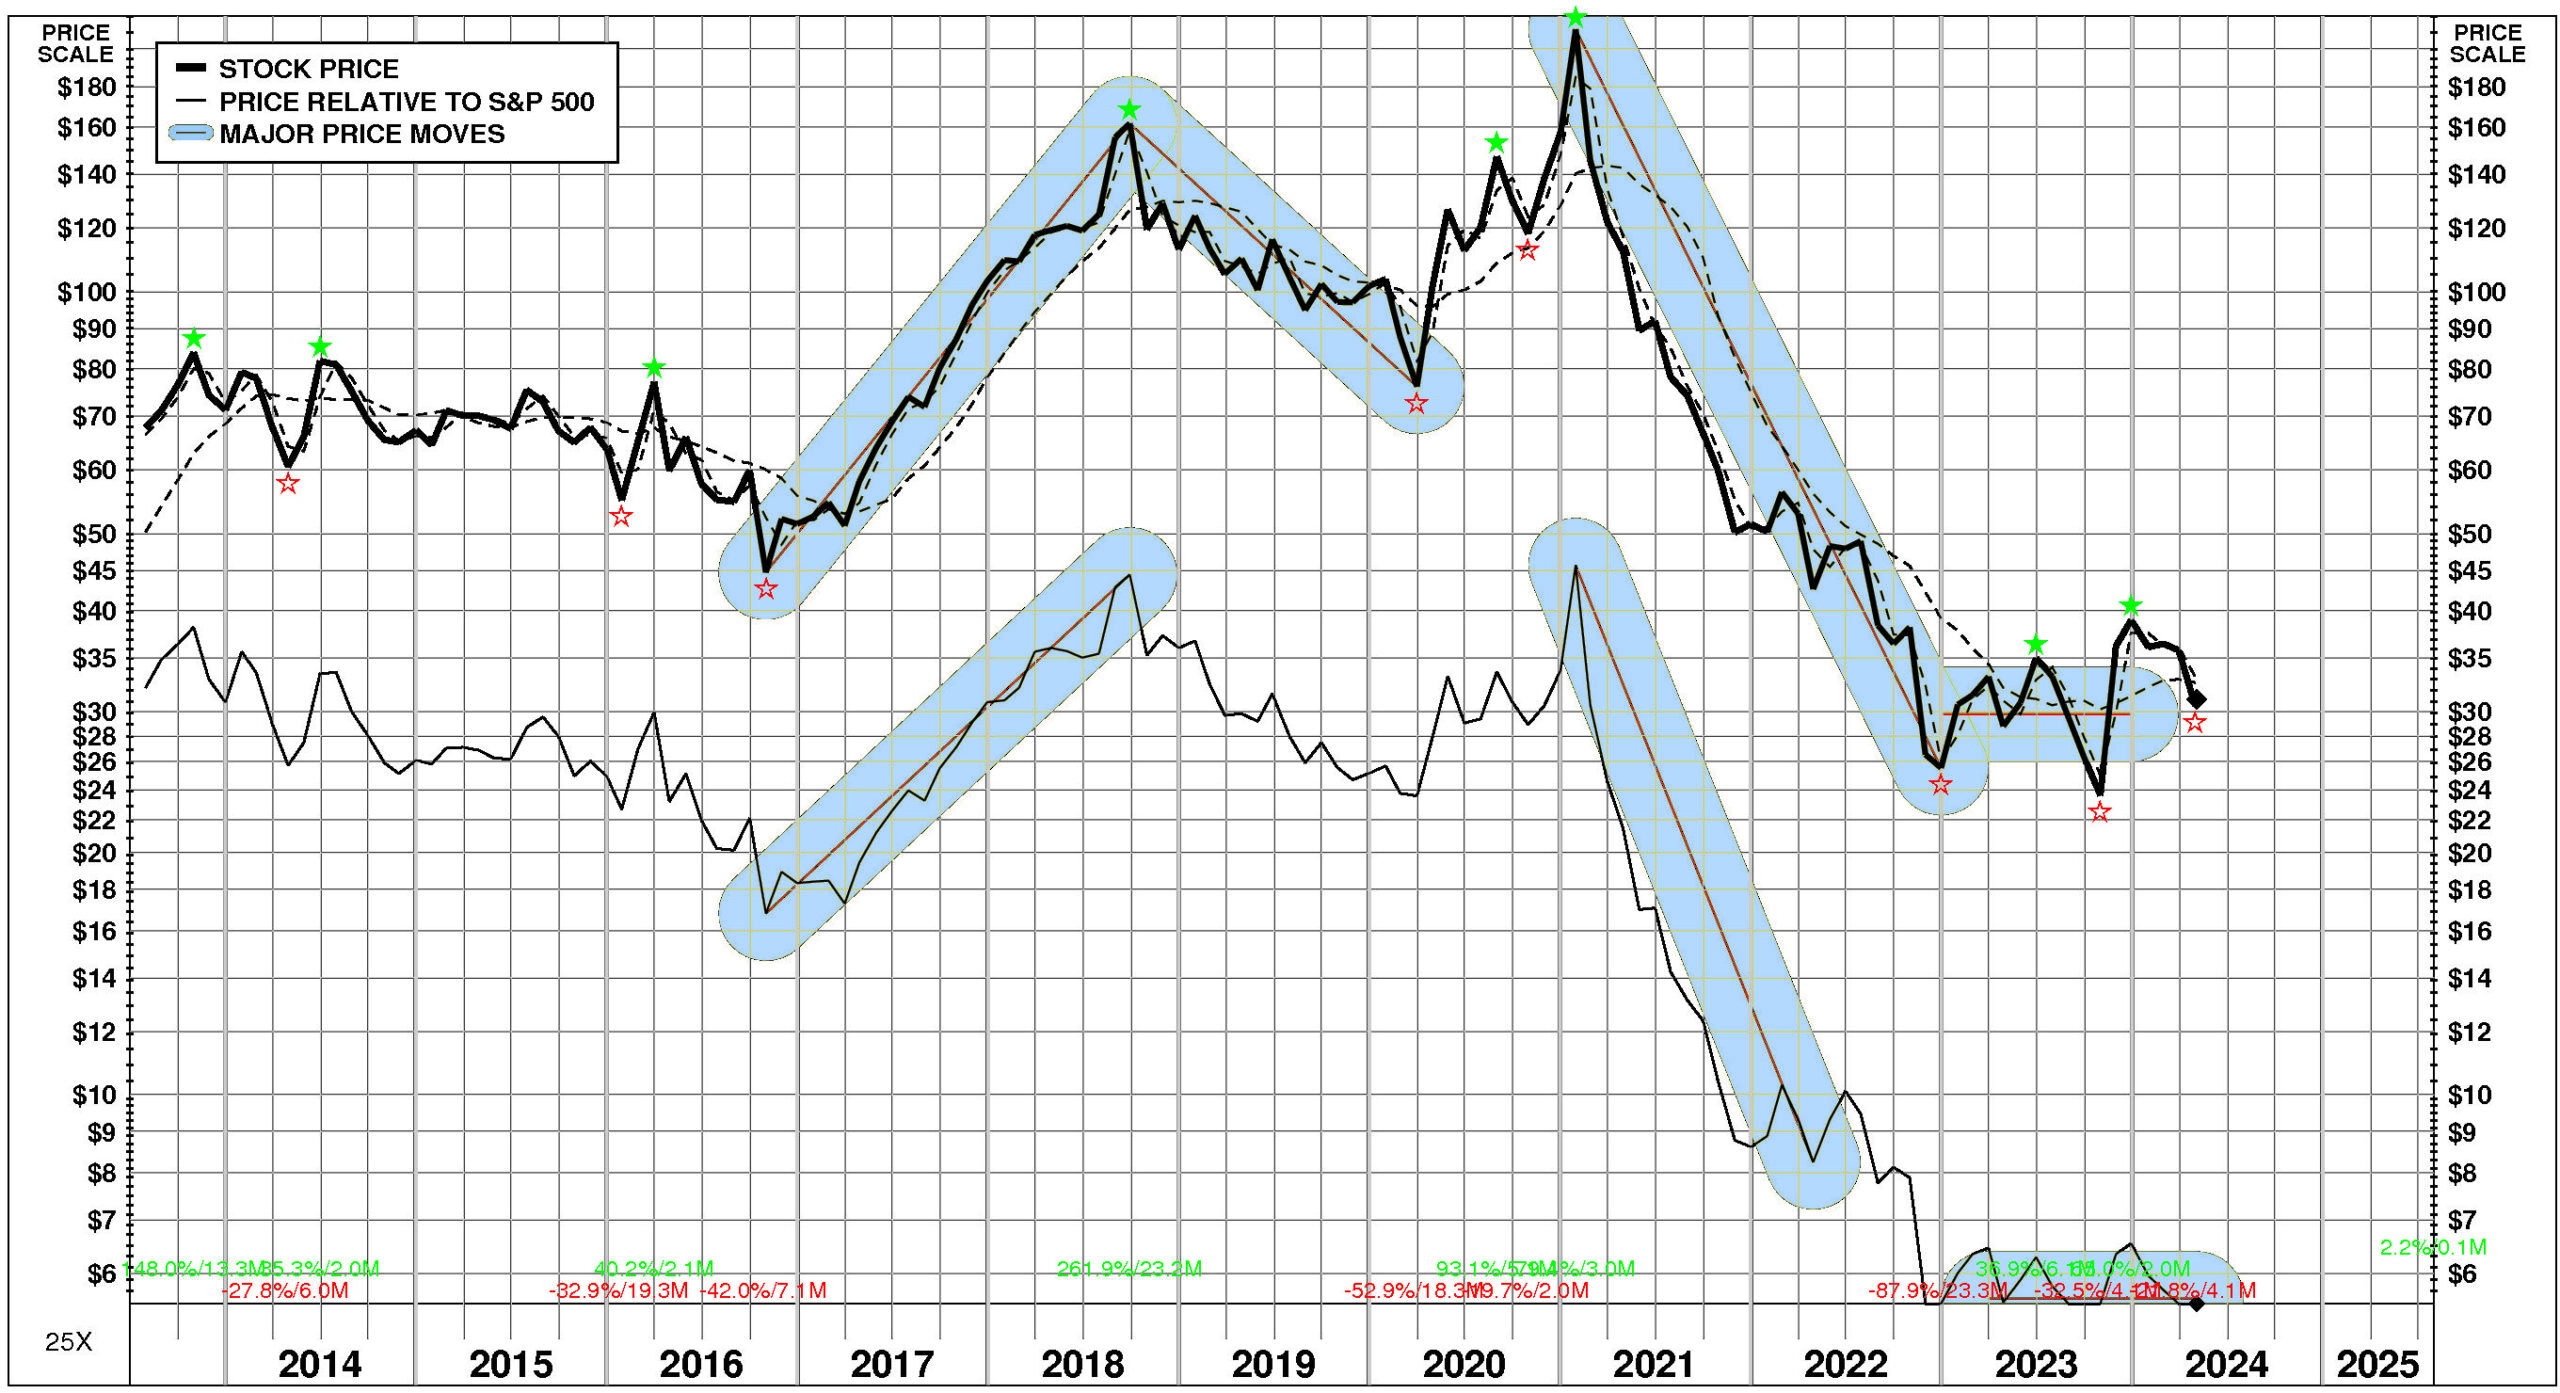
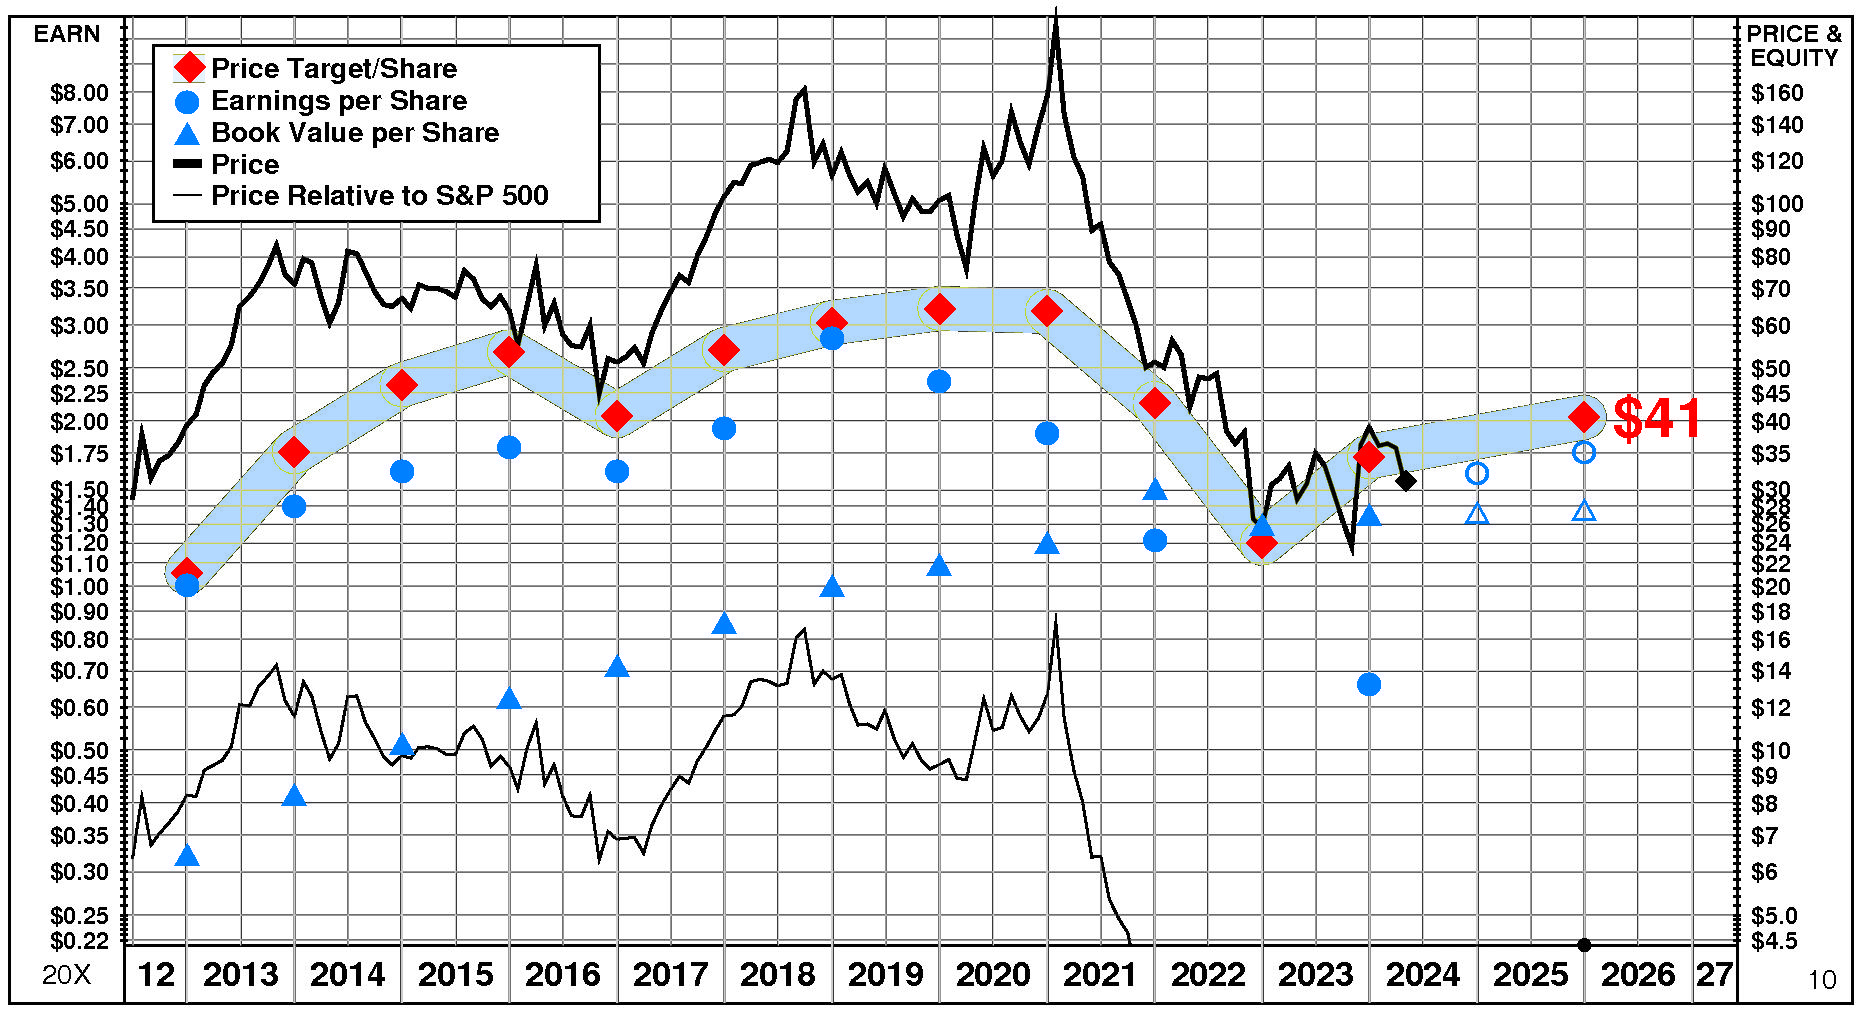
PRICE HISTORY
Over the full time period, Proto Labs’ stock price performance has been variable and significantly below market. Between July, 2013 and May, 2024, Proto Labs’ stock price fell -54%; relative to the market, this was a -85% loss. Significant price moves during the period: 1) January, 2021 – December, 2022: -88%; 2) September, 2018 – March, 2020: -53%; and 3) October, 2016 – September, 2018: +262%.
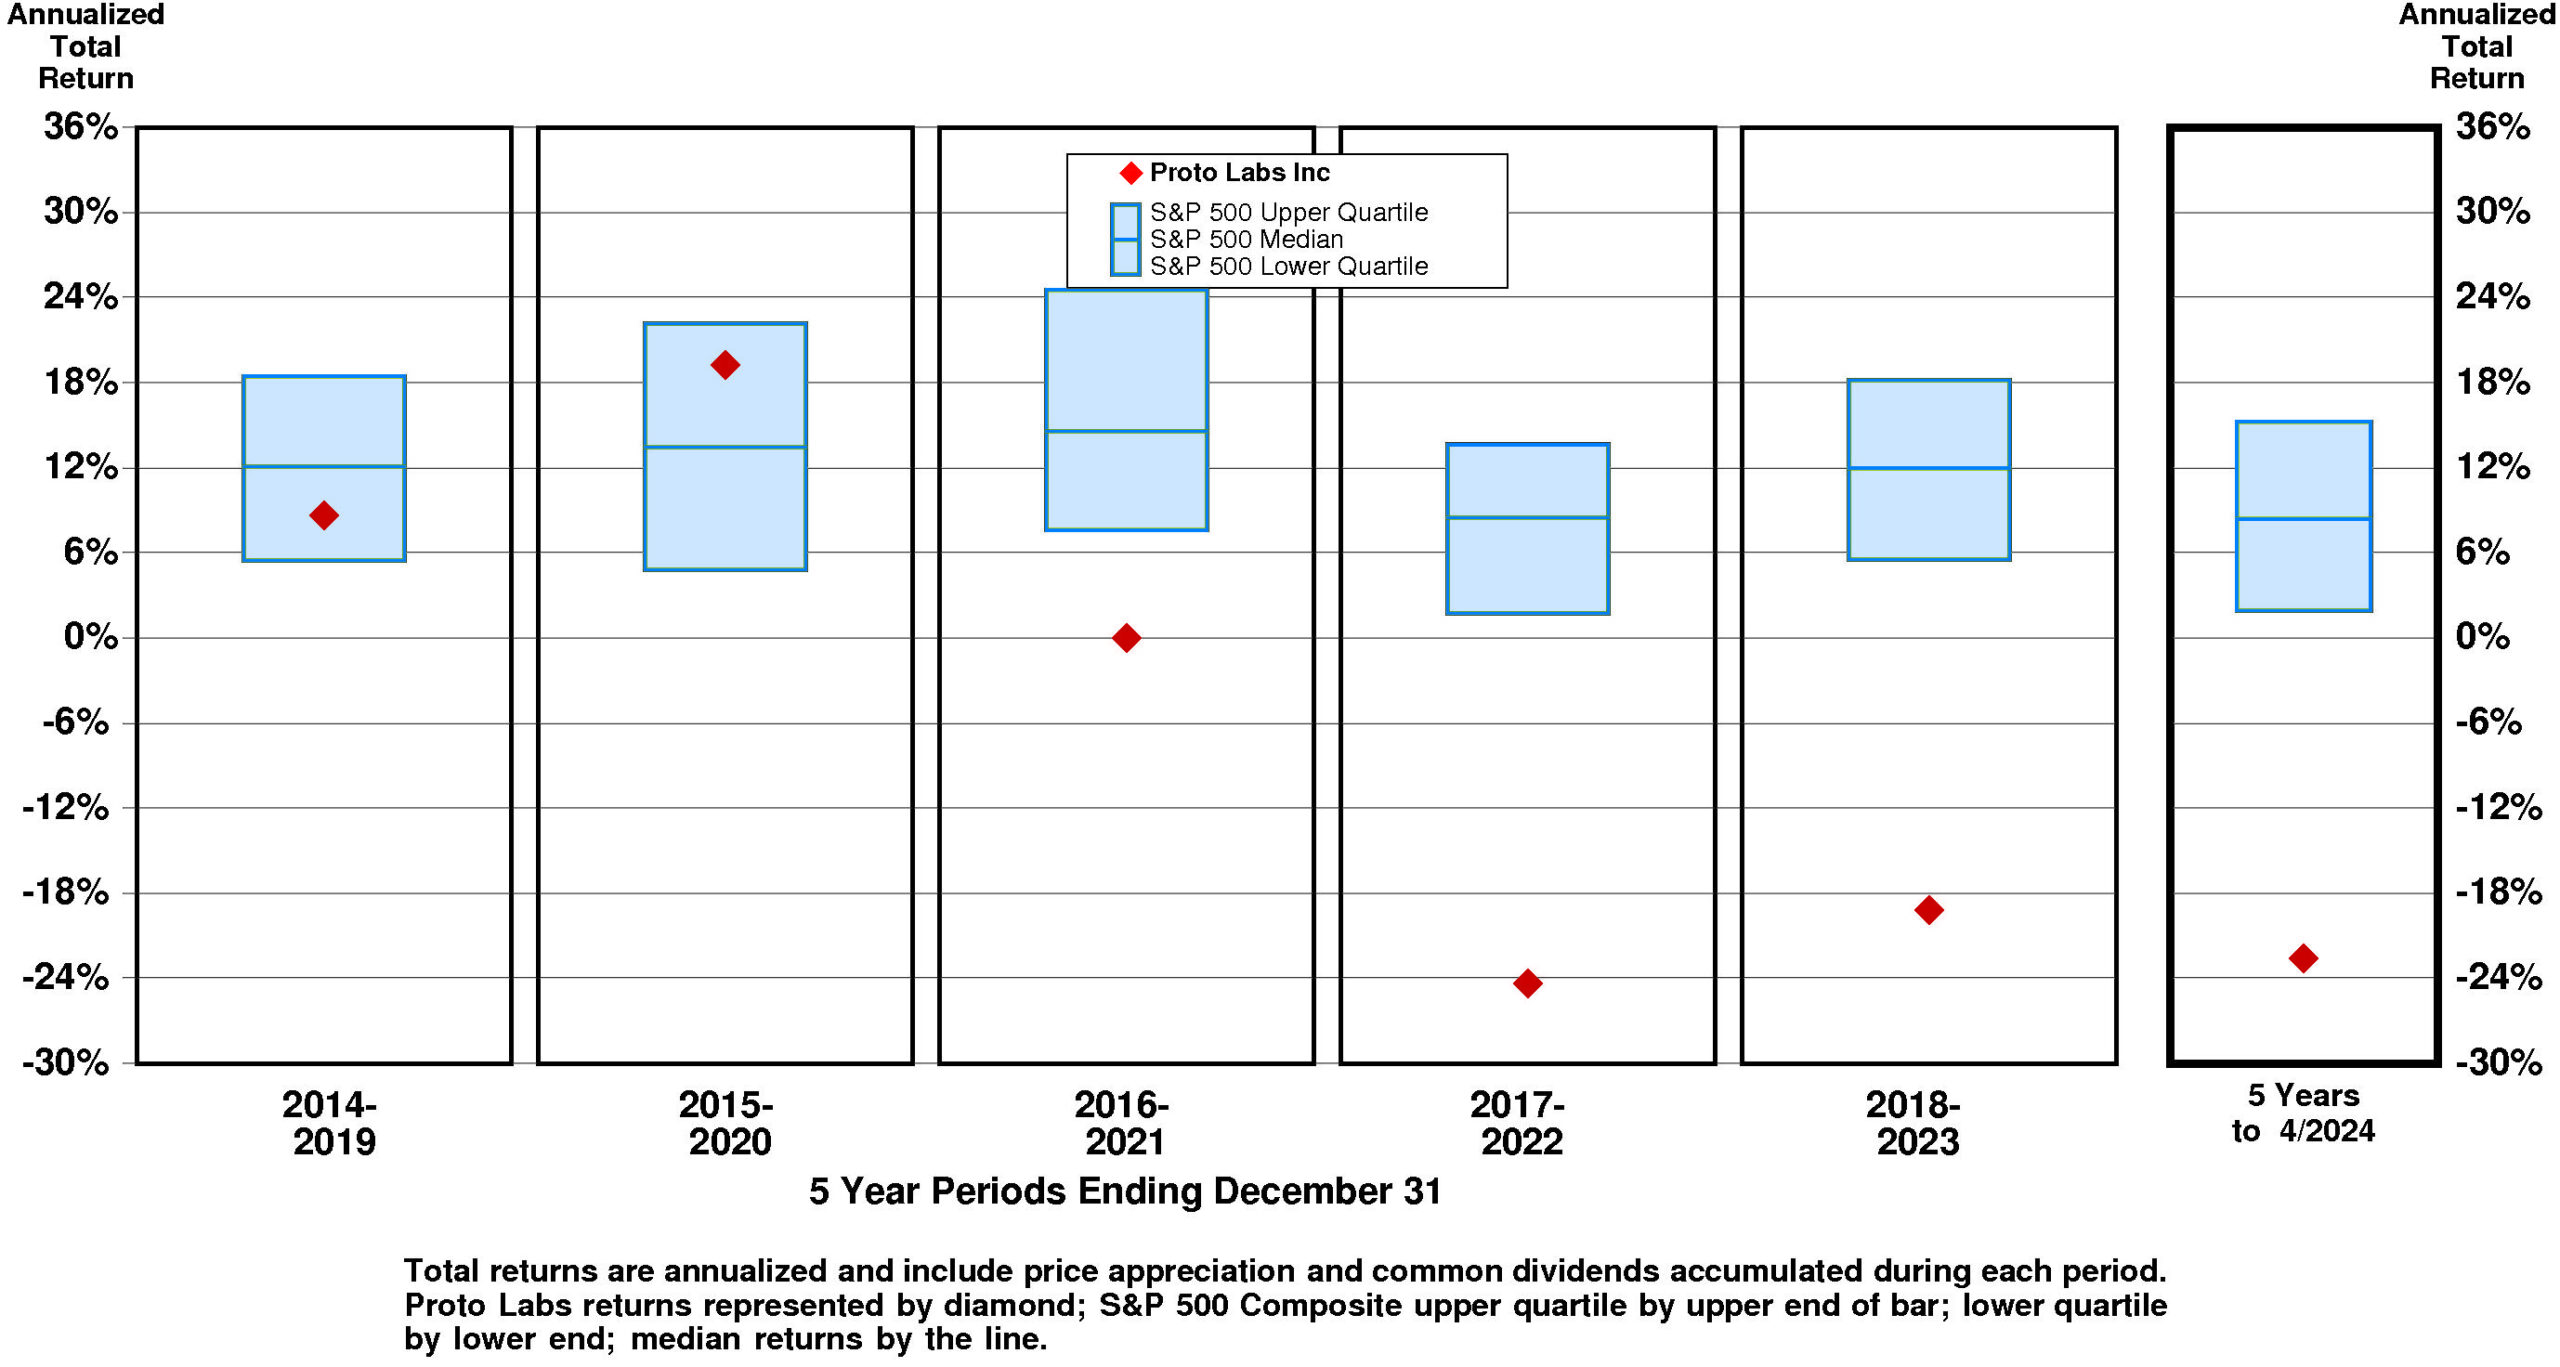
TOTAL INVESTMENT RETURNS
Current annual total return performance of 5.9% is below median relative to the S&P 500 Composite.
In addition to being below median relative to S&P 500 Composite, current annual total return performance through April, 2024 of 5.9% is at median relative to Proto Labs Inc Peer Group.
Current 5-year total return performance of -22.6% is lower quartile relative to the S&P 500 Composite.
Through April, 2024, with lower quartile current 5-year total return of -22.6% relative to S&P 500 Composite, Proto Labs’ total return performance is lower quartile relative to Proto Labs Inc Peer Group.
VALUATION BENCHMARKS
Relative to S&P 500 Composite, PRLB’s overall valuation is normal. The highest factor, the price/earnings ratio, is upper quartile. Ratio of enterprise value/earnings before interest and taxes is near the upper quartile. Ratio of enterprise value/assets is near the lower quartile. Ratio of enterprise value/revenue is lower quartile. The lowest factor, the price/equity ratio, is lower quartile.
Relative to Proto Labs Peer Group, PRLB’s overall valuation is quite low. The highest factor, the price/earnings ratio, is at median. Ratio of enterprise value/earnings before interest and taxes is near the lower quartile. Ratio of enterprise value/assets is lower quartile. Ratio of enterprise value/revenue is lower quartile. The lowest factor, the price/equity ratio, is lower quartile.
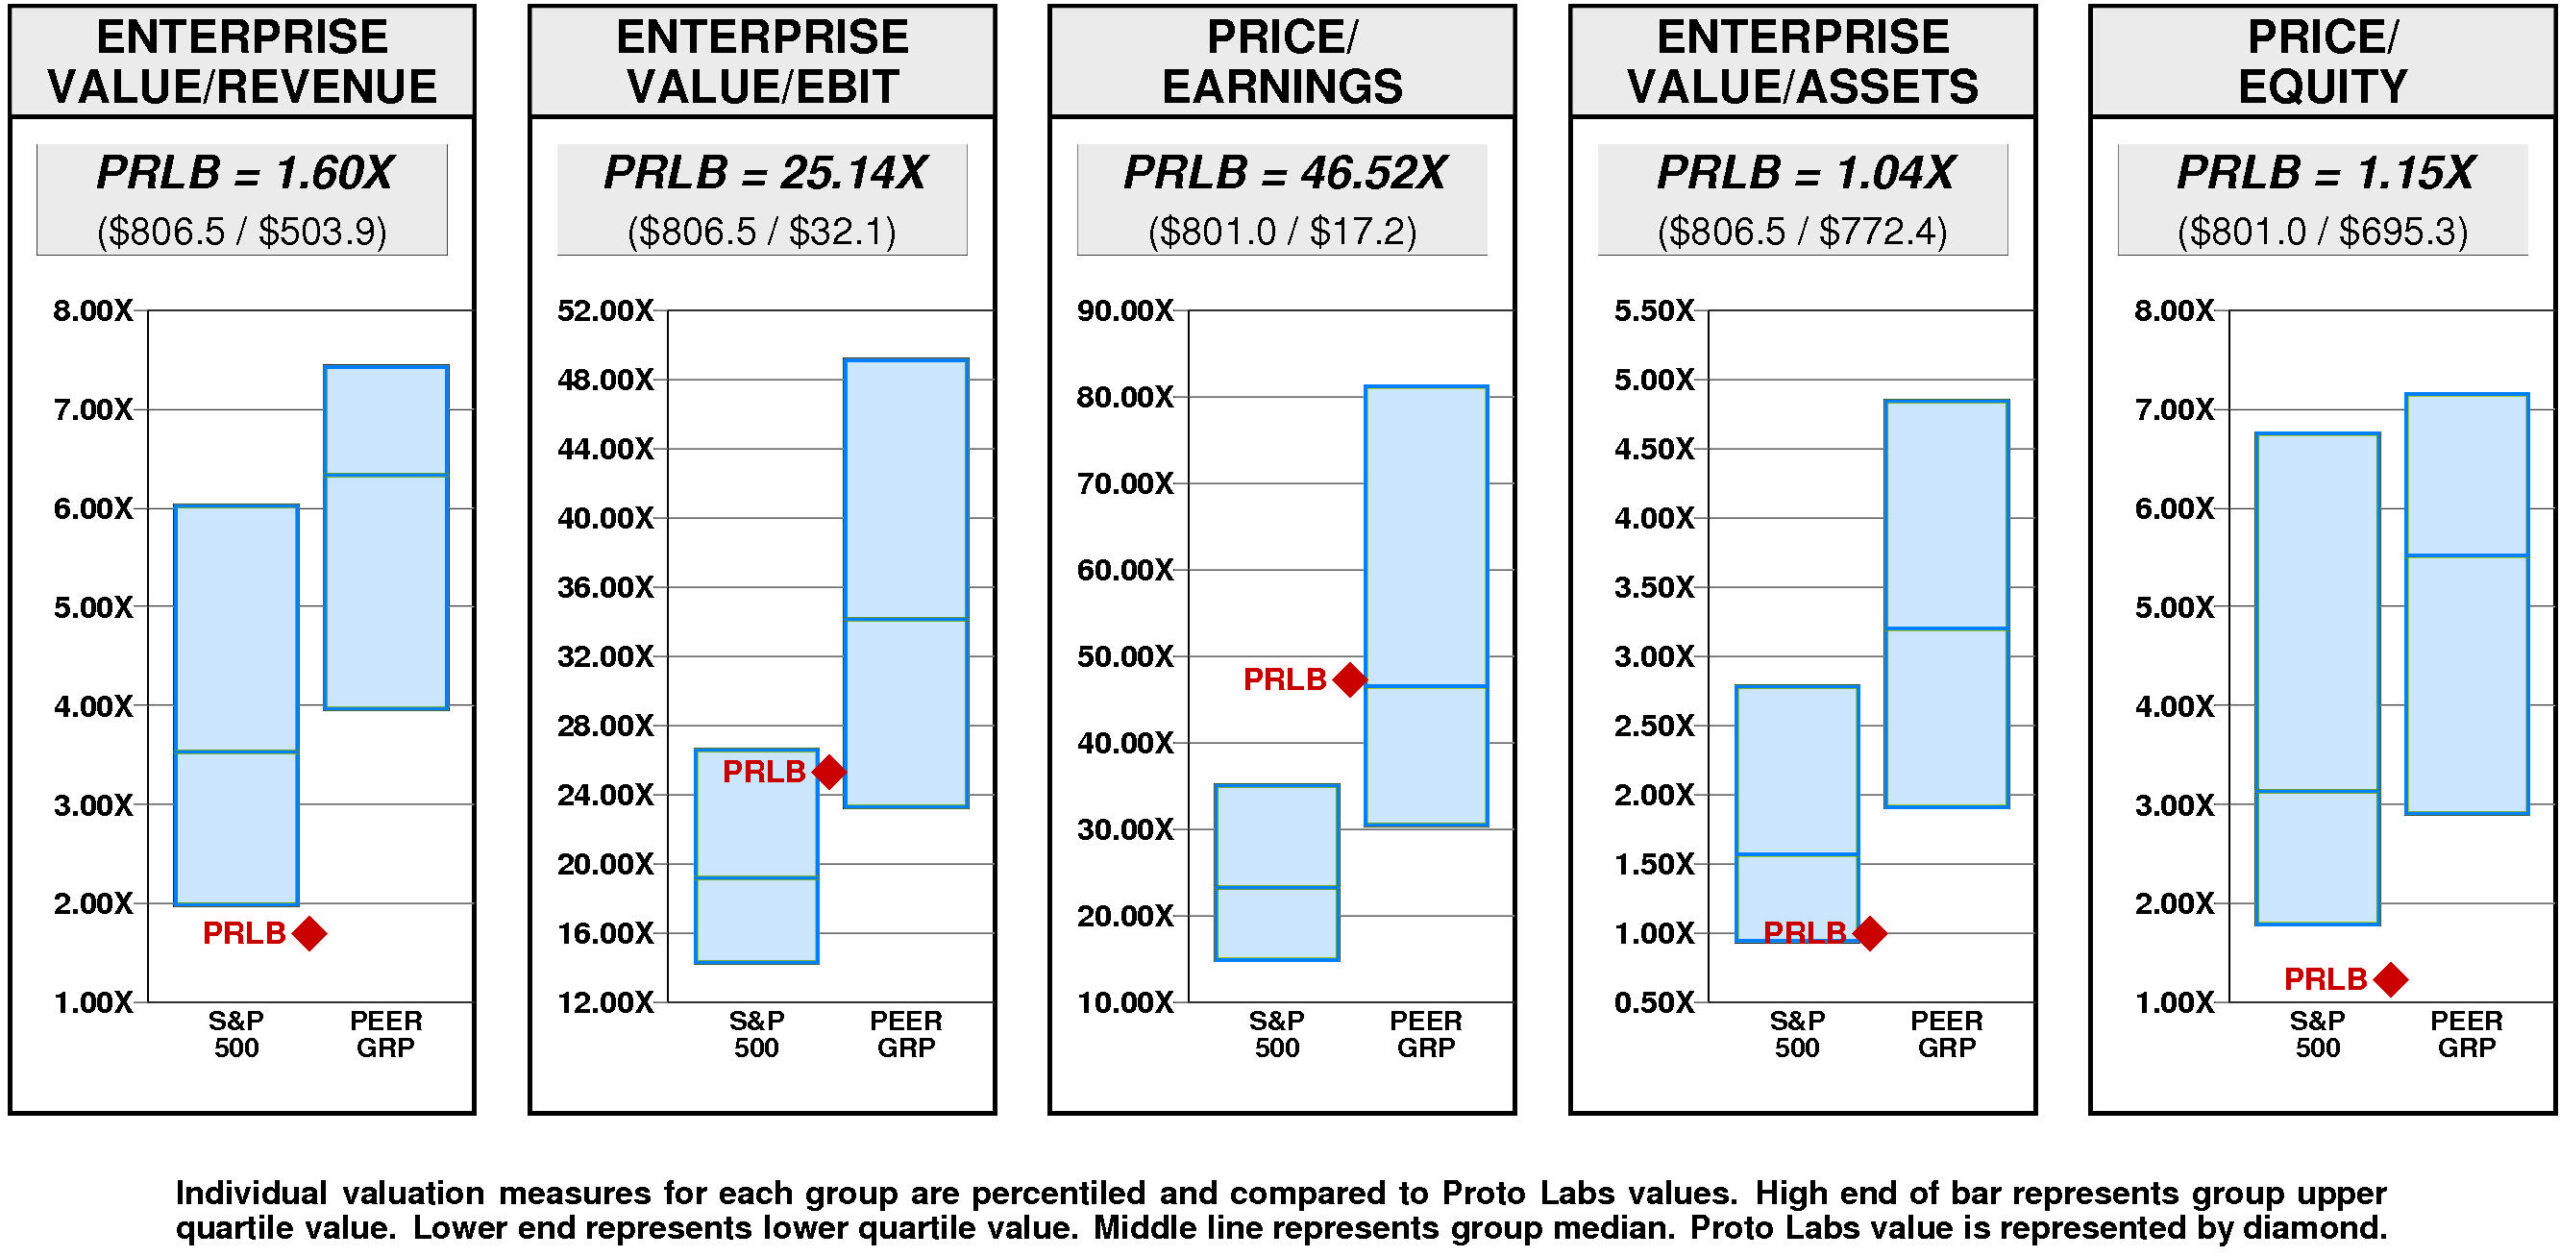
Proto Labs has a major value gap compared to the median. For PRLB to hit median valuation, its current ratio of enterprise value/revenue would have to rise from the current level of 1.60X to 6.33X. If PRLB’s ratio of enterprise value/revenue were to rise to 6.33X, its stock price would be higher by $93 to $124.
For PRLB to achieve upper quartile valuation relative to the Proto Labs Peer Group, its current ratio of enterprise value/revenue would have to rise from the current level of 1.60X to 7.43X. If PRLB’s ratio of enterprise value/revenue were to rise to 7.43X, its stock price would increase by $114 from the current level of $31.
VALUE TARGETS
With future capital returns forecasted to be above the cost of capital, PRLB is expected to be a modest Value Builder.
Proto Labs’ current Price Target of $41 represents a +31% change from the current price of $31.14.
This neutral appreciation potential results in an appreciation score of 48 (52% of the universe has greater appreciation potential.)
With this neutral Appreciation Score of 48, the high Power Rating of 87 results in an Value Trend Rating of B.
Proto Labs’ current Price Target is $41 (+18% from the 2023 Target of $34 and +31% from the 05/02/24 price of $31.14). This slight rise in the Target is the result of a +0% decrease in the equity base and a +19% increase in the price/equity multiple. The forecasted increase in return on equity has a very large positive impact on the price/equity multiple and the forecasted decline in cost of equity has a very slight positive impact as well. Partially offsetting these Drivers, the forecasted decline in growth has a slight negative impact.
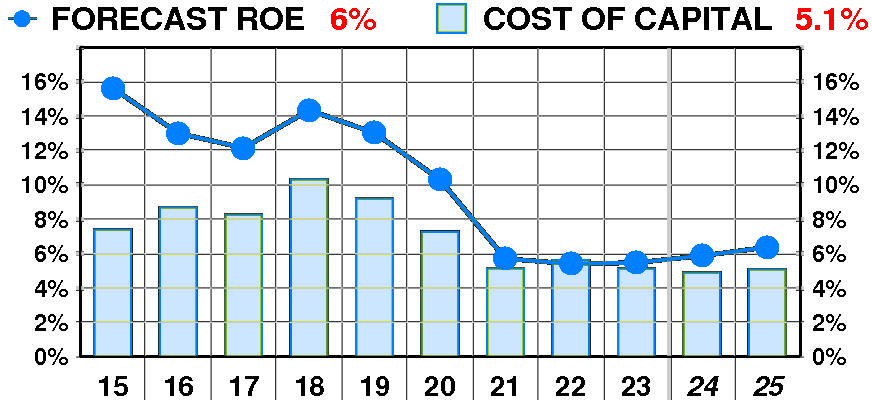
PTR’s return on equity forecast is 6.4% — in line with our recent forecasts. Forecasted return on equity suffered a dramatic, steady decline between 2015 and 2023. The current forecast is well below the 2015 peak of 16%.
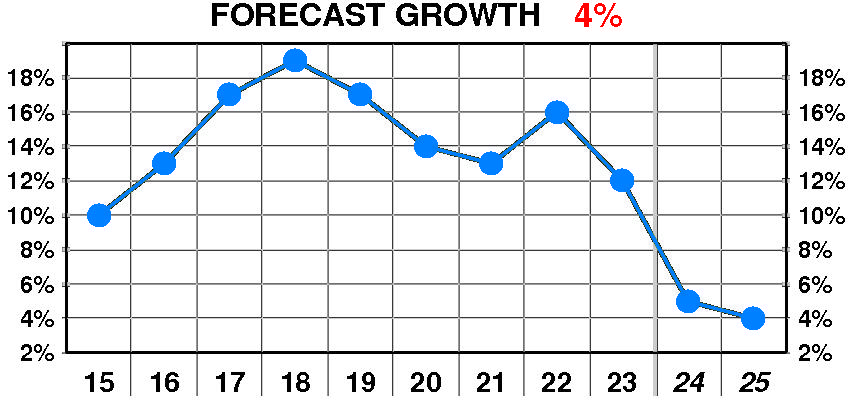
PTR’s growth forecast is 4.0% — below our recent forecasts. Forecasted growth exhibited a slight, erratic increase between 2015 and 2023. The current forecast is significantly below the 2018 peak of 19%.
PTR’s cost of equity forecast is 5.1% — in line with recent levels. Forecasted cost of equity enjoyed a dramatic, erratic decline between 2015 and 2023. The current forecast is well below the 2018 peak of 10.3%.
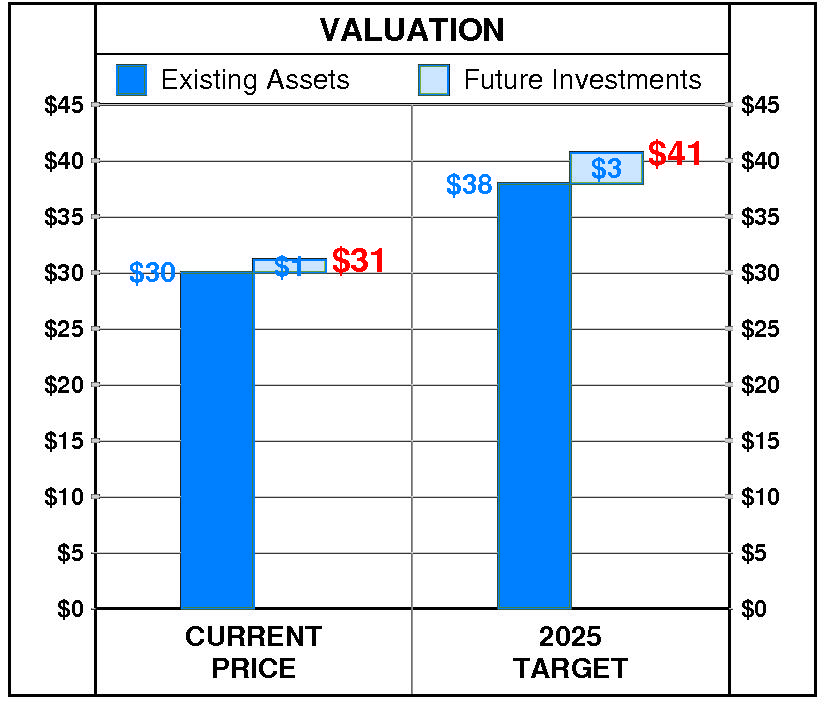
At Proto Labs’ current price of $31.14, investors are placing a positive value of $1 on its future investments. This view is consistent with the company’s most recent performance that reflected a growth rate of 12.0% per year, and a return on equity of 5.5% versus a cost of equity of 5.1%.
PTR’s 2025 Price Target of $41 is based on these forecasts and reflects an estimated value of existing assets of $38 and a value of future investments of $3.
Be the first to comment