![]()
BUSINESS
Tilly’s, Inc. operates as a specialty retailer of casual apparel, footwear, accessories, and hardgoods for young men and women, and boys and girls in the United States. Its apparel merchandise includes tops, outerwear, bottoms, and dresses; and accessories merchandise comprises backpacks, hydration bottles, hats, sunglasses, small electronics and accessories, handbags, watches, jewelry, and others, as well as hardgoods consists of skateboards, longboards, bikes, roller-skates, and equipment for snowboarding and surfing. The company also provides third-party merchandise assortment across its various product categories. As of March 14, 2022, it operated 241 stores. The company also sells its merchandise through its e-commerce website, tillys.com. Tilly’s, Inc. was founded in 1982 and is headquartered in Irvine, California.
INVESTMENT RATING
TLYS is expected to be Value Creation neutral reflecting capital returns that are forecasted to be in line with the cost of capital.
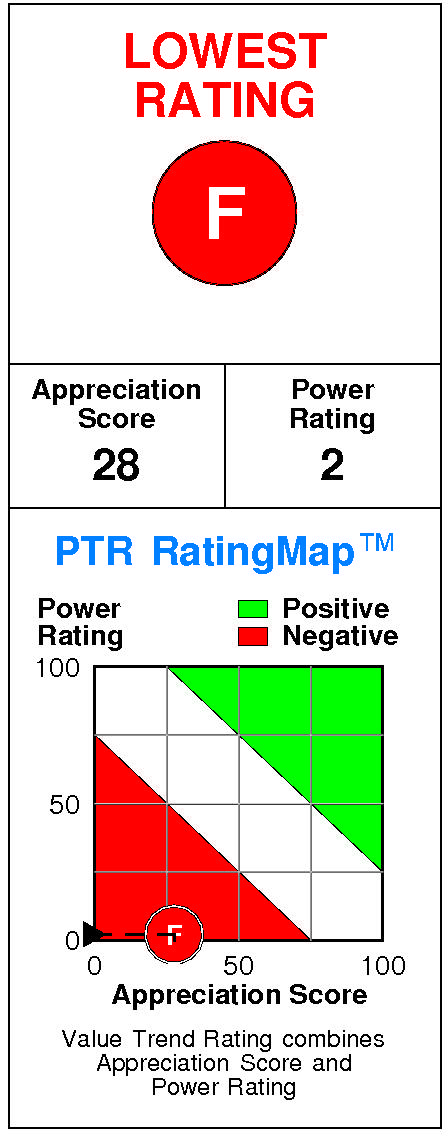
Tilly’s has a current Value Trend Rating of F (Lowest Rating).
With this rating, PTR’s two proprietary measures of a stock’s current attractiveness are providing consistent signals. Tilly’s has a poor Appreciation Score of 28 and a very low Power Rating of 2, producing the Lowest Value Trend Rating.
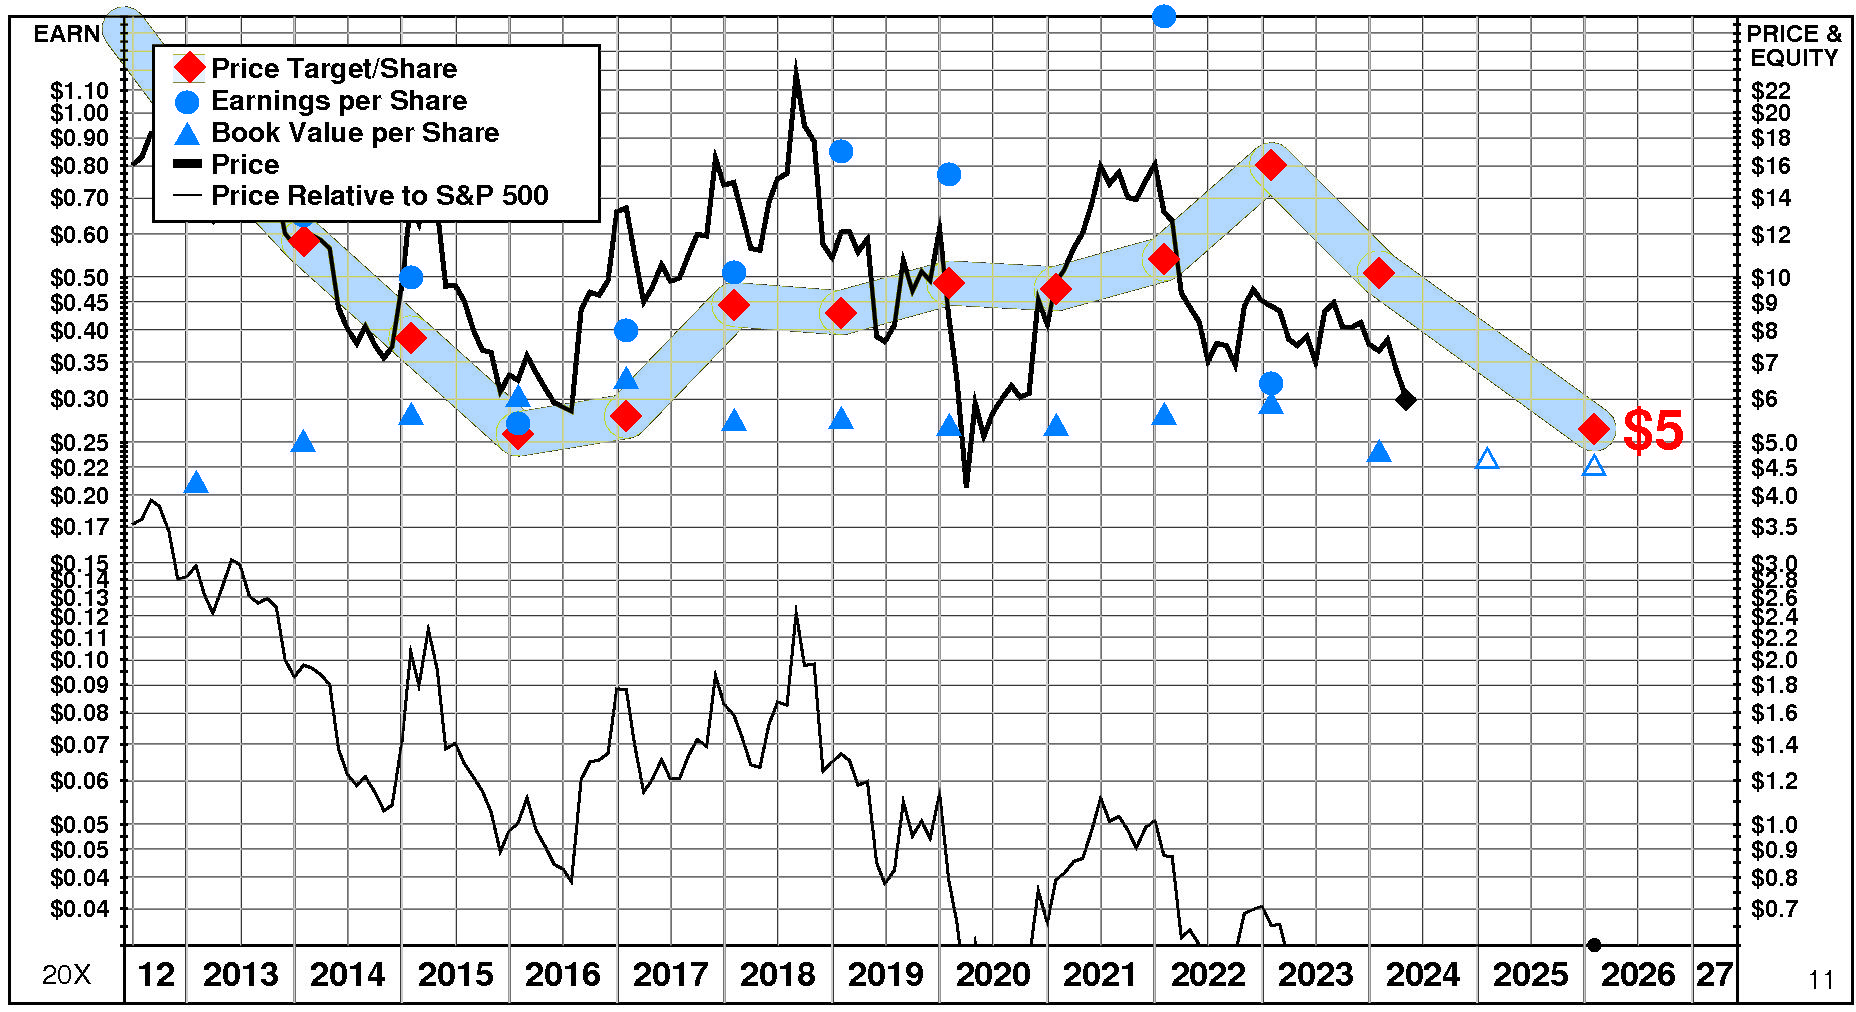
Tilly’s stock is selling above targeted value. The current stock price of $5.98 compares to targeted value 12 months forward of $5.
This low appreciation potential results in an appreciation score of 28 (72% of the universe has greater appreciation potential.)
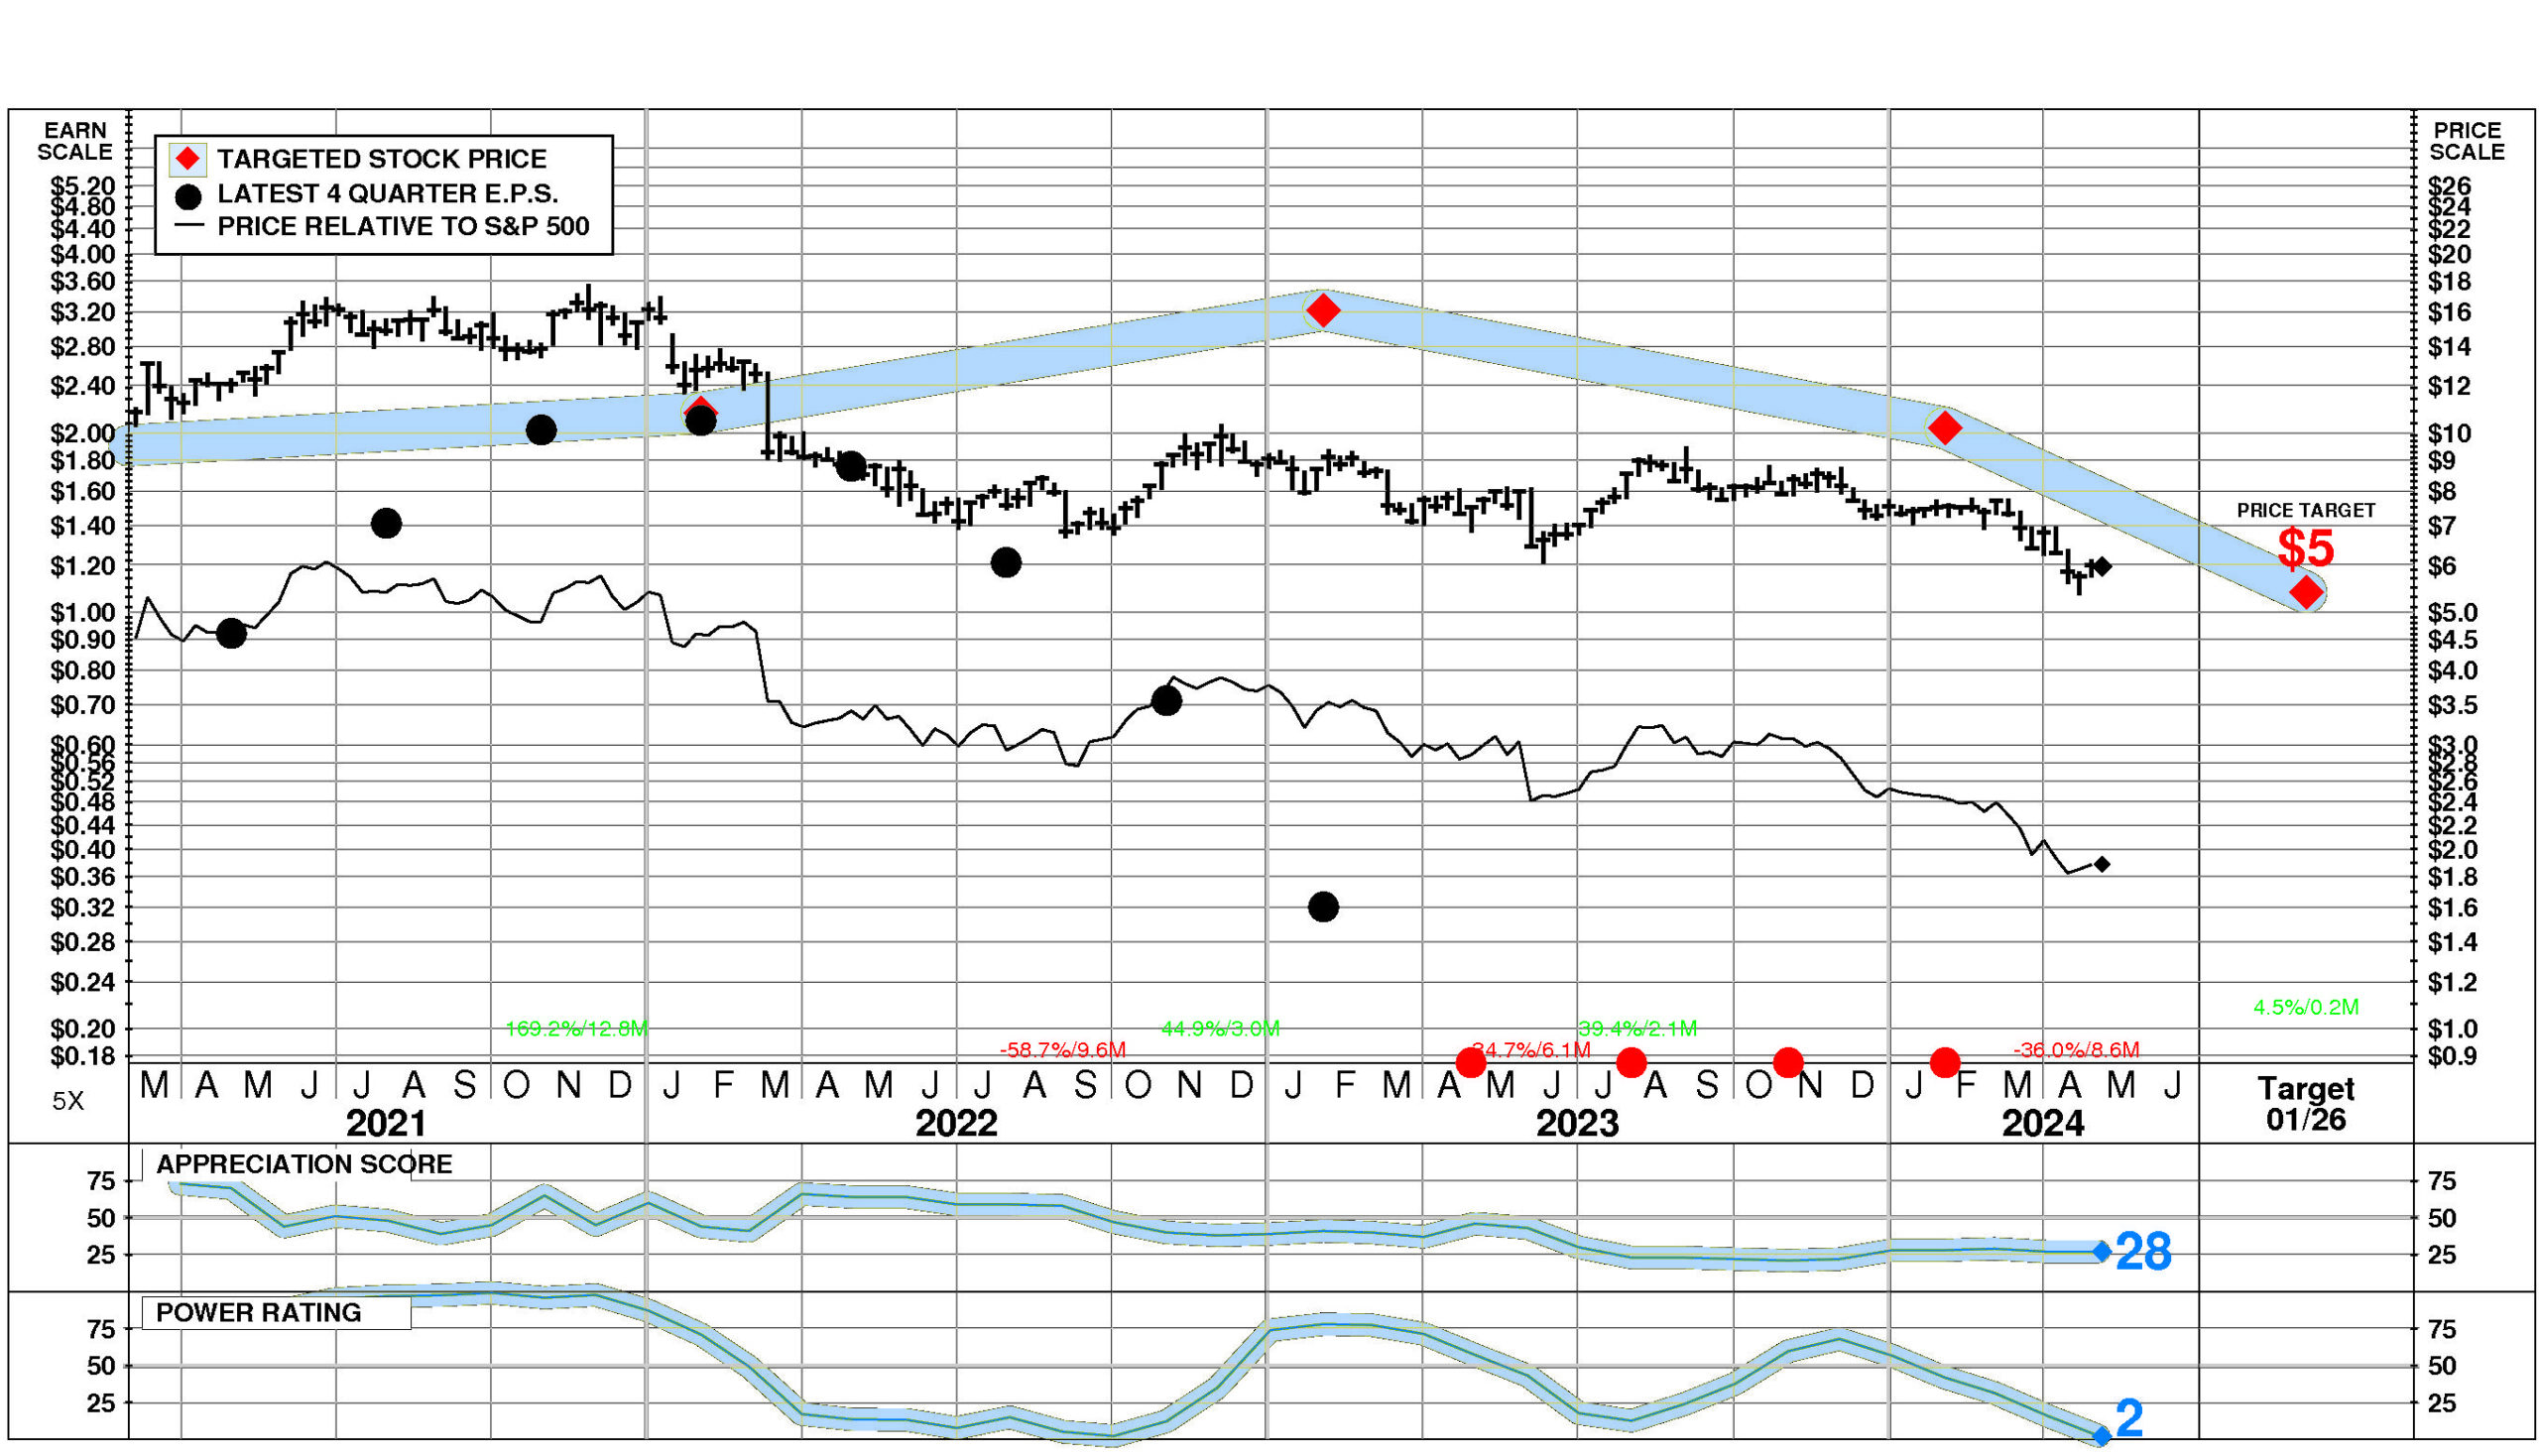
Tilly’s has a Power Rating of 2. (This very low Power Rating indicates that TLYS only has a better chance of achieving attractive investment performance over the near to intermediate term than 2% of companies in the universe.)
Factors contributing to this very low Power Rating include: TLYS’ earnings estimates have fallen very significantly in recent months; the Apparel and Accessory Stores comparison group is currently in an unfavorable position; and recent price action has been unfavorable.
INVESTMENT PROFILE
Tilly’s financial strength is low. Financial strength rating is 14.
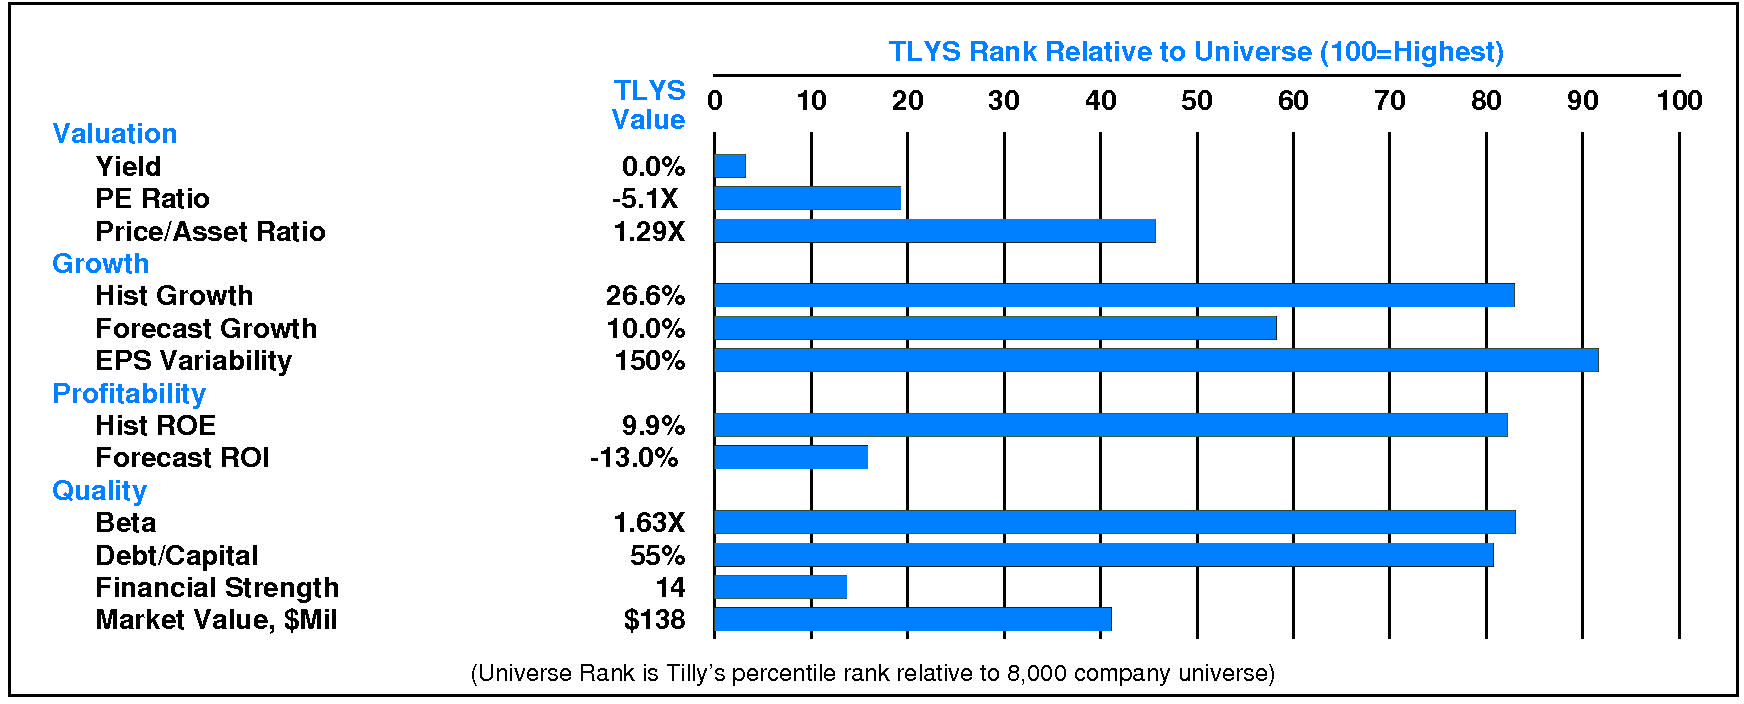
Relative to the S&P 500 Composite, Tilly’s Inc has neutral Growth/Value characteristics; its appeal is likely to be to Capital Gain-oriented investors; the perception is that TLYS is extremely high risk. High historical growth is a positive for Tilly’s. Relative weaknesses include: low financial strength, high stock price volatility, and high earnings variability. Tilly’s valuation is moderate: low dividend yield, moderate P/E ratio, and low price/book ratio. TLYS has unusually low market capitalization.
CURRENT SIGNALS
Tilly’s current operations are eroding. Return on equity is falling, reflecting: falling asset utilization; declining pretax margin; and falling leverage.
Tilly’s current technical position is very weak. The stock price is in a 8.6 month down move. The stock has declined 26.5% from its prior high. The stock price is below its 200 day moving average which is in a downtrend.
ALERTS
Recent notable negative changes in investment behavior have affected Tilly’s Inc (NYSE: TLYS): negative upside/downside volume developed.
Recent small negative changes in fundamentals have affected Tilly’s Inc (NYSE: TLYS): significant quarterly earnings deceleration occurred.
The stock is currently rated F.
On 5/2/24, Tilly’s Inc (NYSE: TLYS) stock enjoyed a large increase of 2.0%, closing at $5.98. However, this advance was accompanied by exceptionally low trading volume at 49% of normal. Relative to the market the stock has been extremely weak over the last nine months but has risen 1.2% during the last week.
CASH FLOW
In 2024, Tilly’s experienced a significant decline in cash of -$18.23 million (-16%). Sources of cash were lower than uses. Cash consumed from 2024 EBITDA totaled -$18.15 million. Non-operating sources contributed +$5.20 million (-29% of EBITDA). Cash taxes consumed -$8.71 million (+48% of EBITDA). Withdrawal of investment from the business totaled +$11.28 million (-62% of EBITDA). On a net basis, debt investors pulled out -$10.41 million (+57% of EBITDA) while equity investors contributed +$2.56 million (-14% of EBITDA).
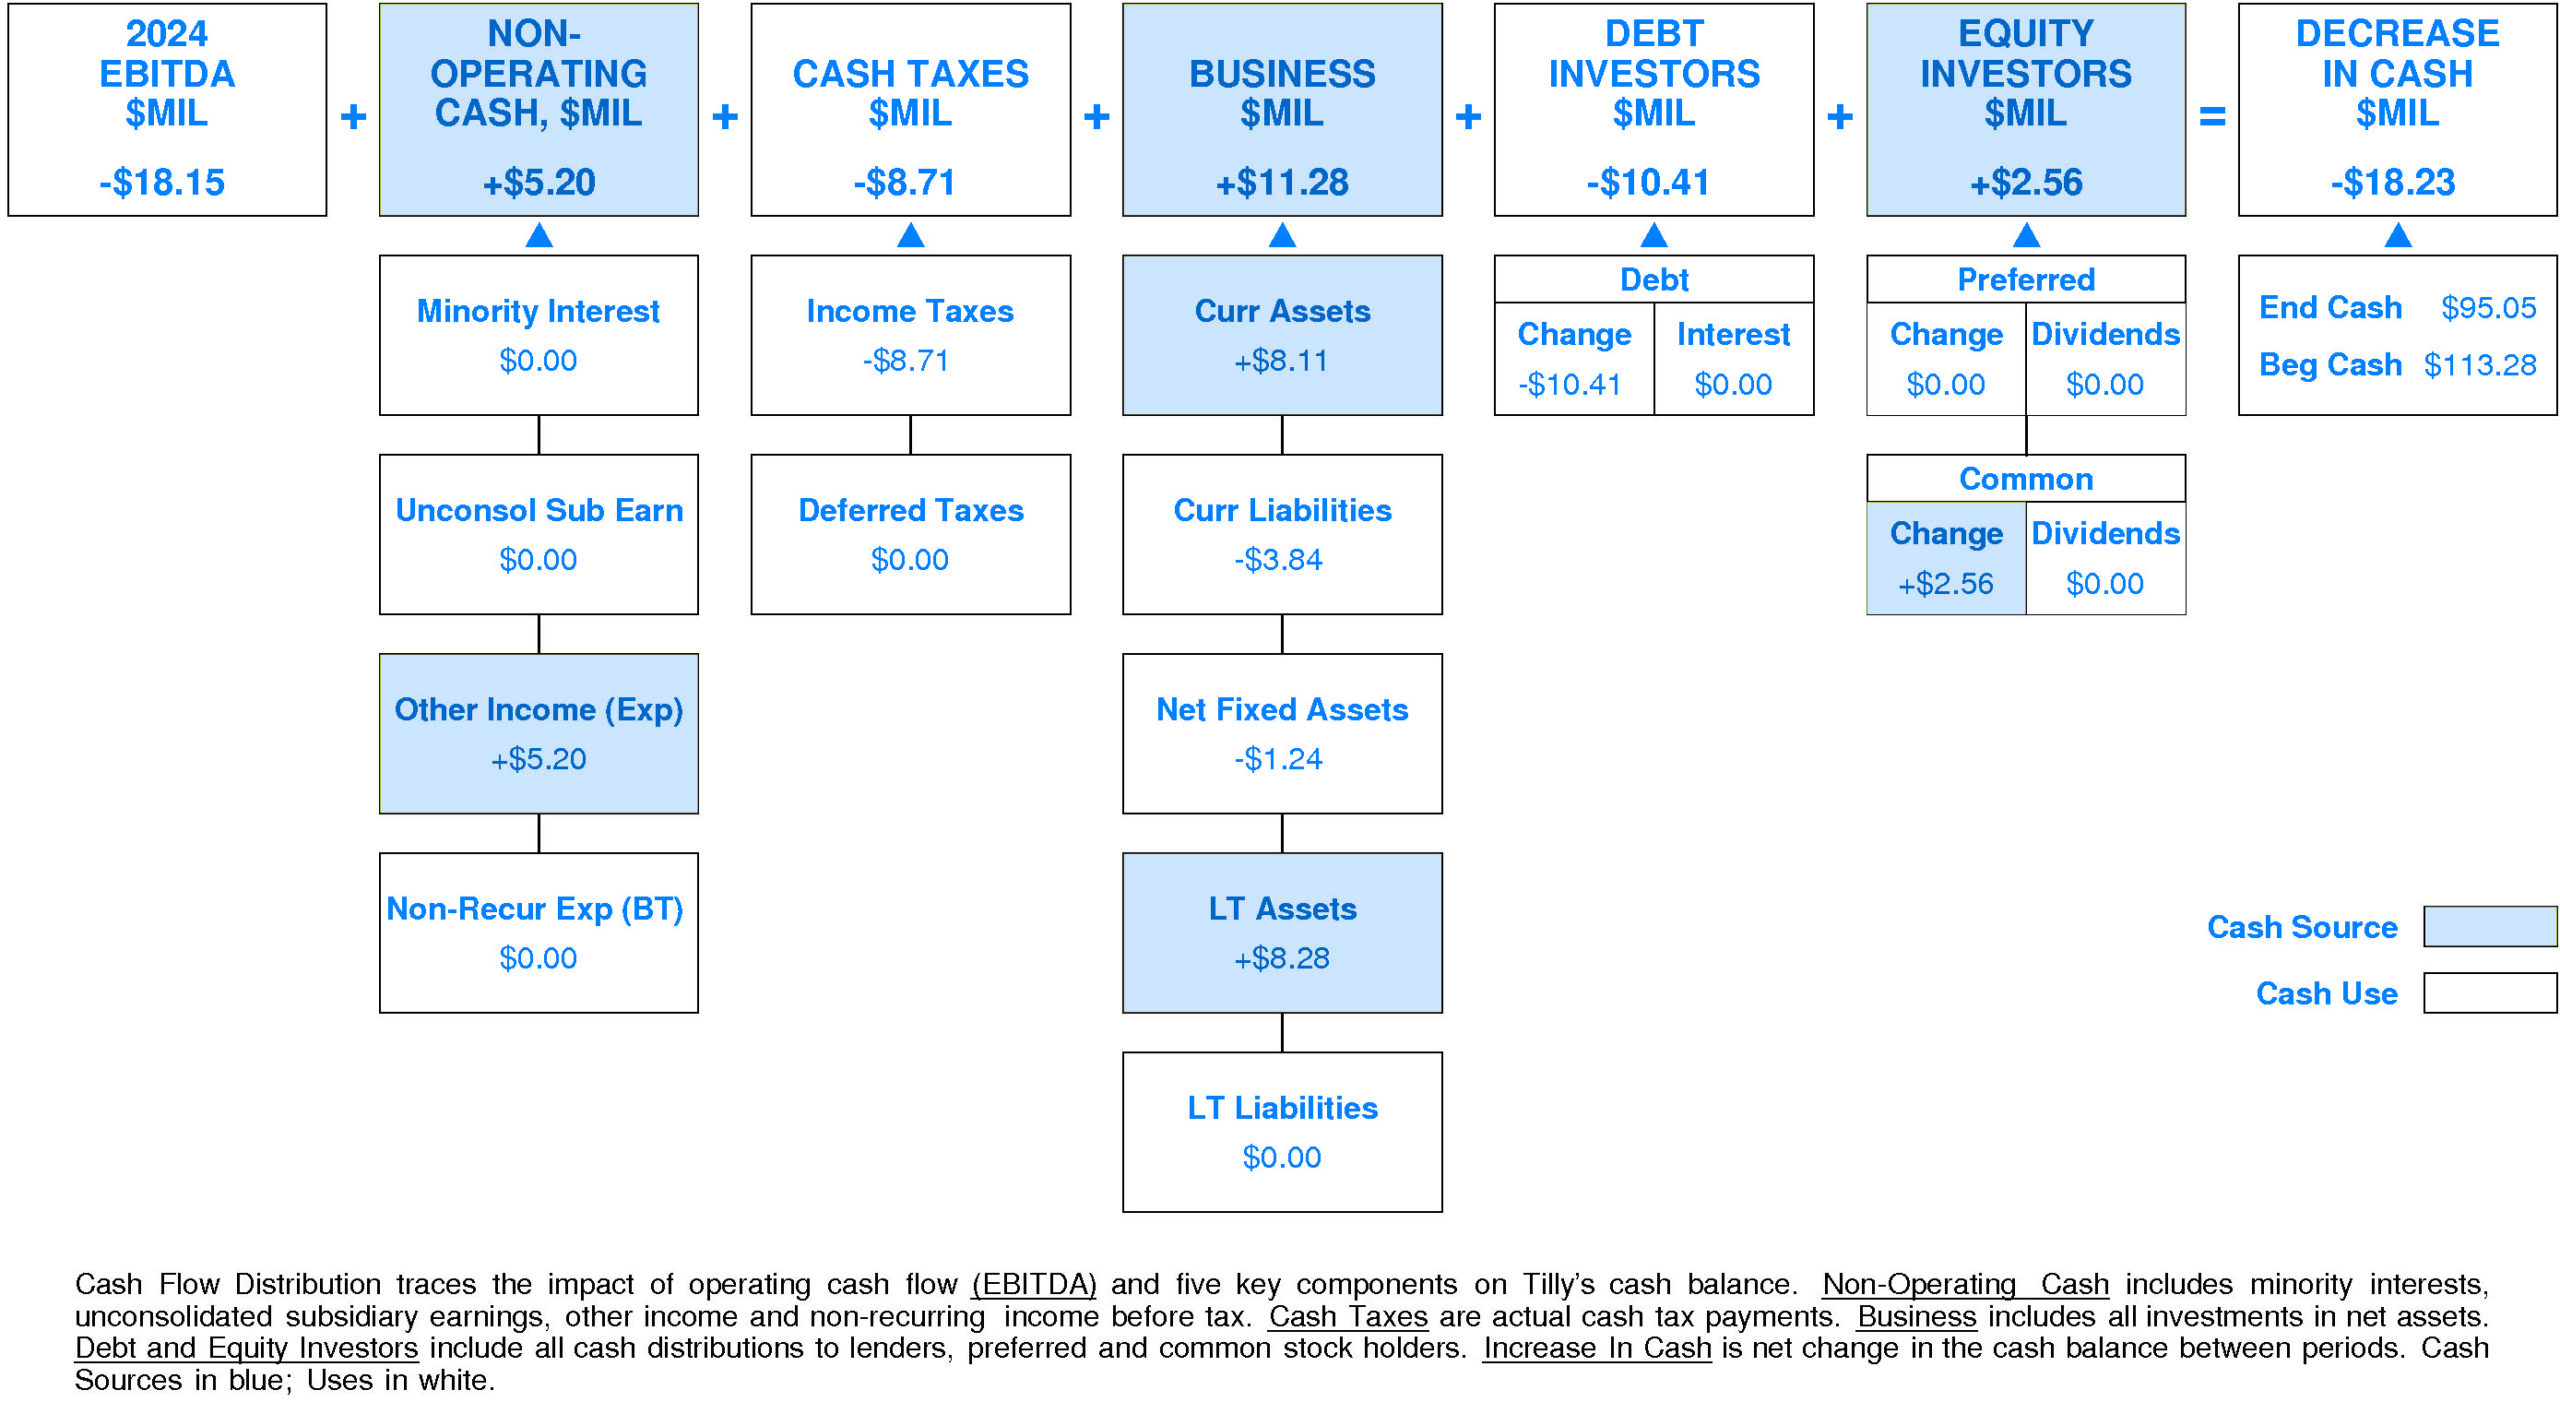
Tilly’s Non-operating Income, %EBITDA has experienced a downtrend over the period. This downtrend was accompanied by stability for the Tilly’s Peer Group. In most years, Tilly’s was in the third quartile and top quartile. Currently, Tilly’s is lower quartile at -29% of EBITDA (+$5.20 million).
Tilly’s Cash Taxes, %EBITDA enjoyed a very strong overall uptrend over the period. This improvement was accompanied by a similar trend for the Tilly’s Peer Group. (Since 2022 Cash Taxes, %EBITDA has accelerated very sharply.) In most years, Tilly’s was in the second quartile and top quartile. Currently, Tilly’s is upper quartile at +48% of EBITDA (-$8.71 million).
Tilly’s Business Re-investment, %EBITDA has suffered a volatile overall downtrend over the period. This downtrend was accompanied by a similar trend for the Tilly’s Peer Group. In most years, Tilly’s was in the top quartile and second quartile. Currently, Tilly’s is substantially below median at -62% of EBITDA (+$11.28 million).
Tilly’s Debt Investors, %EBITDA has experienced a volatile overall uptrend over the period. This improvement was accompanied by a similar trend for the Tilly’s Peer Group. In most years, Tilly’s was in the third quartile and top quartile. Currently, Tilly’s is at the upper quartile at +57% of EBITDA (-$10.41 million).
Tilly’s Equity Investors, %EBITDA has suffered a volatile overall downtrend over the period. This downtrend was accompanied by stability for the Tilly’s Peer Group. (Since 2022 Equity Investors, %EBITDA has experienced a very sharp recovery.) In most years, Tilly’s was in the top quartile and third quartile. Currently, Tilly’s is upper quartile at -14% of EBITDA (+$2.56 million).
Tilly’s Change in Cash, %EBITDA has experienced a volatile overall downtrend over the period. This downtrend was accompanied by stability for the Tilly’s Peer Group. In most years, Tilly’s was in the top quartile and third quartile. Currently, Tilly’s is upper quartile at +100% of EBITDA (-$18.23 million).
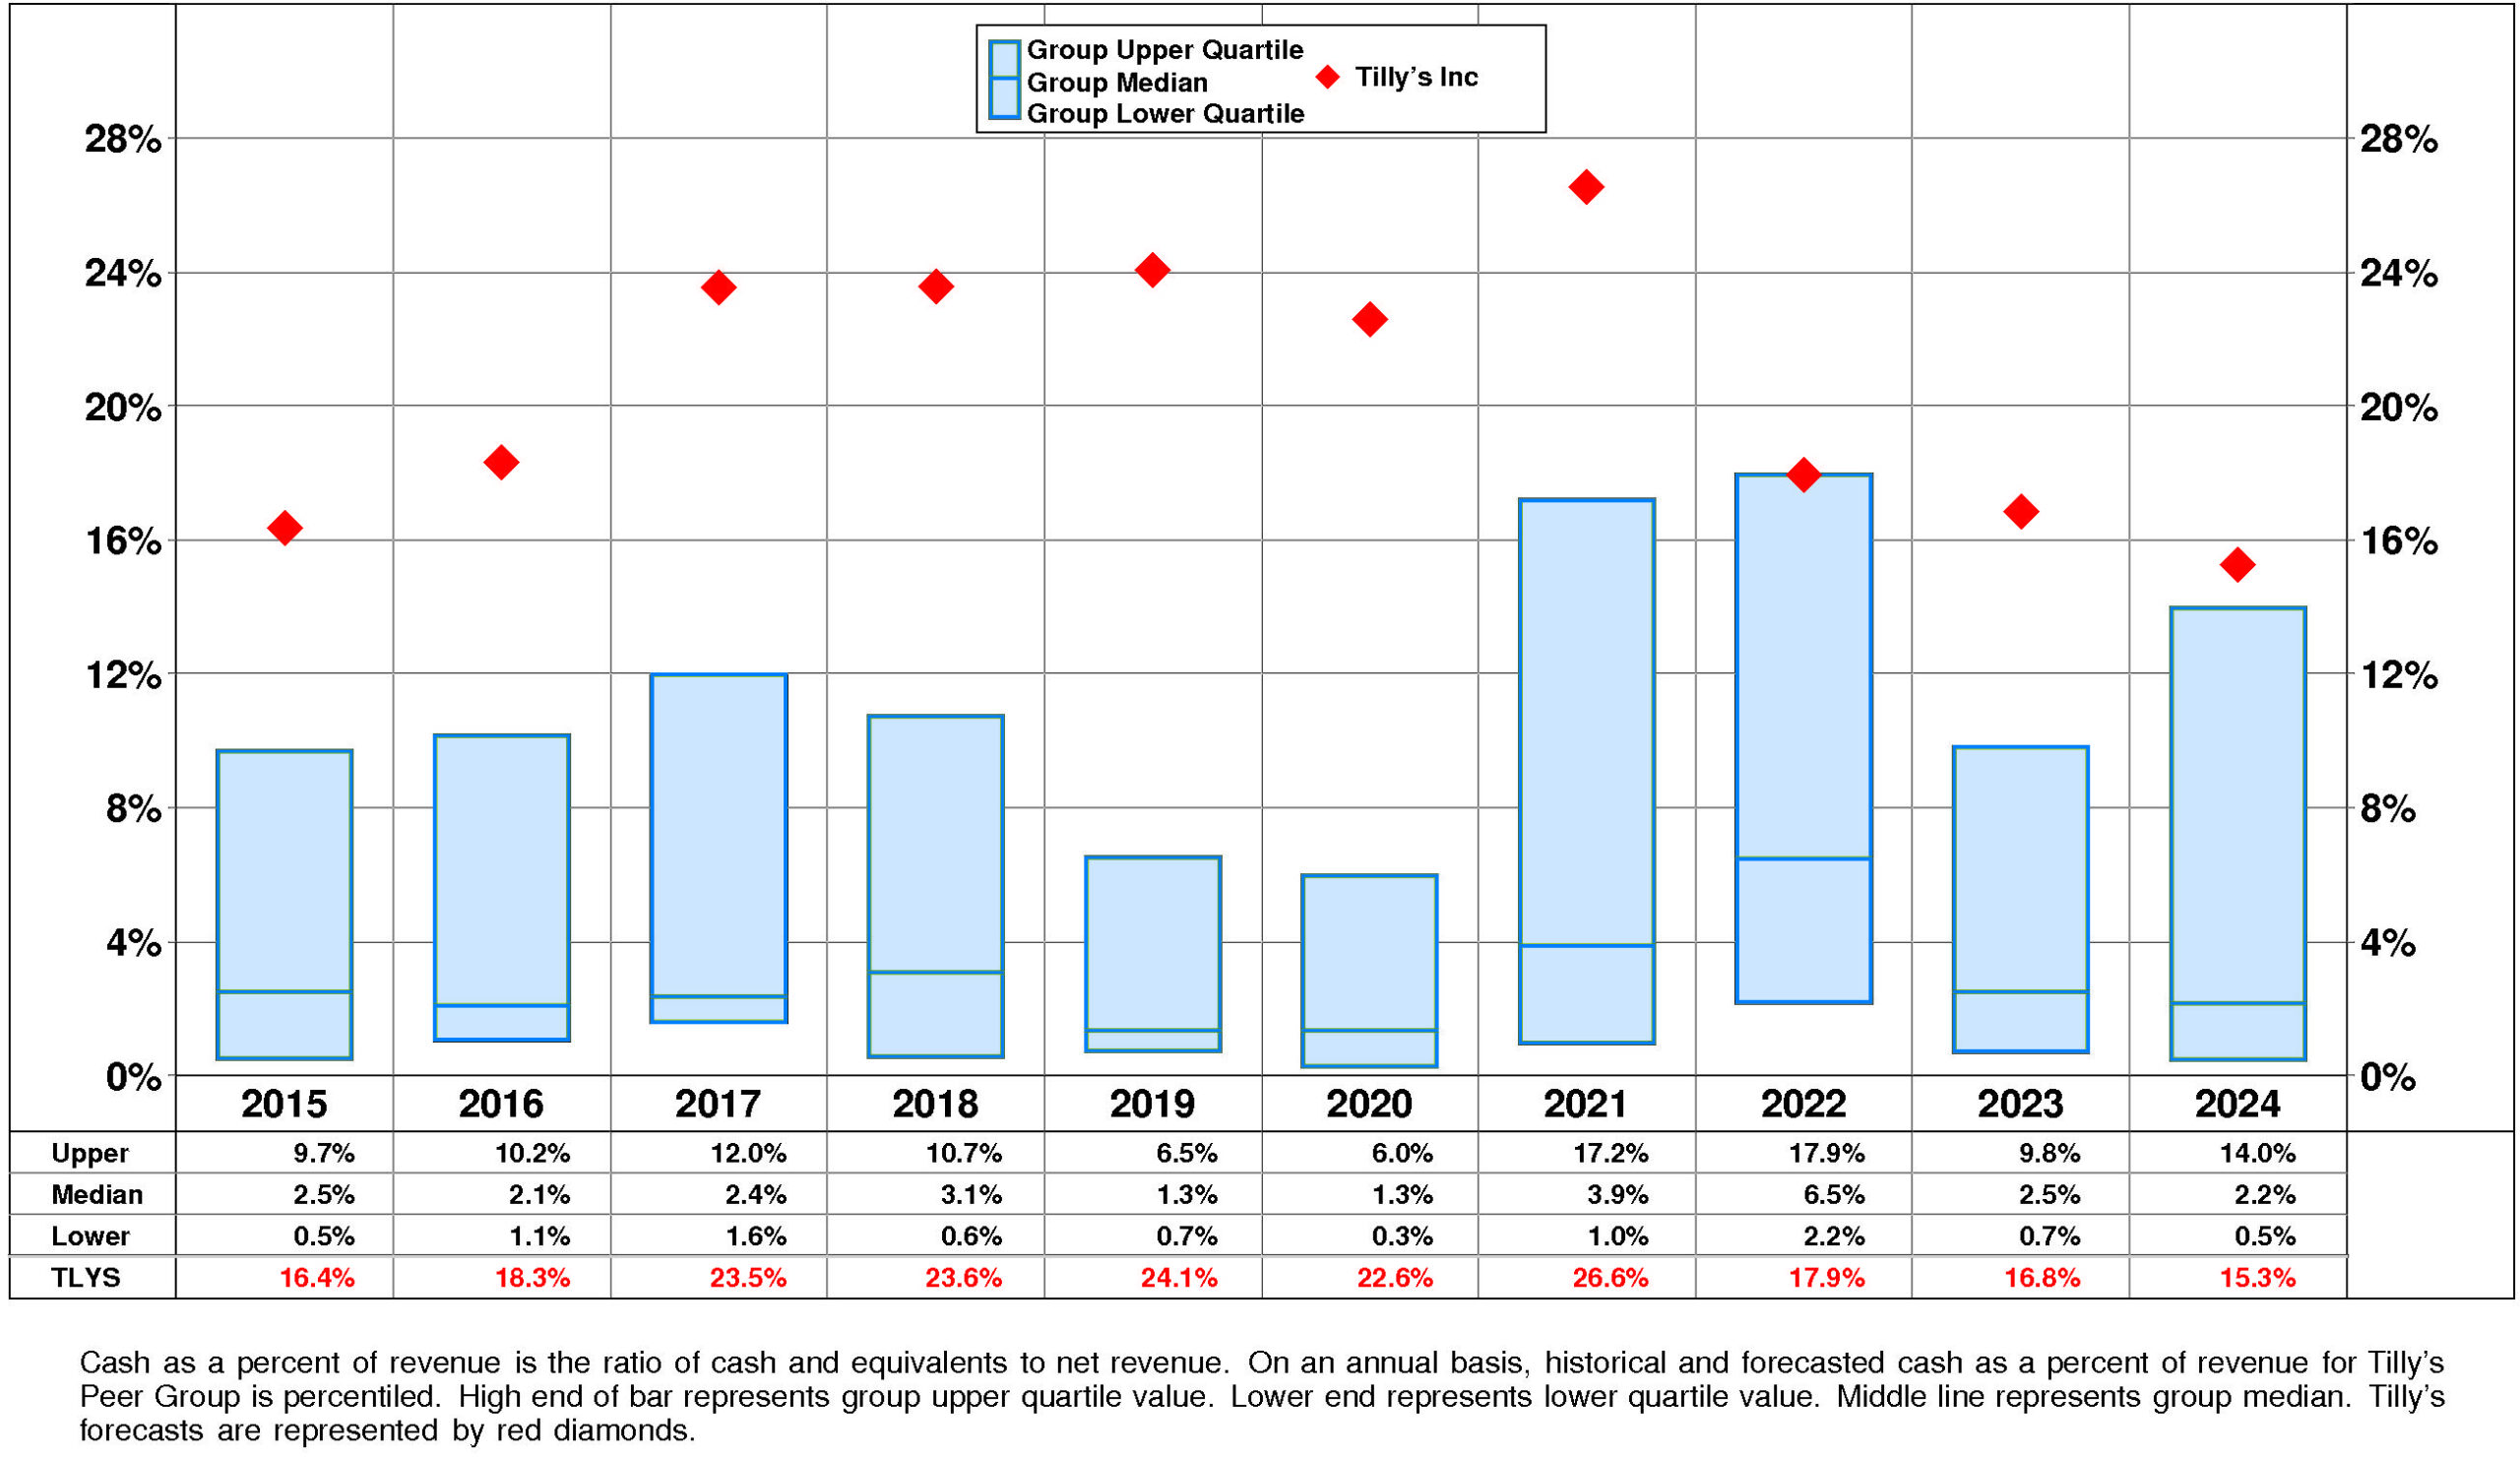
Tilly’s Cash, %Revenue has exhibited little to no overall change over the period. This stability was accompanied by stability for the Tilly’s Peer Group as well. (Since 2021 Cash, %Revenue has experienced a sharp decline.) In most years, Tilly’s was in the top quartile. Currently, Tilly’s is upper quartile at +15%.
PROFITABILITY
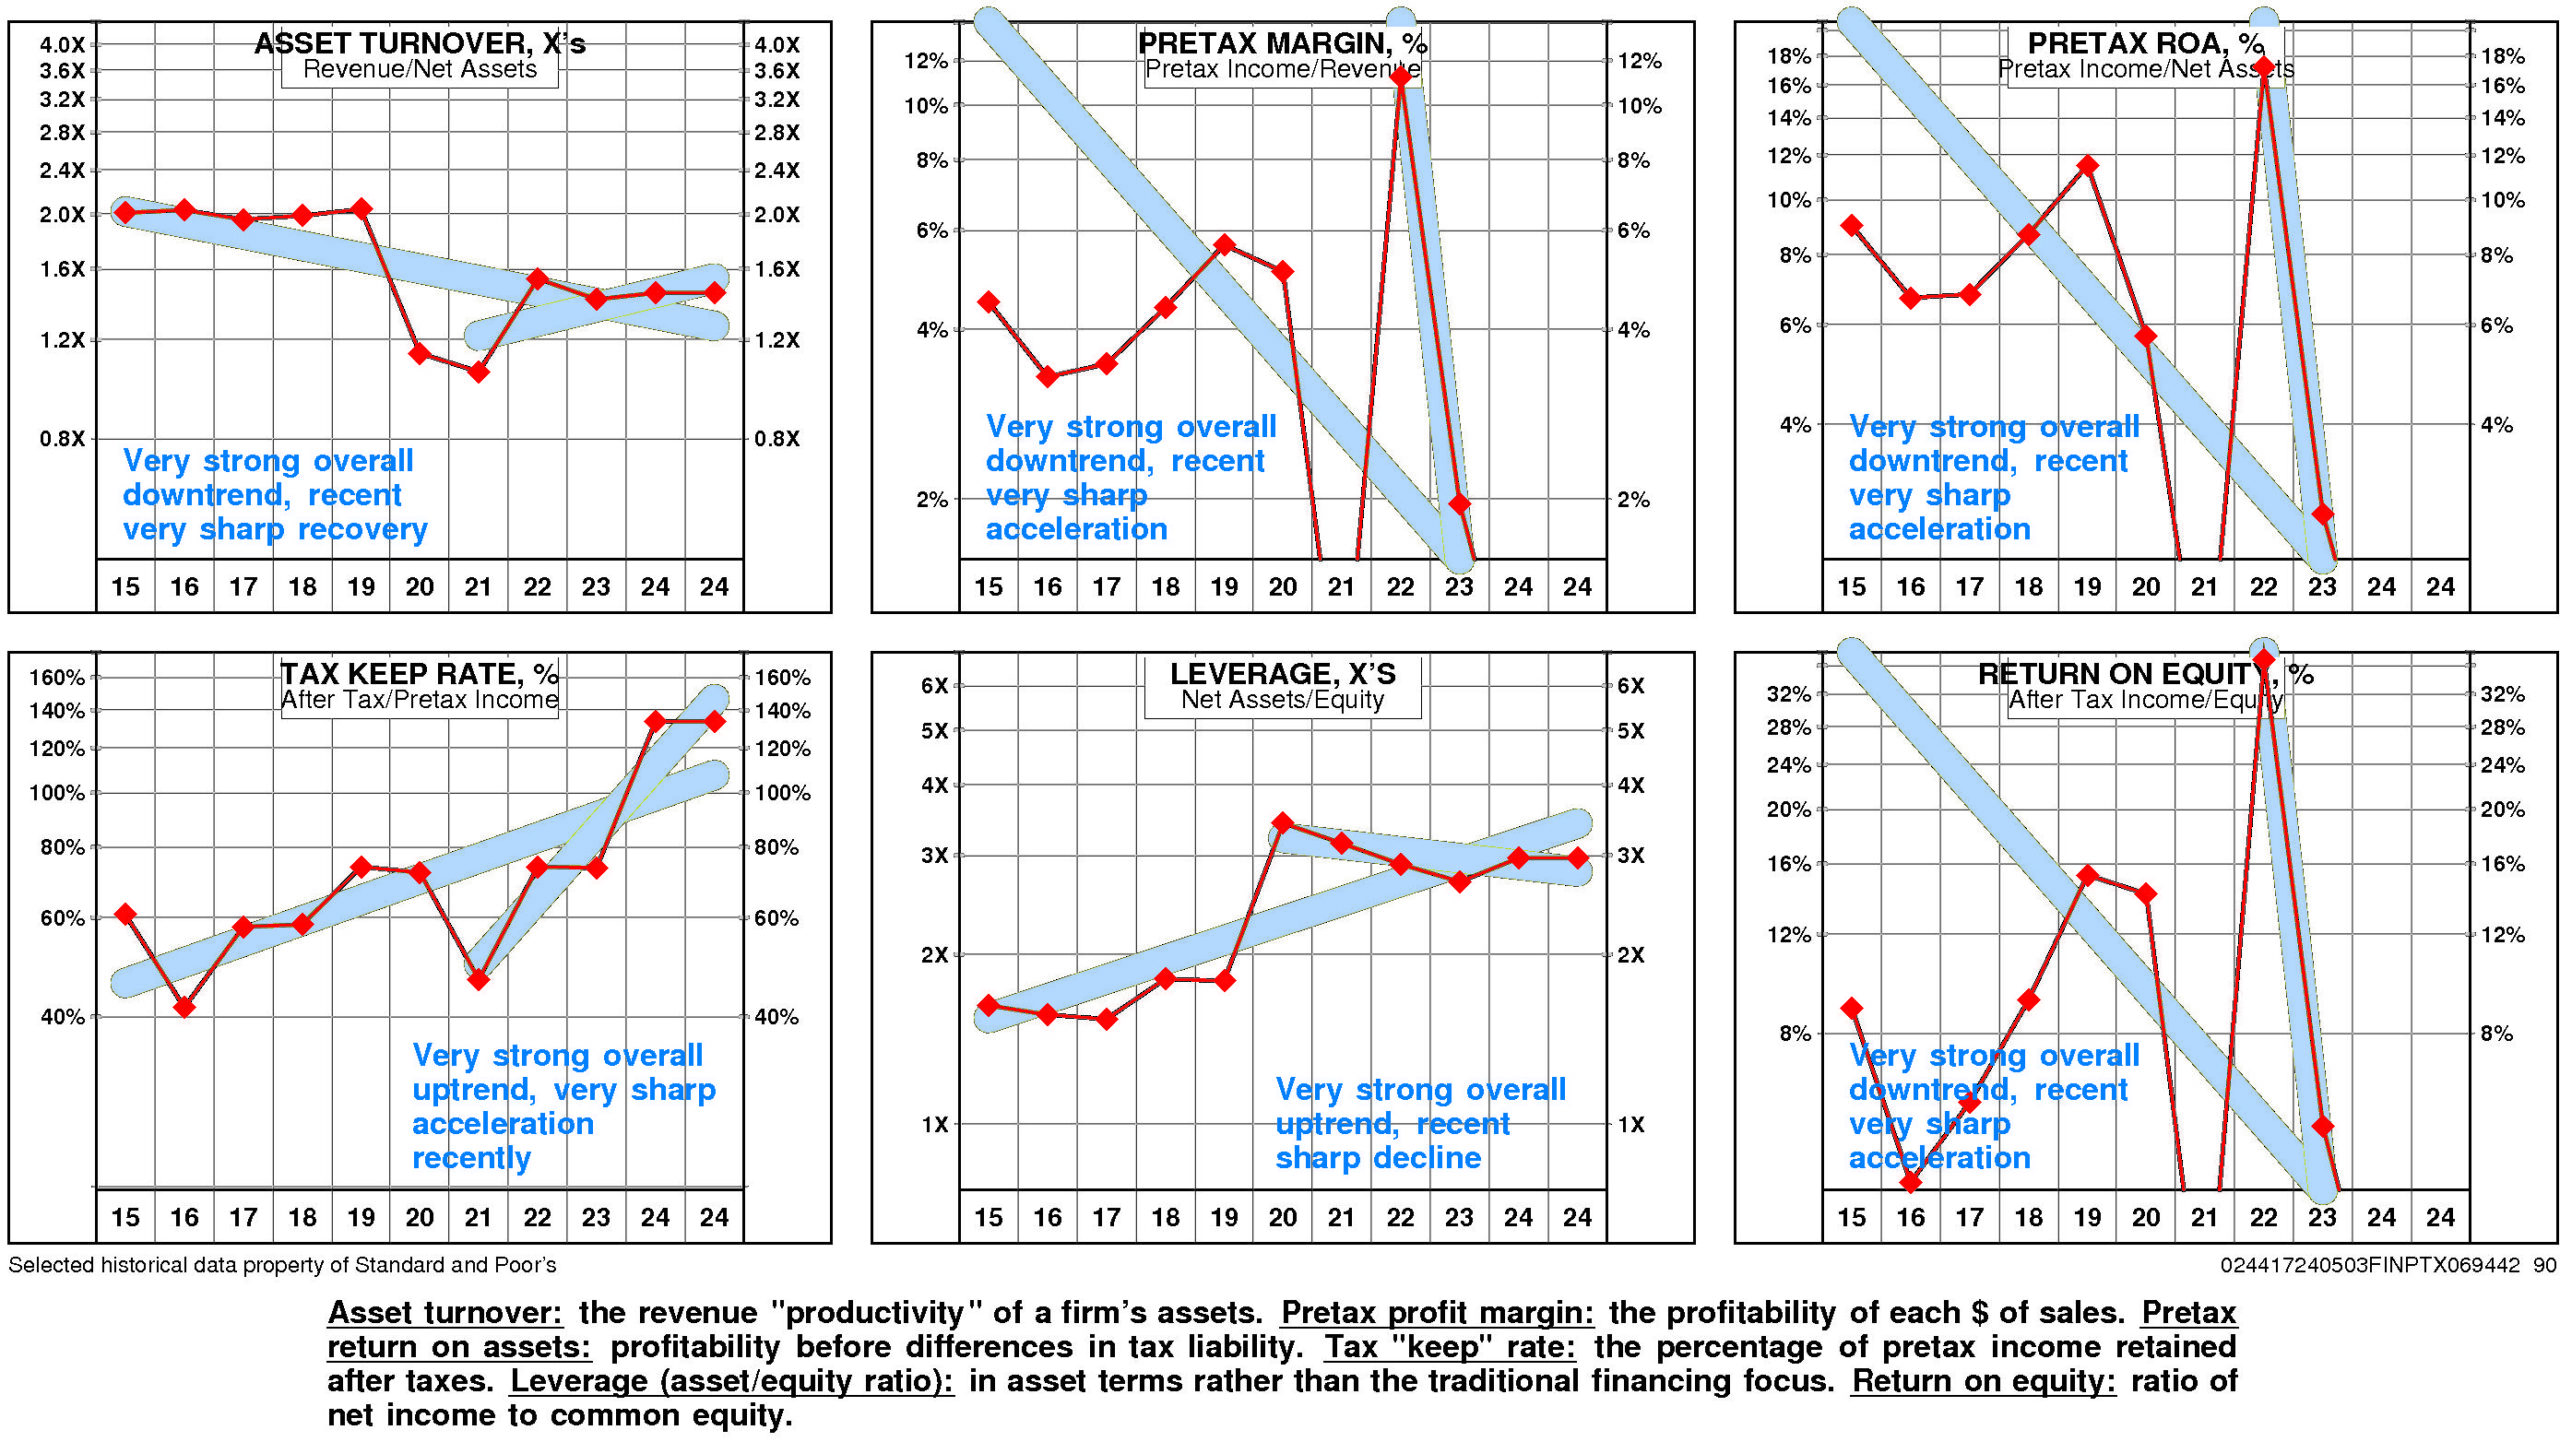
Tilly’s return on equity has eroded very significantly since 2015. The current level is -23.8% versus the high of 8.9% and the low of -23.8%.
This very significant erosion was due to very strong negative trend in pretax operating return and very strong positive trend in non-operating factors.
The productivity of Tilly’s assets declined over the full period 2015-2024: asset turnover has suffered a very strong overall downtrend but it experienced a very sharp recovery after the 2021 low.
Reinforcing this trend, pretax margin experienced a very strong overall downtrend that accelerated very sharply from the 2022 level.
Non-operating factors (income taxes and financial leverage) had a very significant positive influence on return on equity.
Tilly’s return on equity is lower quartile (-23.8%) for the four quarters ended January, 2024.
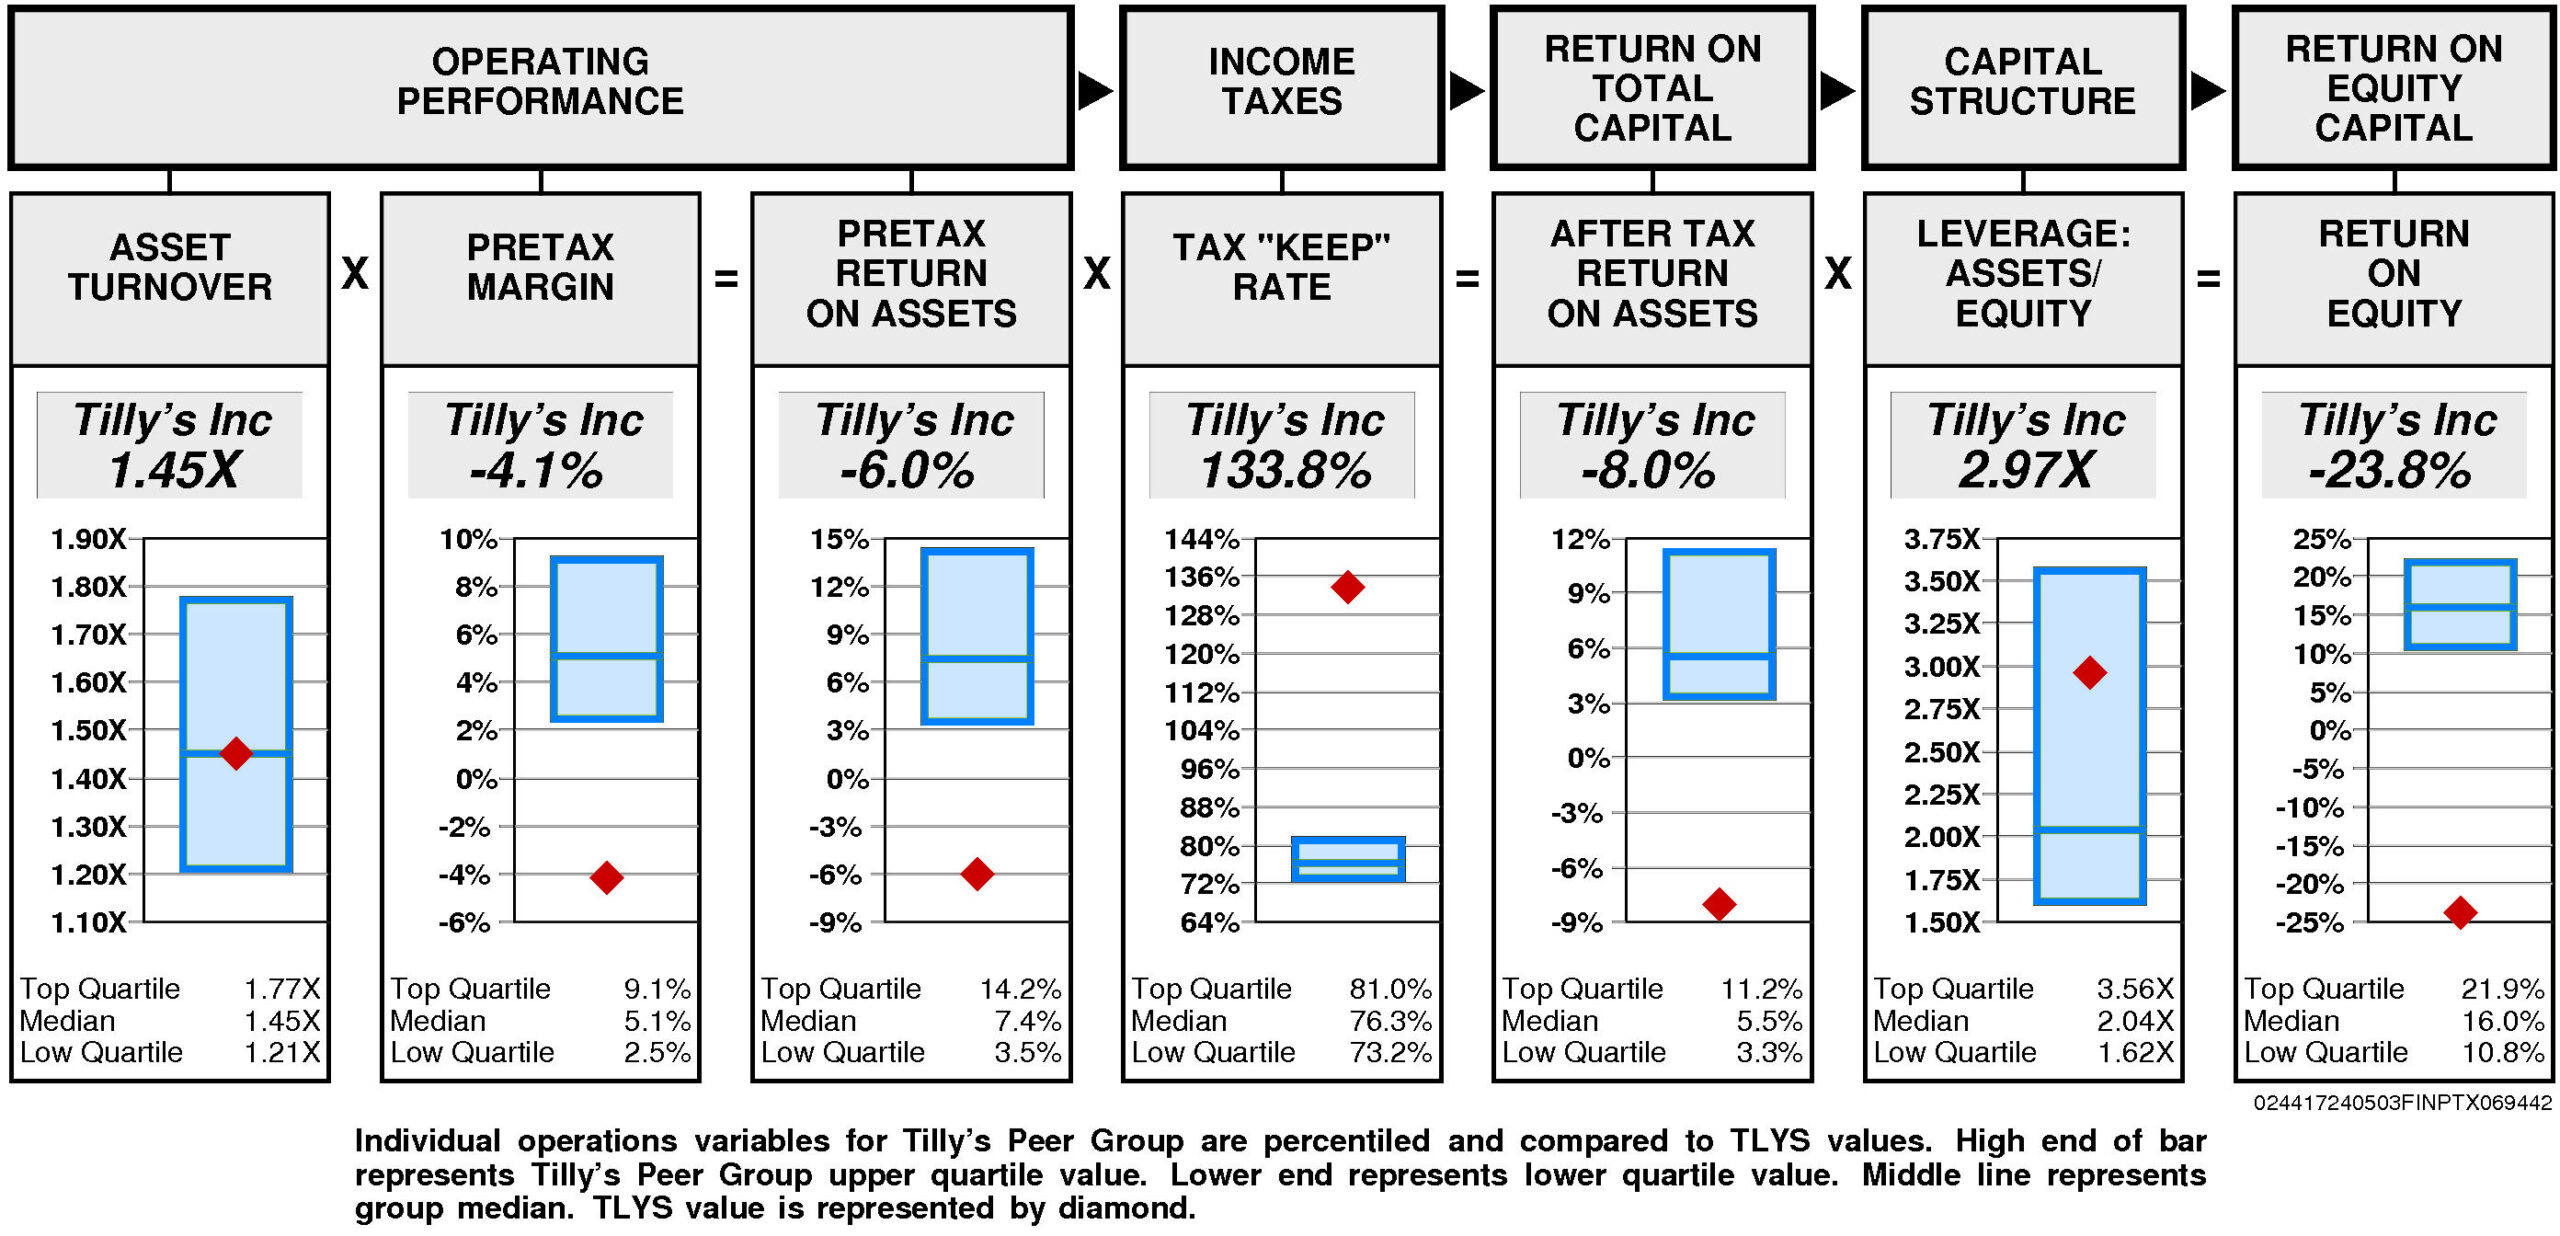
Operating performance (pretax return on assets) is lower quartile (-6.0%) reflecting asset turnover that is at median (1.45X) and lower quartile pretax margin (-4.1%).
Tax “keep” rate (income tax management) is upper quartile (133.8%) resulting in after tax return on assets that is lower quartile.
Financial leverage (leverage) is above median (2.97X).
GROWTH RATES
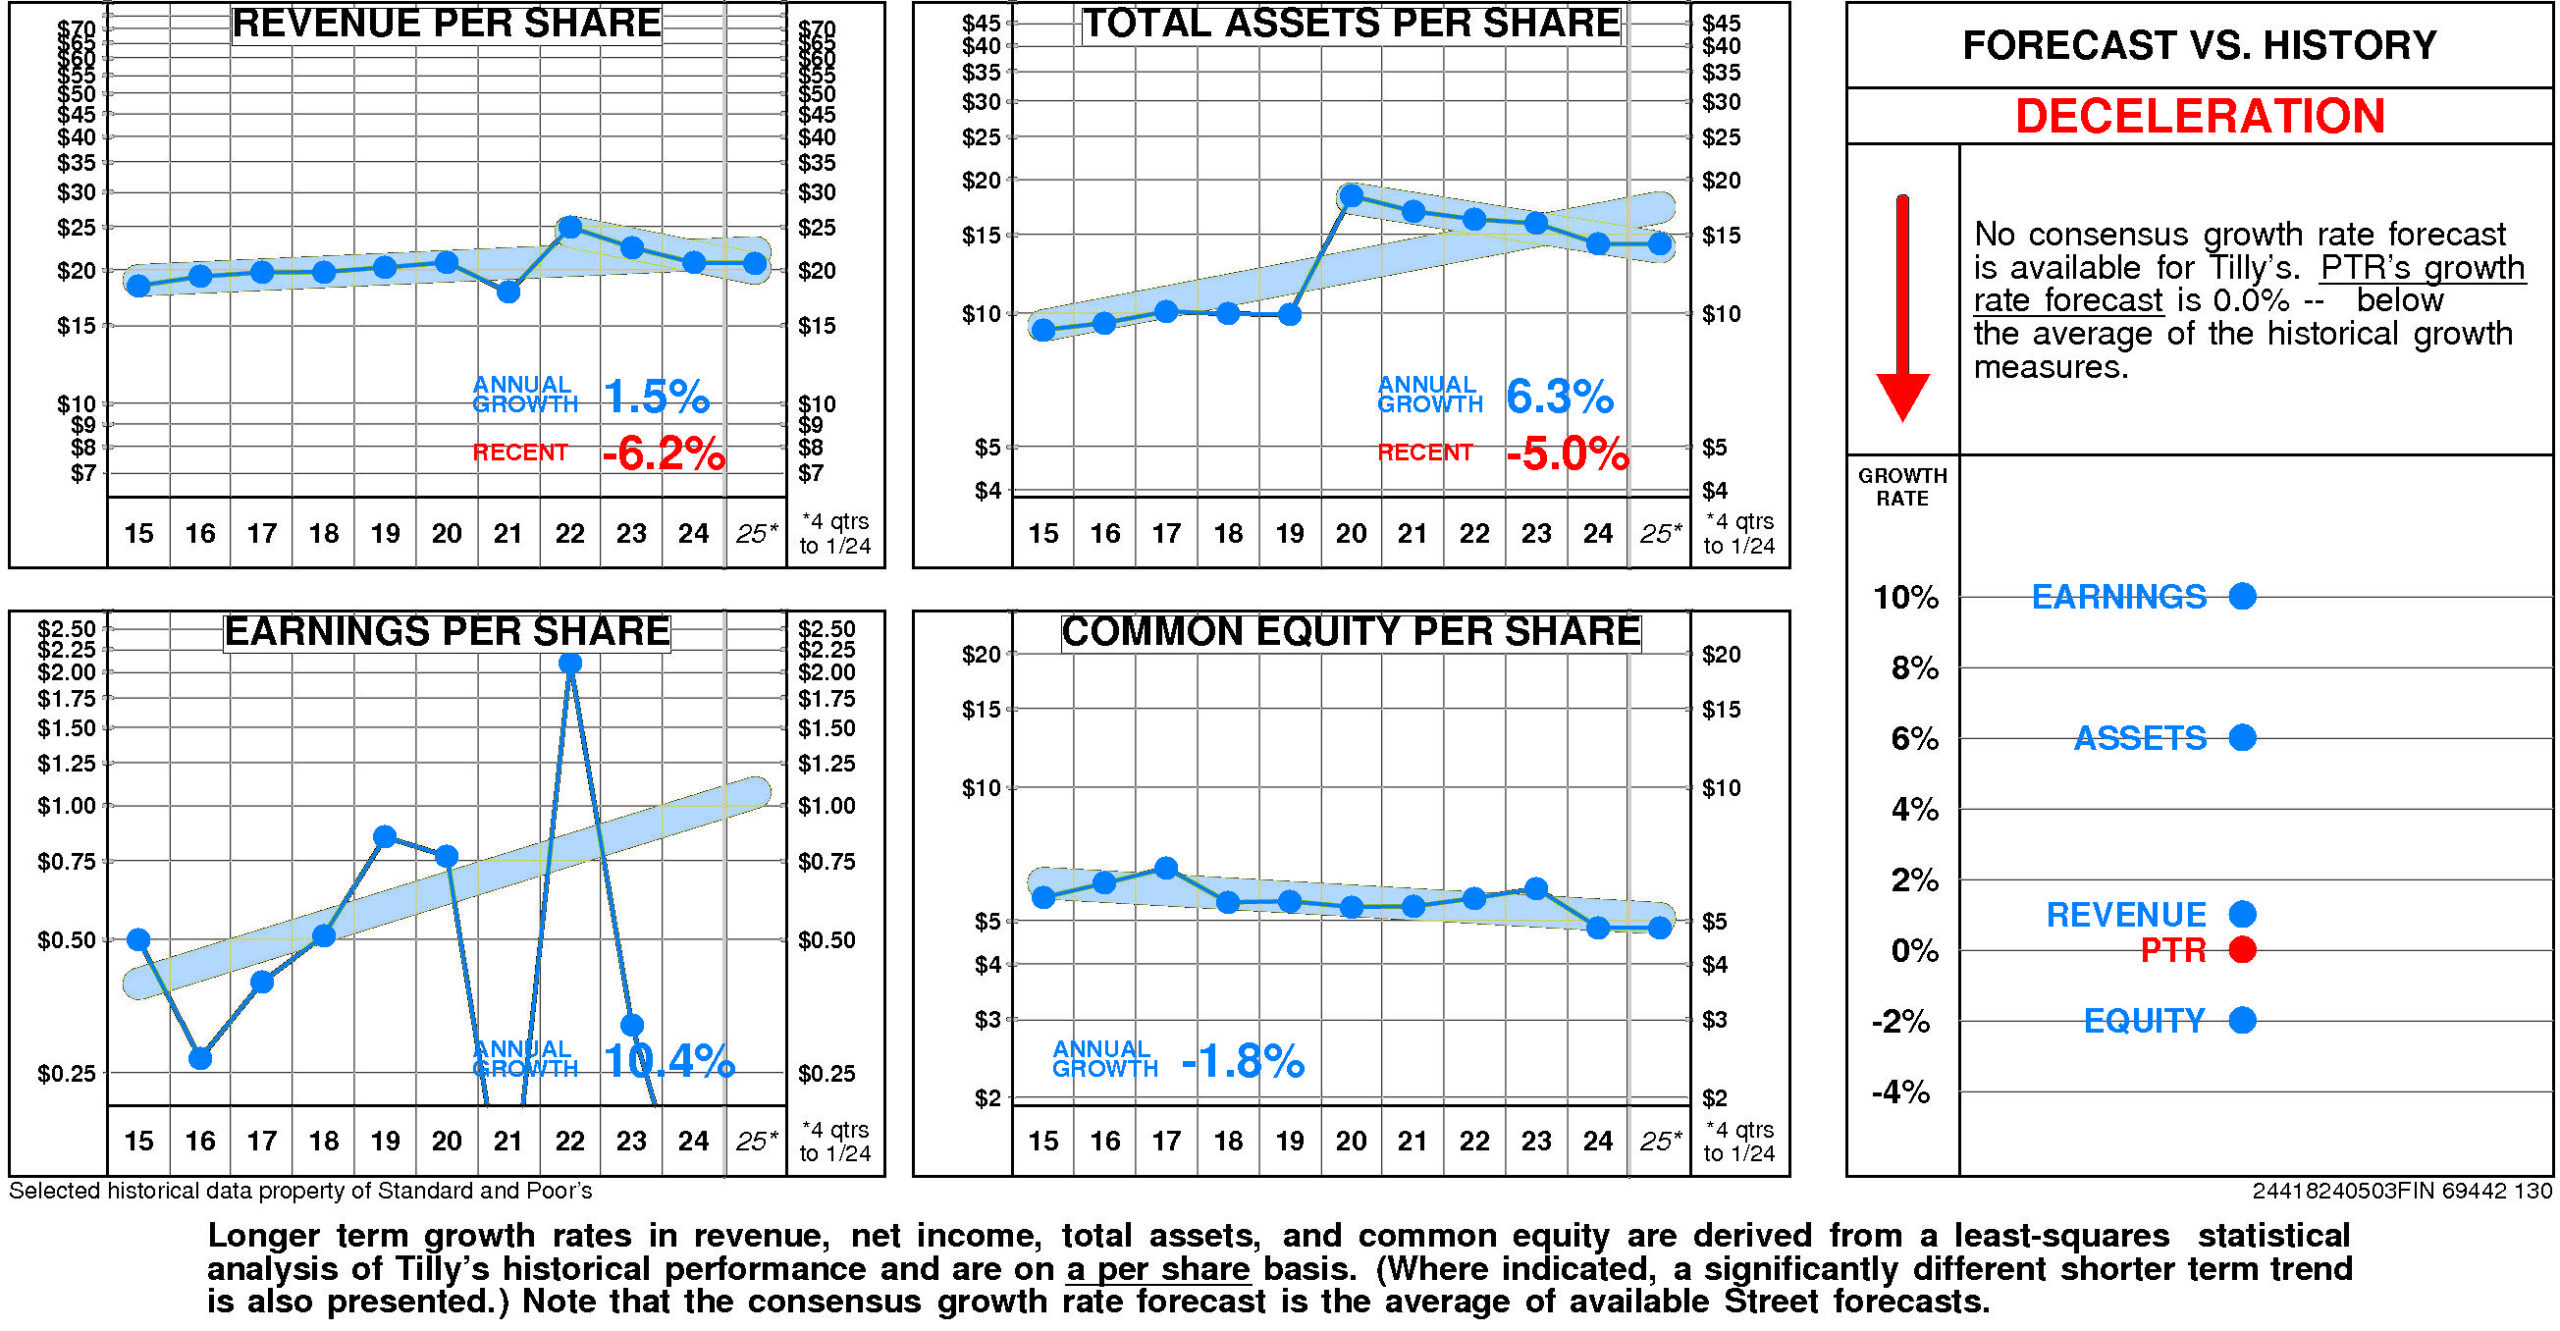
Overall, Tilly’s growth rate has slowed very considerably in recent years.
Tilly’s historical income statement growth and balance sheet growth have diverged. Revenue growth has paralleled asset growth; earnings growth has exceeded equity growth.
Annual revenue growth has been 1.5% per year. (More recently it has been -6.2%.)
Total asset growth has been 6.3% per year. (More recently it has been -5.0%.)
Annual E.P.S. growth has been 10.4% per year.
Equity growth has been -1.8% per year.
No consensus growth rate forecast is available for Tilly’s.
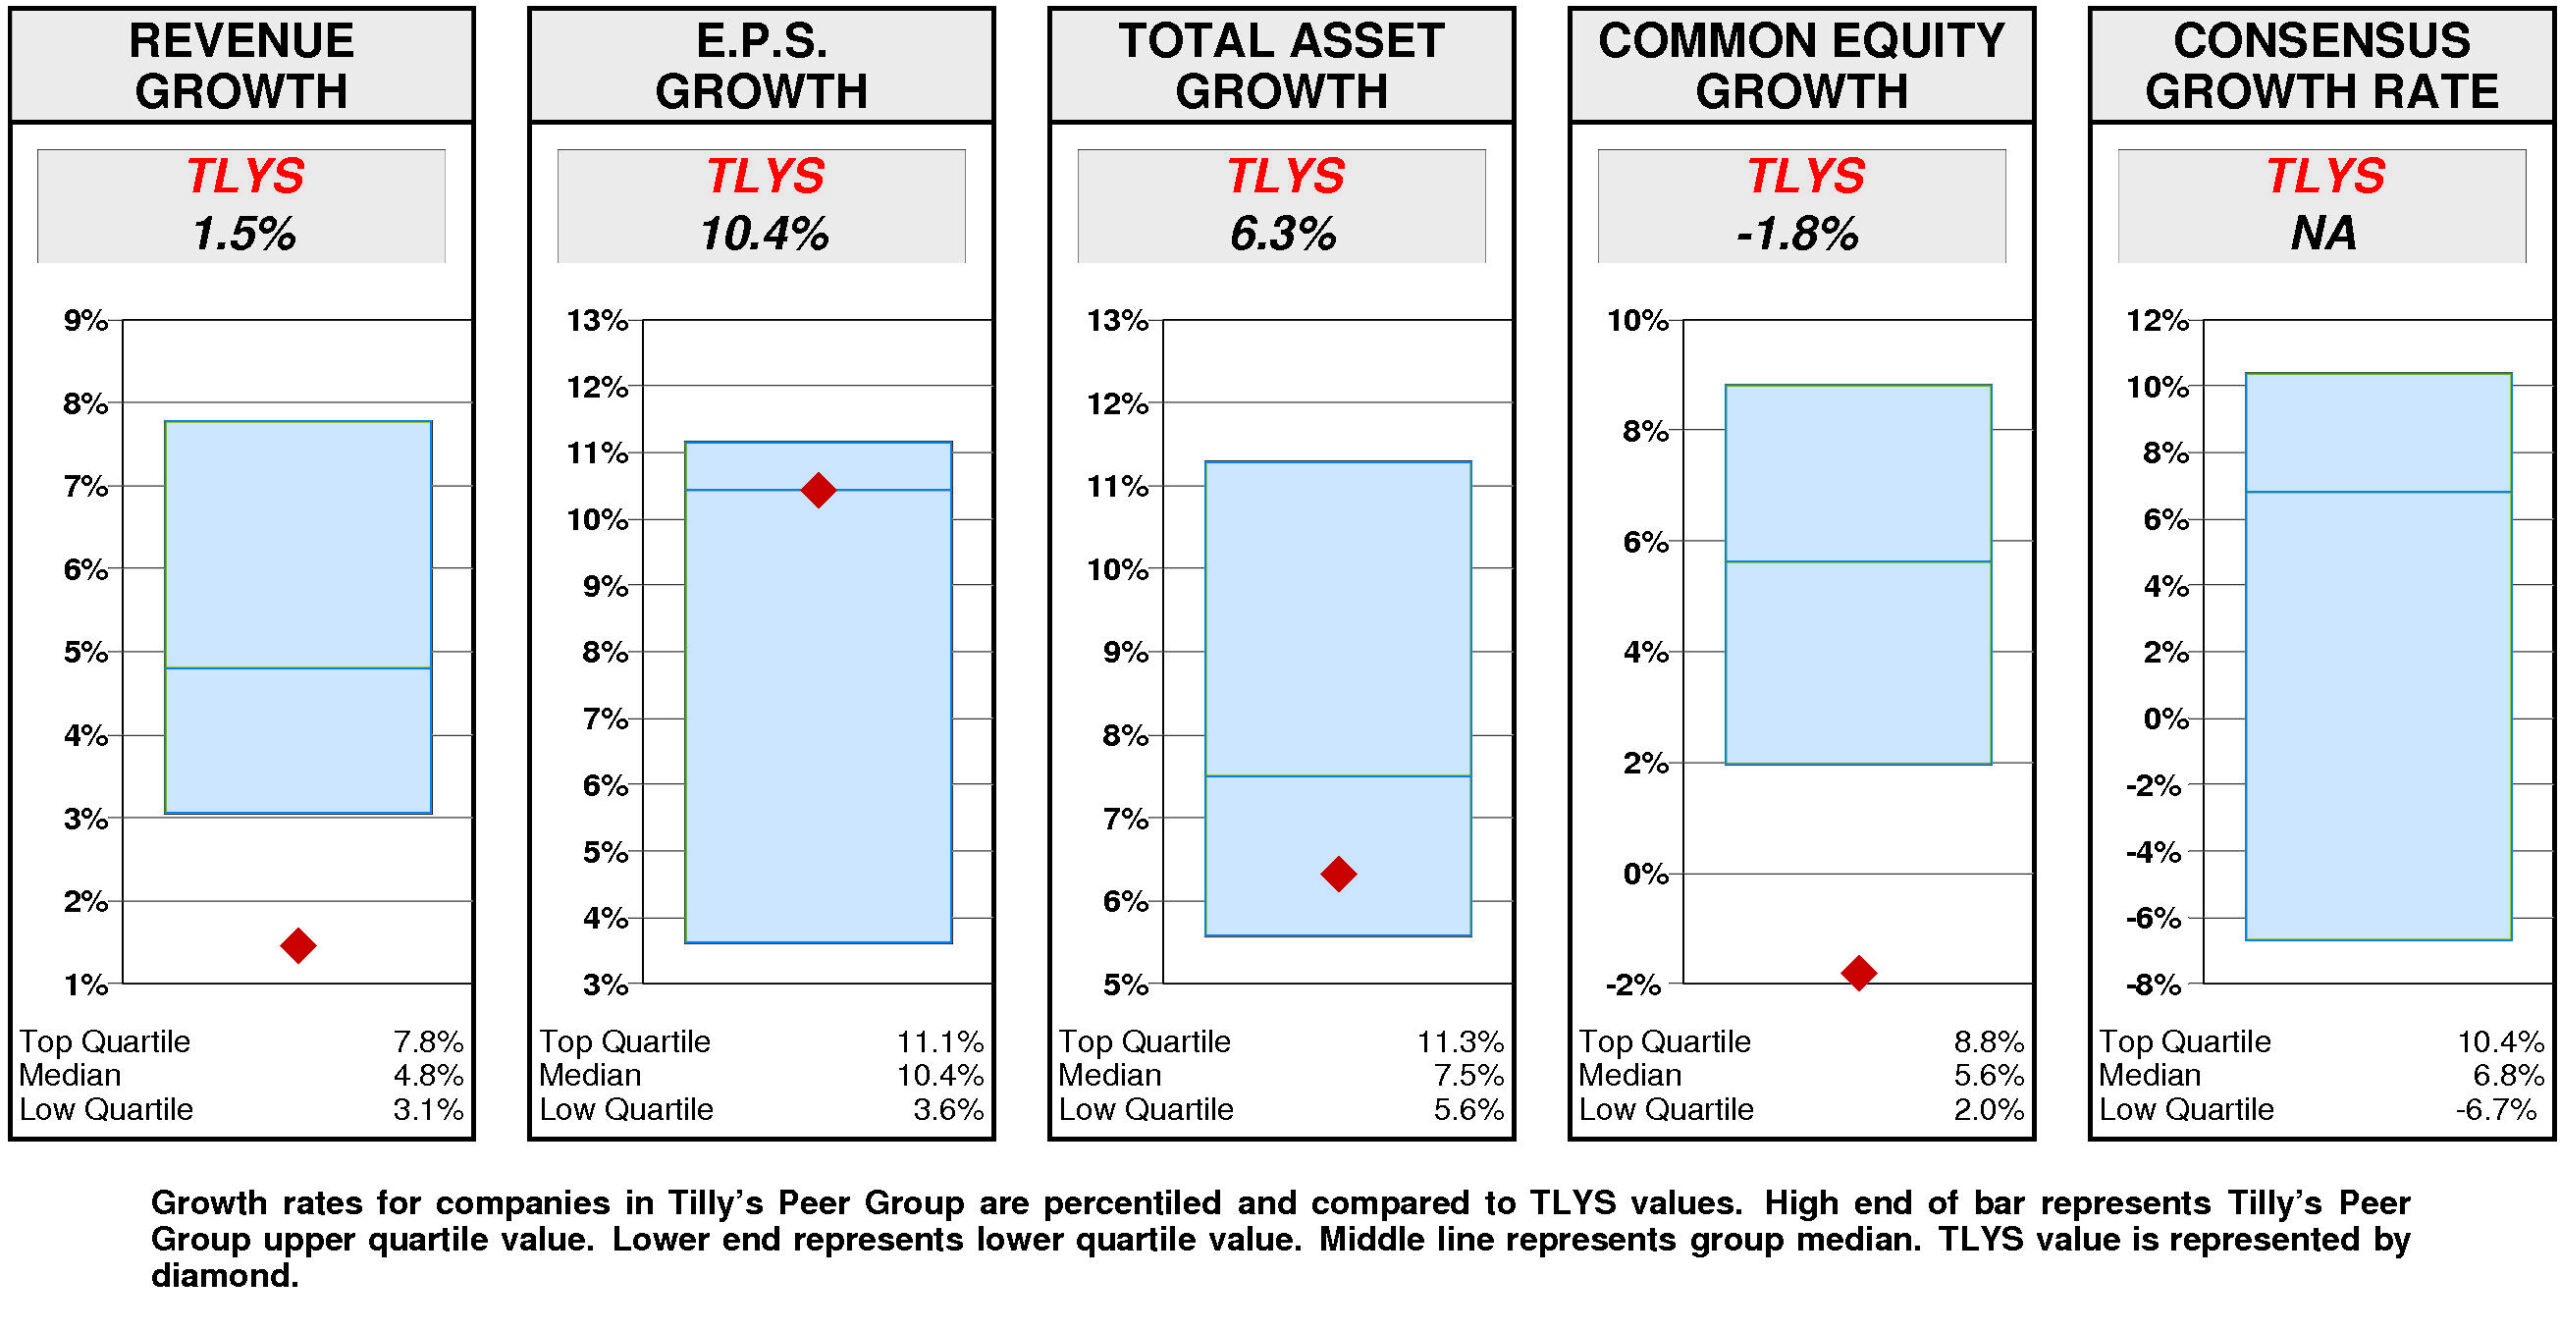
Relative to the Tilly’s Peer Group, Tilly’s historical growth measures are erratic. E.P.S. growth (10.4%) has been at median. Total asset growth (6.3%) has been below median. Revenue growth (1.5%) has been lower quartile. Equity growth (-1.8%) has been lower quartile.
Consensus growth forecast is unavailable.
PRICE HISTORY
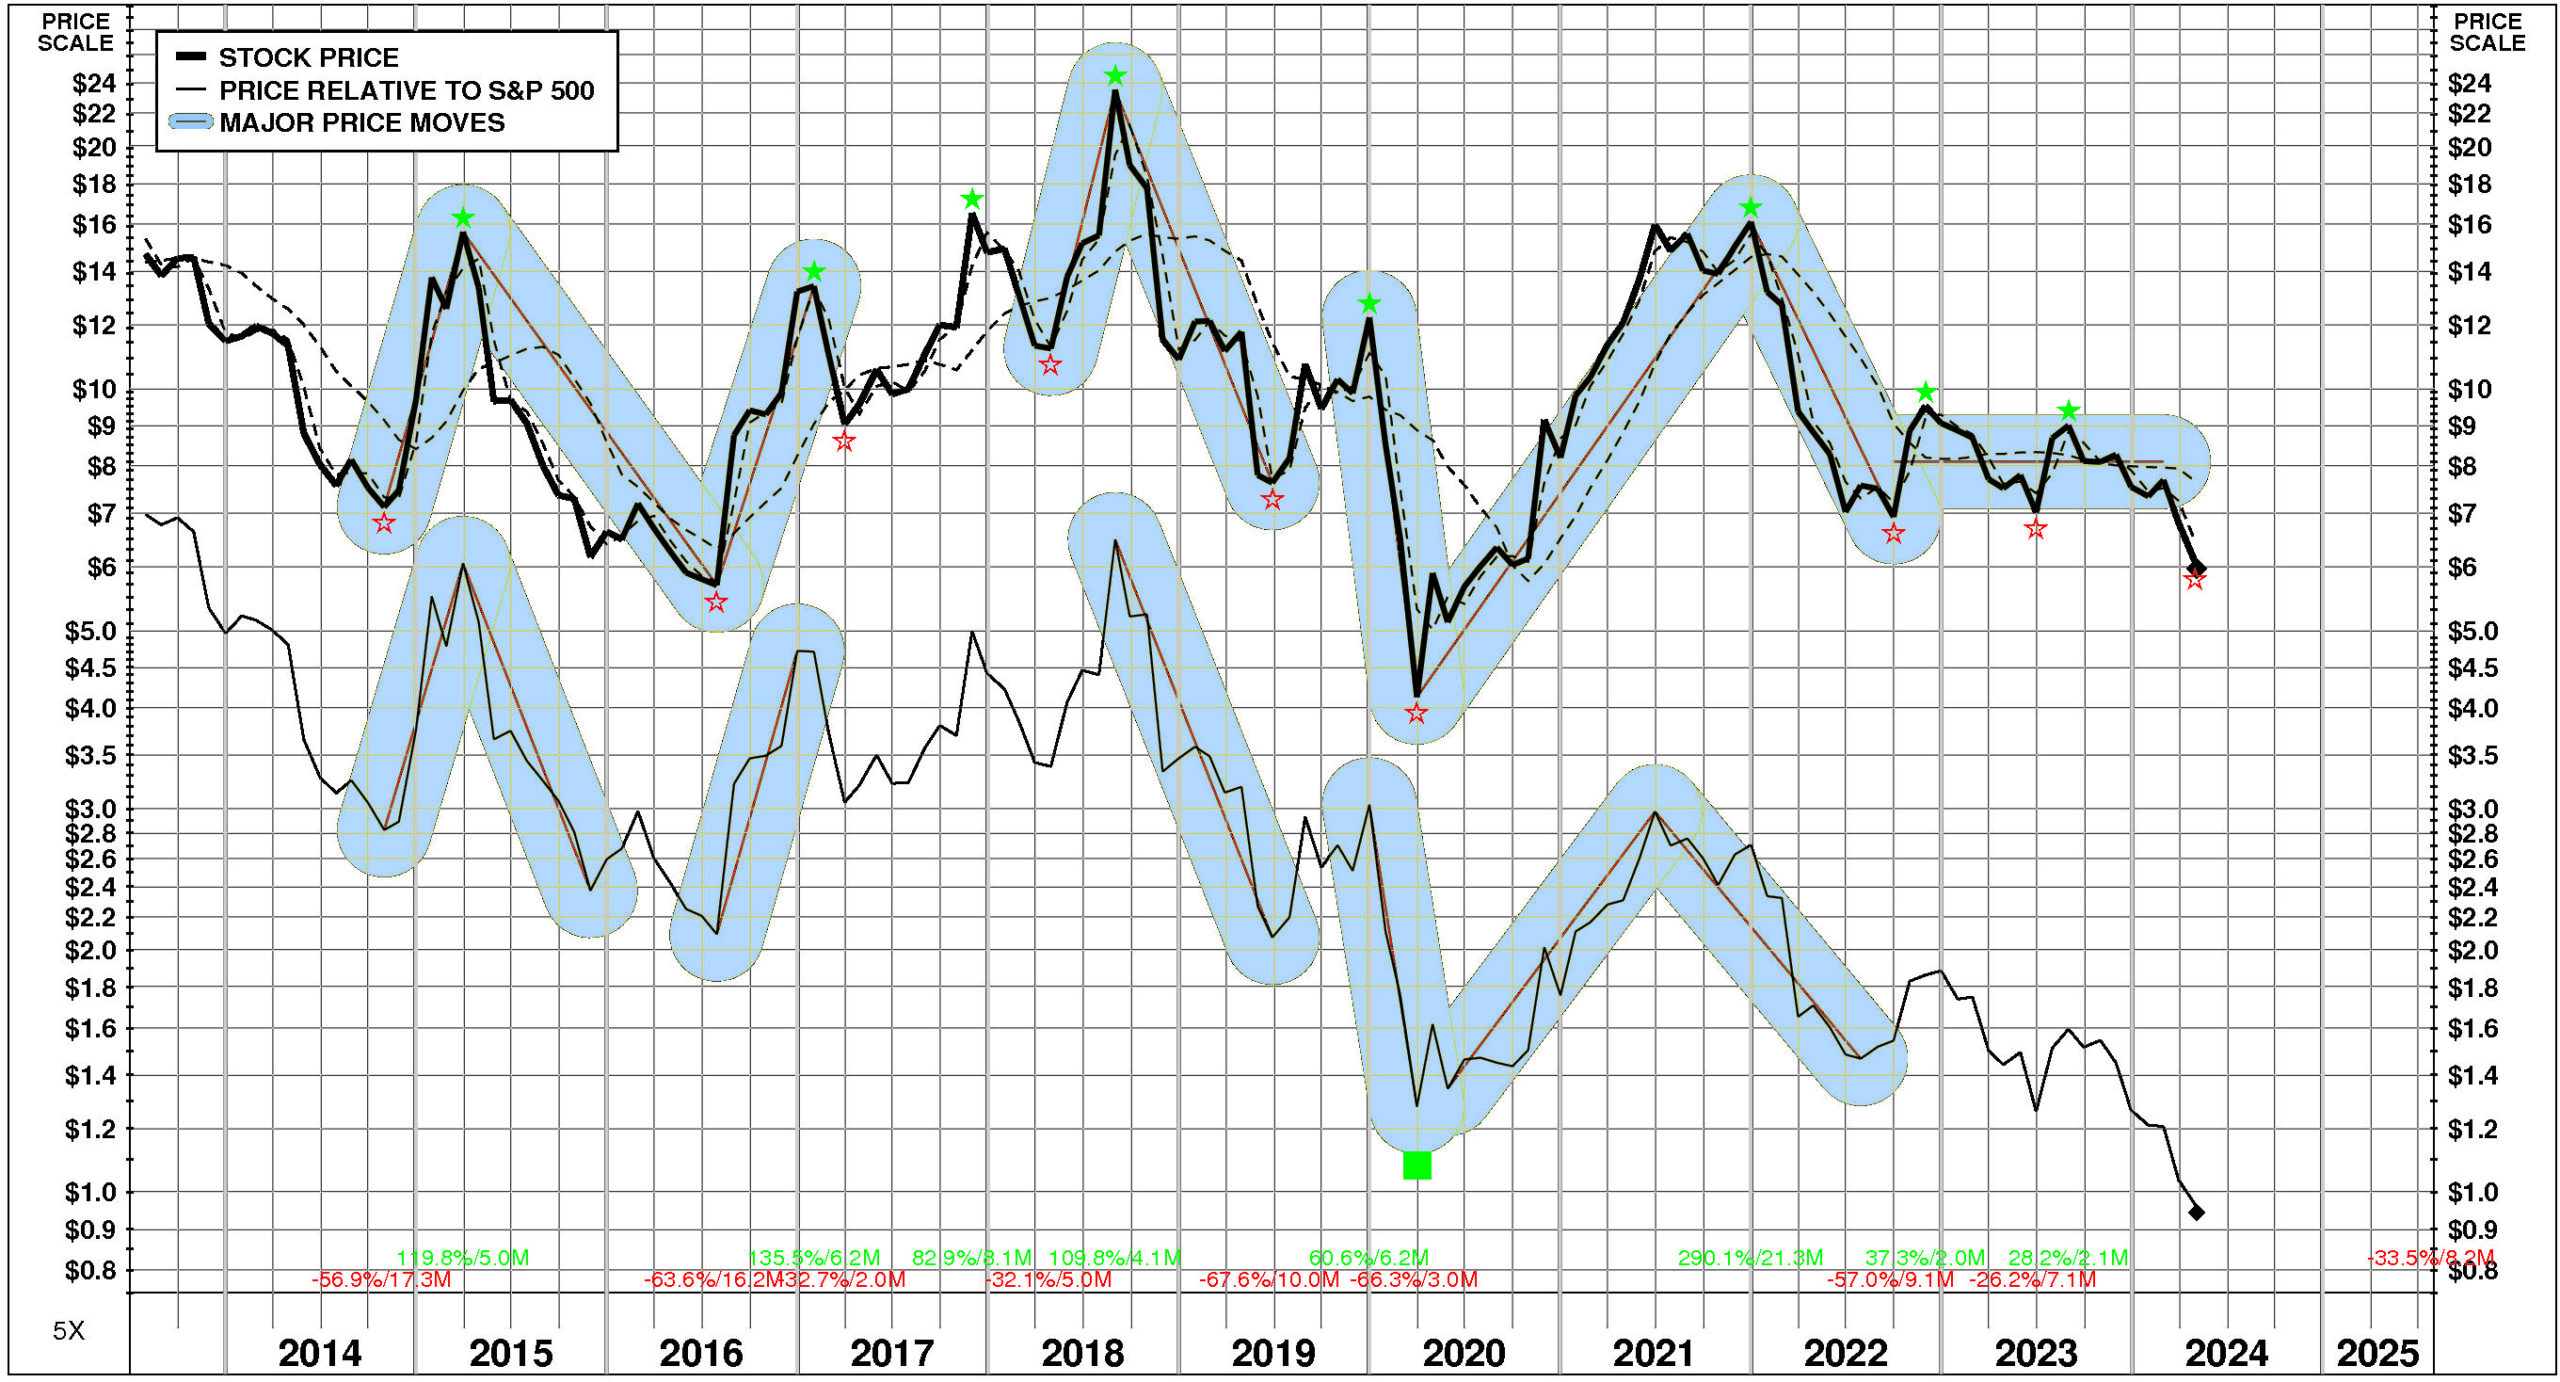
Over the full time period, Tilly’s stock price performance has been variable and significantly below market. Between July, 2013 and May, 2024, Tilly’s stock price fell -59%; relative to the market, this was a -86% loss. Significant price moves during the period: 1) December, 2021 – September, 2022: -57%; 2) March, 2020 – December, 2021: +290%; 3) December, 2019 – March, 2020: -66%; 4) August, 2018 – June, 2019: -68%; 5) April, 2018 – August, 2018: +110%; and 6) July, 2016 – January, 2017: +136%.
TOTAL INVESTMENT RETURNS
Current annual total return performance of -19.2% is lower quartile relative to the S&P 500 Composite.
In addition to being lower quartile relative to S&P 500 Composite, current annual total return performance through April, 2024 of -19.2% is lower quartile relative to Tilly’s Inc Peer Group.
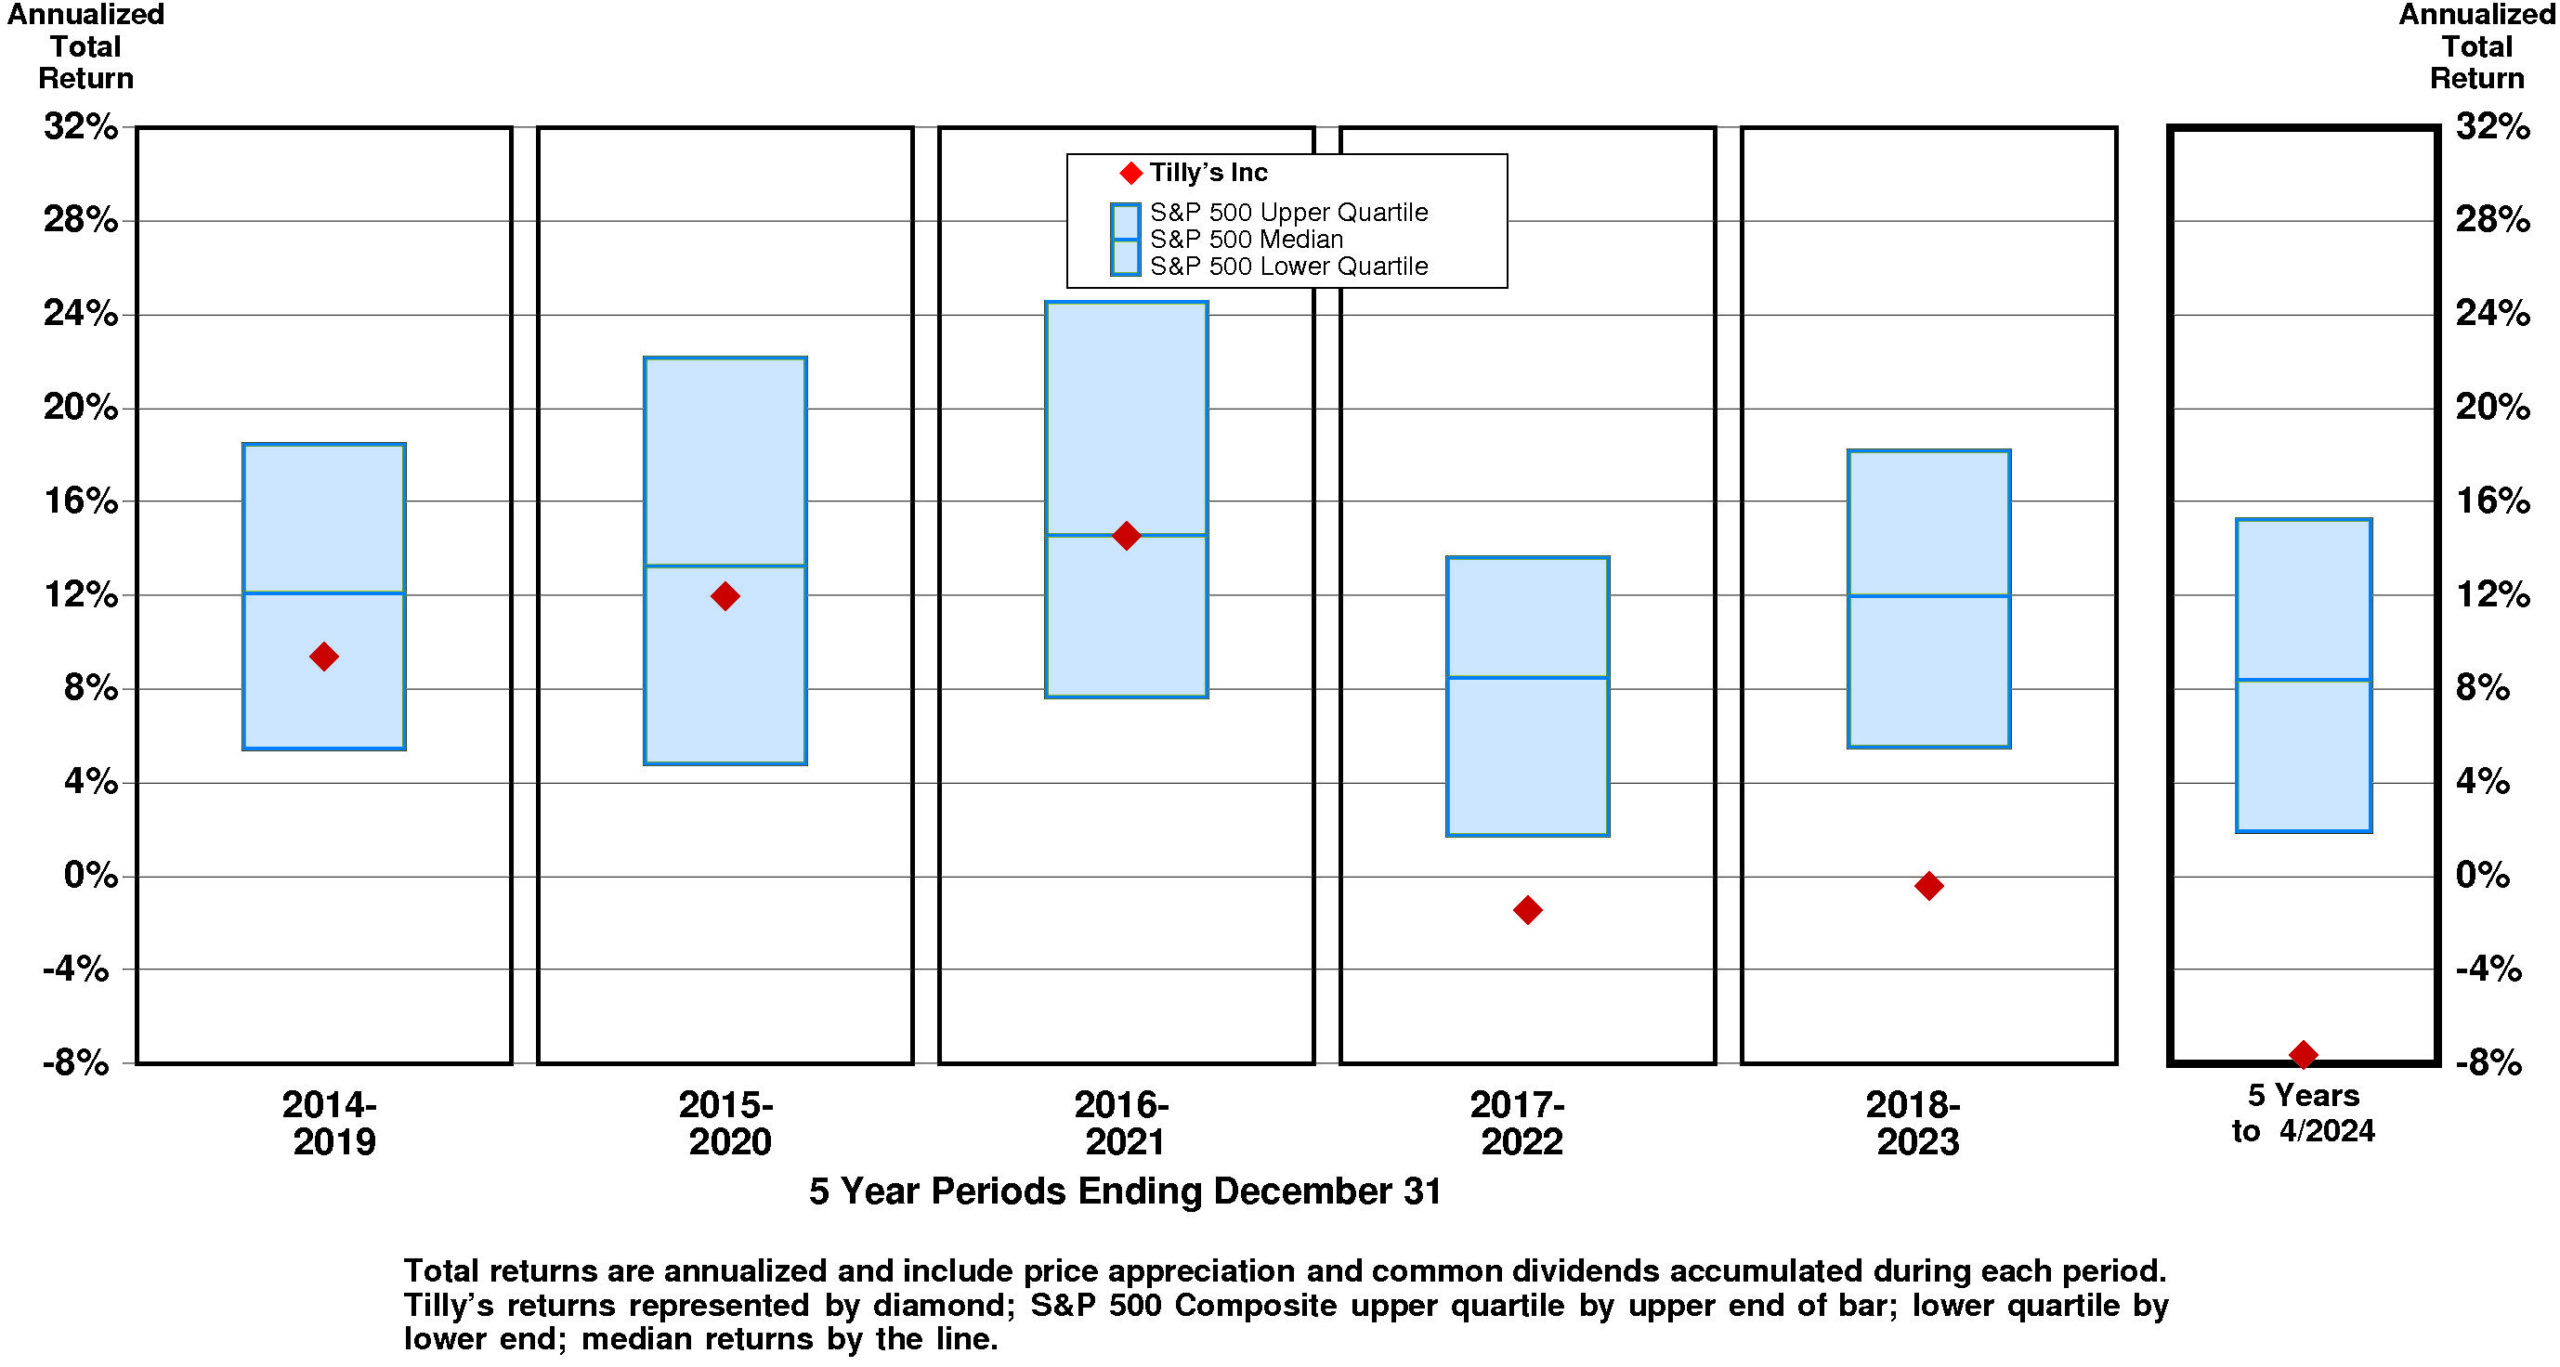
Current 5-year total return performance of -7.6% is lower quartile relative to the S&P 500 Composite.
Through April, 2024, with lower quartile current 5-year total return of -7.6% relative to S&P 500 Composite, Tilly’s total return performance is lower quartile relative to Tilly’s Inc Peer Group.
VALUATION BENCHMARKS
Relative to S&P 500 Composite, TLYS’ overall valuation is exceptionally low. Ratio of enterprise value/assets is lower quartile. Price/equity ratio is lower quartile. Ratio of enterprise value/revenue is lower quartile. Price/earnings ratio is unavailable. Ratio of enterprise value/earnings before interest and taxes is unavailable.
Relative to Tilly’s Peer Group, TLYS’ overall valuation is quite low. Ratio of enterprise value/revenue is near the lower quartile. Ratio of enterprise value/assets is near the lower quartile. Price/equity ratio is lower quartile. Price/earnings ratio is unavailable. Ratio of enterprise value/earnings before interest and taxes is unavailable.
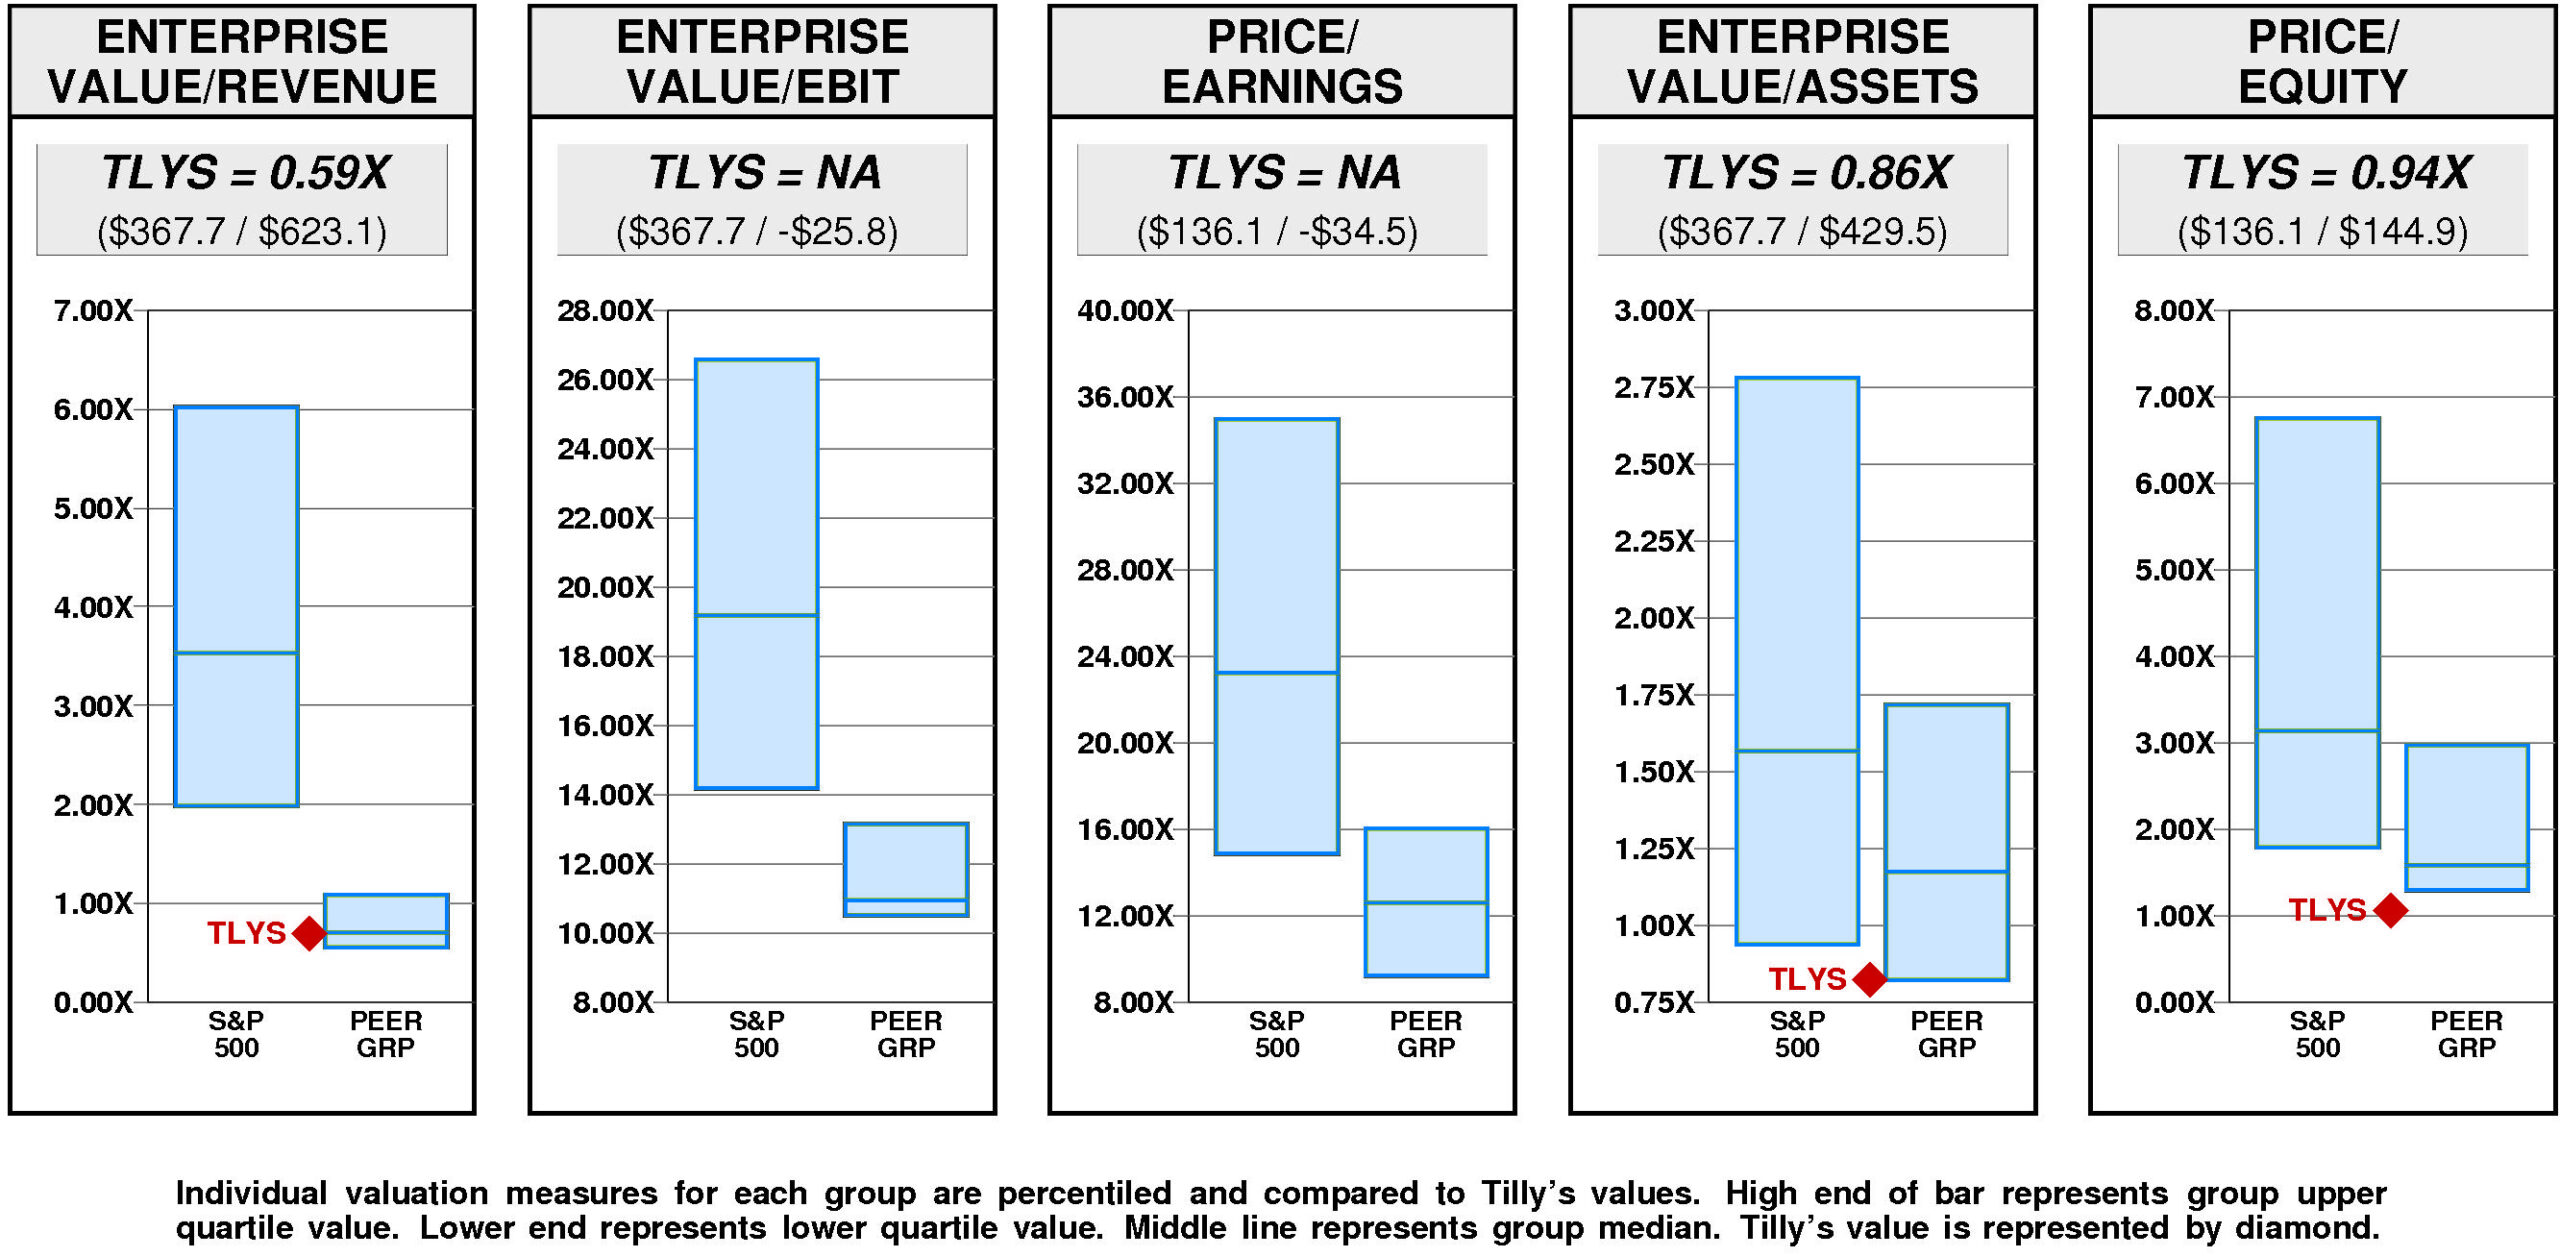
Tilly’s has a major value gap compared to the median valuation. For TLYS to rise to median valuation, its current ratio of enterprise value/revenue would have to rise from the current level of 0.59X to 0.70X. If TLYS’ ratio of enterprise value/revenue were to rise to 0.70X, its stock price would be lower by $3 to $9.
For TLYS to hit lower quartile valuation relative to the Tilly’s Peer Group, its current ratio of enterprise value/revenue would have to fall from the current level of 0.59X to 0.55X. If TLYS’ ratio of enterprise value/revenue were to fall to 0.55X, its stock price would decline by $-1 from the current level of $5.98.
VALUE TARGETS
TLYS is expected to be Value Creation neutral reflecting capital returns that are forecasted to be in line with the cost of capital.
Tilly’s current Price Target of $5 represents a -12% change from the current price of $5.98.
This low appreciation potential results in an appreciation score of 28 (72% of the universe has greater appreciation potential.)
Reinforcing this low Appreciation Score of 28, the low Power Rating of 2 contributes to an Value Trend Rating of F.
Tilly’s current Price Target is $5 (-48% from the 2024 Target of $10 and -12% from the 05/02/24 price of $5.98). This dramatic fall in the Target is the result of a -11% decrease in the equity base and a -42% decrease in the price/equity multiple. The forecasted decline in return on equity has a very large negative impact on the price/equity multiple and the forecasted decline in growth has a very large negative impact as well. Partially offsetting these Drivers, the forecasted decline in cost of equity has a huge positive impact.
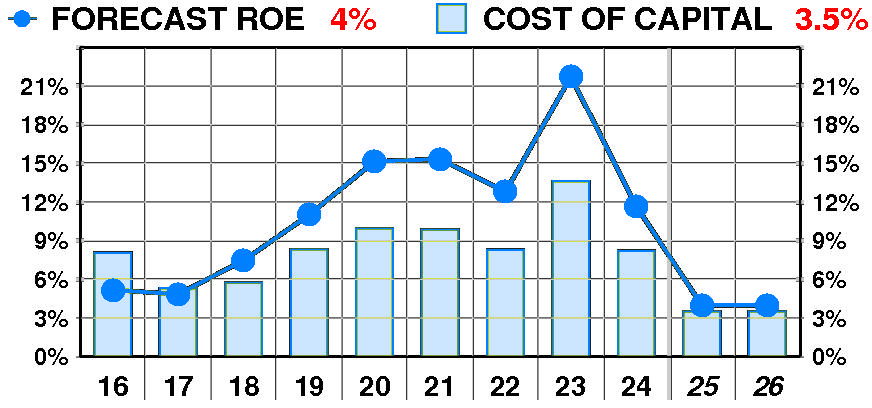
PTR’s return on equity forecast is 4.0% — below our recent forecasts. Forecasted return on equity enjoyed a dramatic, variable increase between 2016 and 2024. The current forecast is significantly below the 2023 peak of 22%.
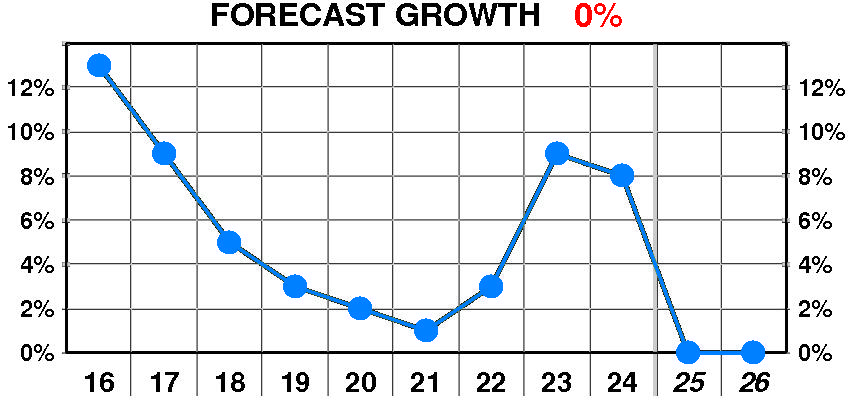
PTR’s growth forecast is 0.0% — below our recent forecasts. Forecasted growth suffered a dramatic, erratic decline between 2016 and 2024. The current forecast is significantly below the 2016 peak of 13%.
PTR’s cost of equity forecast is 3.5% — slightly below recent levels. Forecasted cost of equity suffered a dramatic, erratic increase between 2016 and 2024. The current forecast is significantly below the 2023 peak of 13.6%.
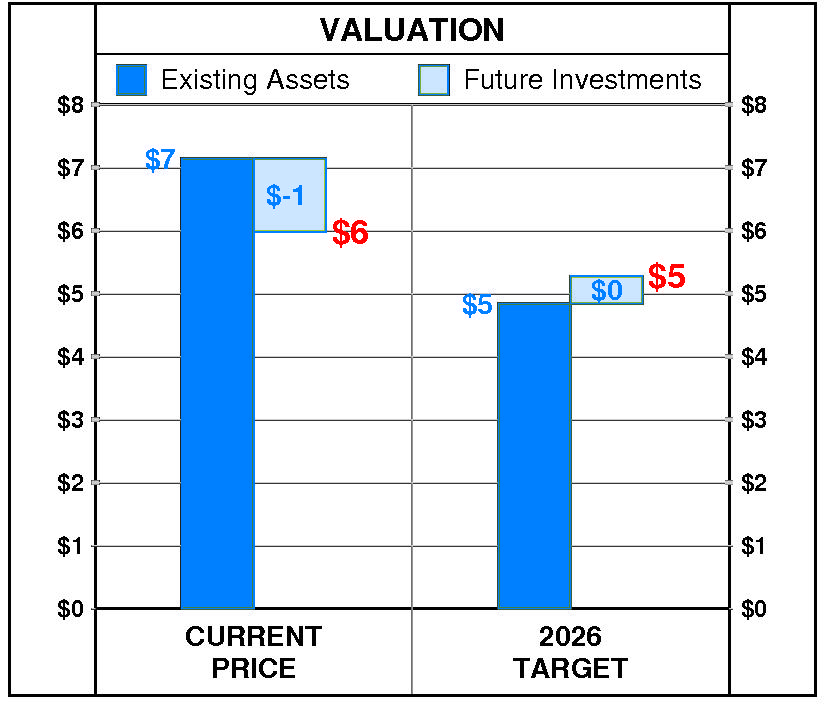
At Tilly’s current price of $5.98, investors are placing a negative value of $-1 on its future investments. This view is not supported by the company’s most recent performance that reflected a growth rate of 8.0% per year, and a return on equity of 11.7% versus a cost of equity of 8.2%.
PTR’s 2026 Price Target of $5 is based on these forecasts and reflects an estimated value of existing assets of $5 and a value of future investments of $0.
Be the first to comment