![]()
BUSINESS
Andrew Peller Limited engages in the production, bottling, and marketing of wines and craft beverage alcohol products in Canada. The company offers products under Peller Estates, Trius, Thirty Bench, Wayne Gretzky, Sandhill, Red Rooster, Black Hills Estate Winery, Tinhorn Creek Vineyards, Gray Monk Estate Winery, Raven Conspiracy, and Conviction brands; Peller Family Vineyards, Copper Moon, Black Cellar, and XOXO brands; and Hochtaler, Domaine D’Or, Schloss Laderheim, Royal, and Sommet brands. It also produces craft beverage alcohol products, including No Boats on Sunday ciders and seltzers, beer, spirits, and cream whisky products under the Wayne Gretzky No. 99 brand.
INVESTMENT RATING
With future capital returns forecasted to be in line with the cost of capital, ADW.A is expected to be Value Creation neutral.
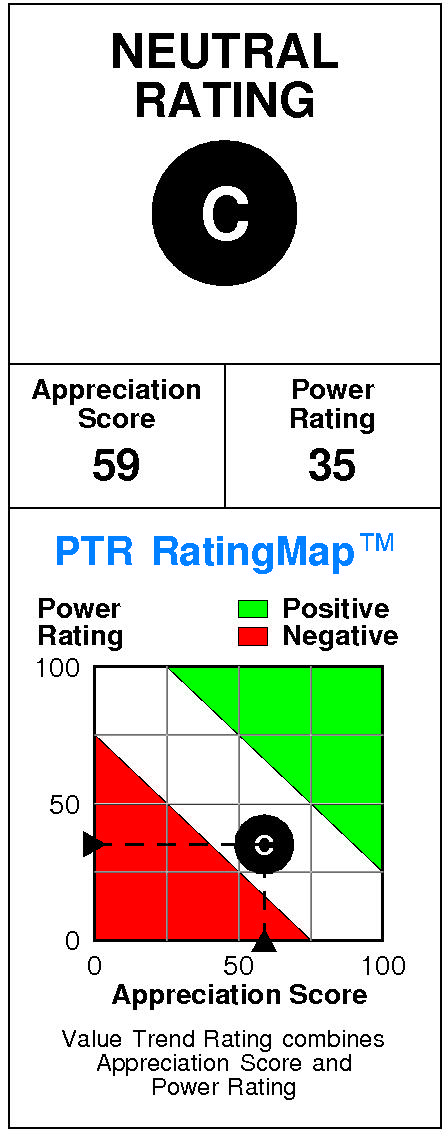
Andrew Peller has a current Value Trend Rating of C (Low Neutral).
The Value Trend Rating reflects consistent signals from PTR’s two proprietary measures of a stock’s attractiveness. Andrew Peller has a neutral Appreciation Score of 59 and a slightly negative Power Rating of 35, resulting in the Low Neutral Value Trend Rating.
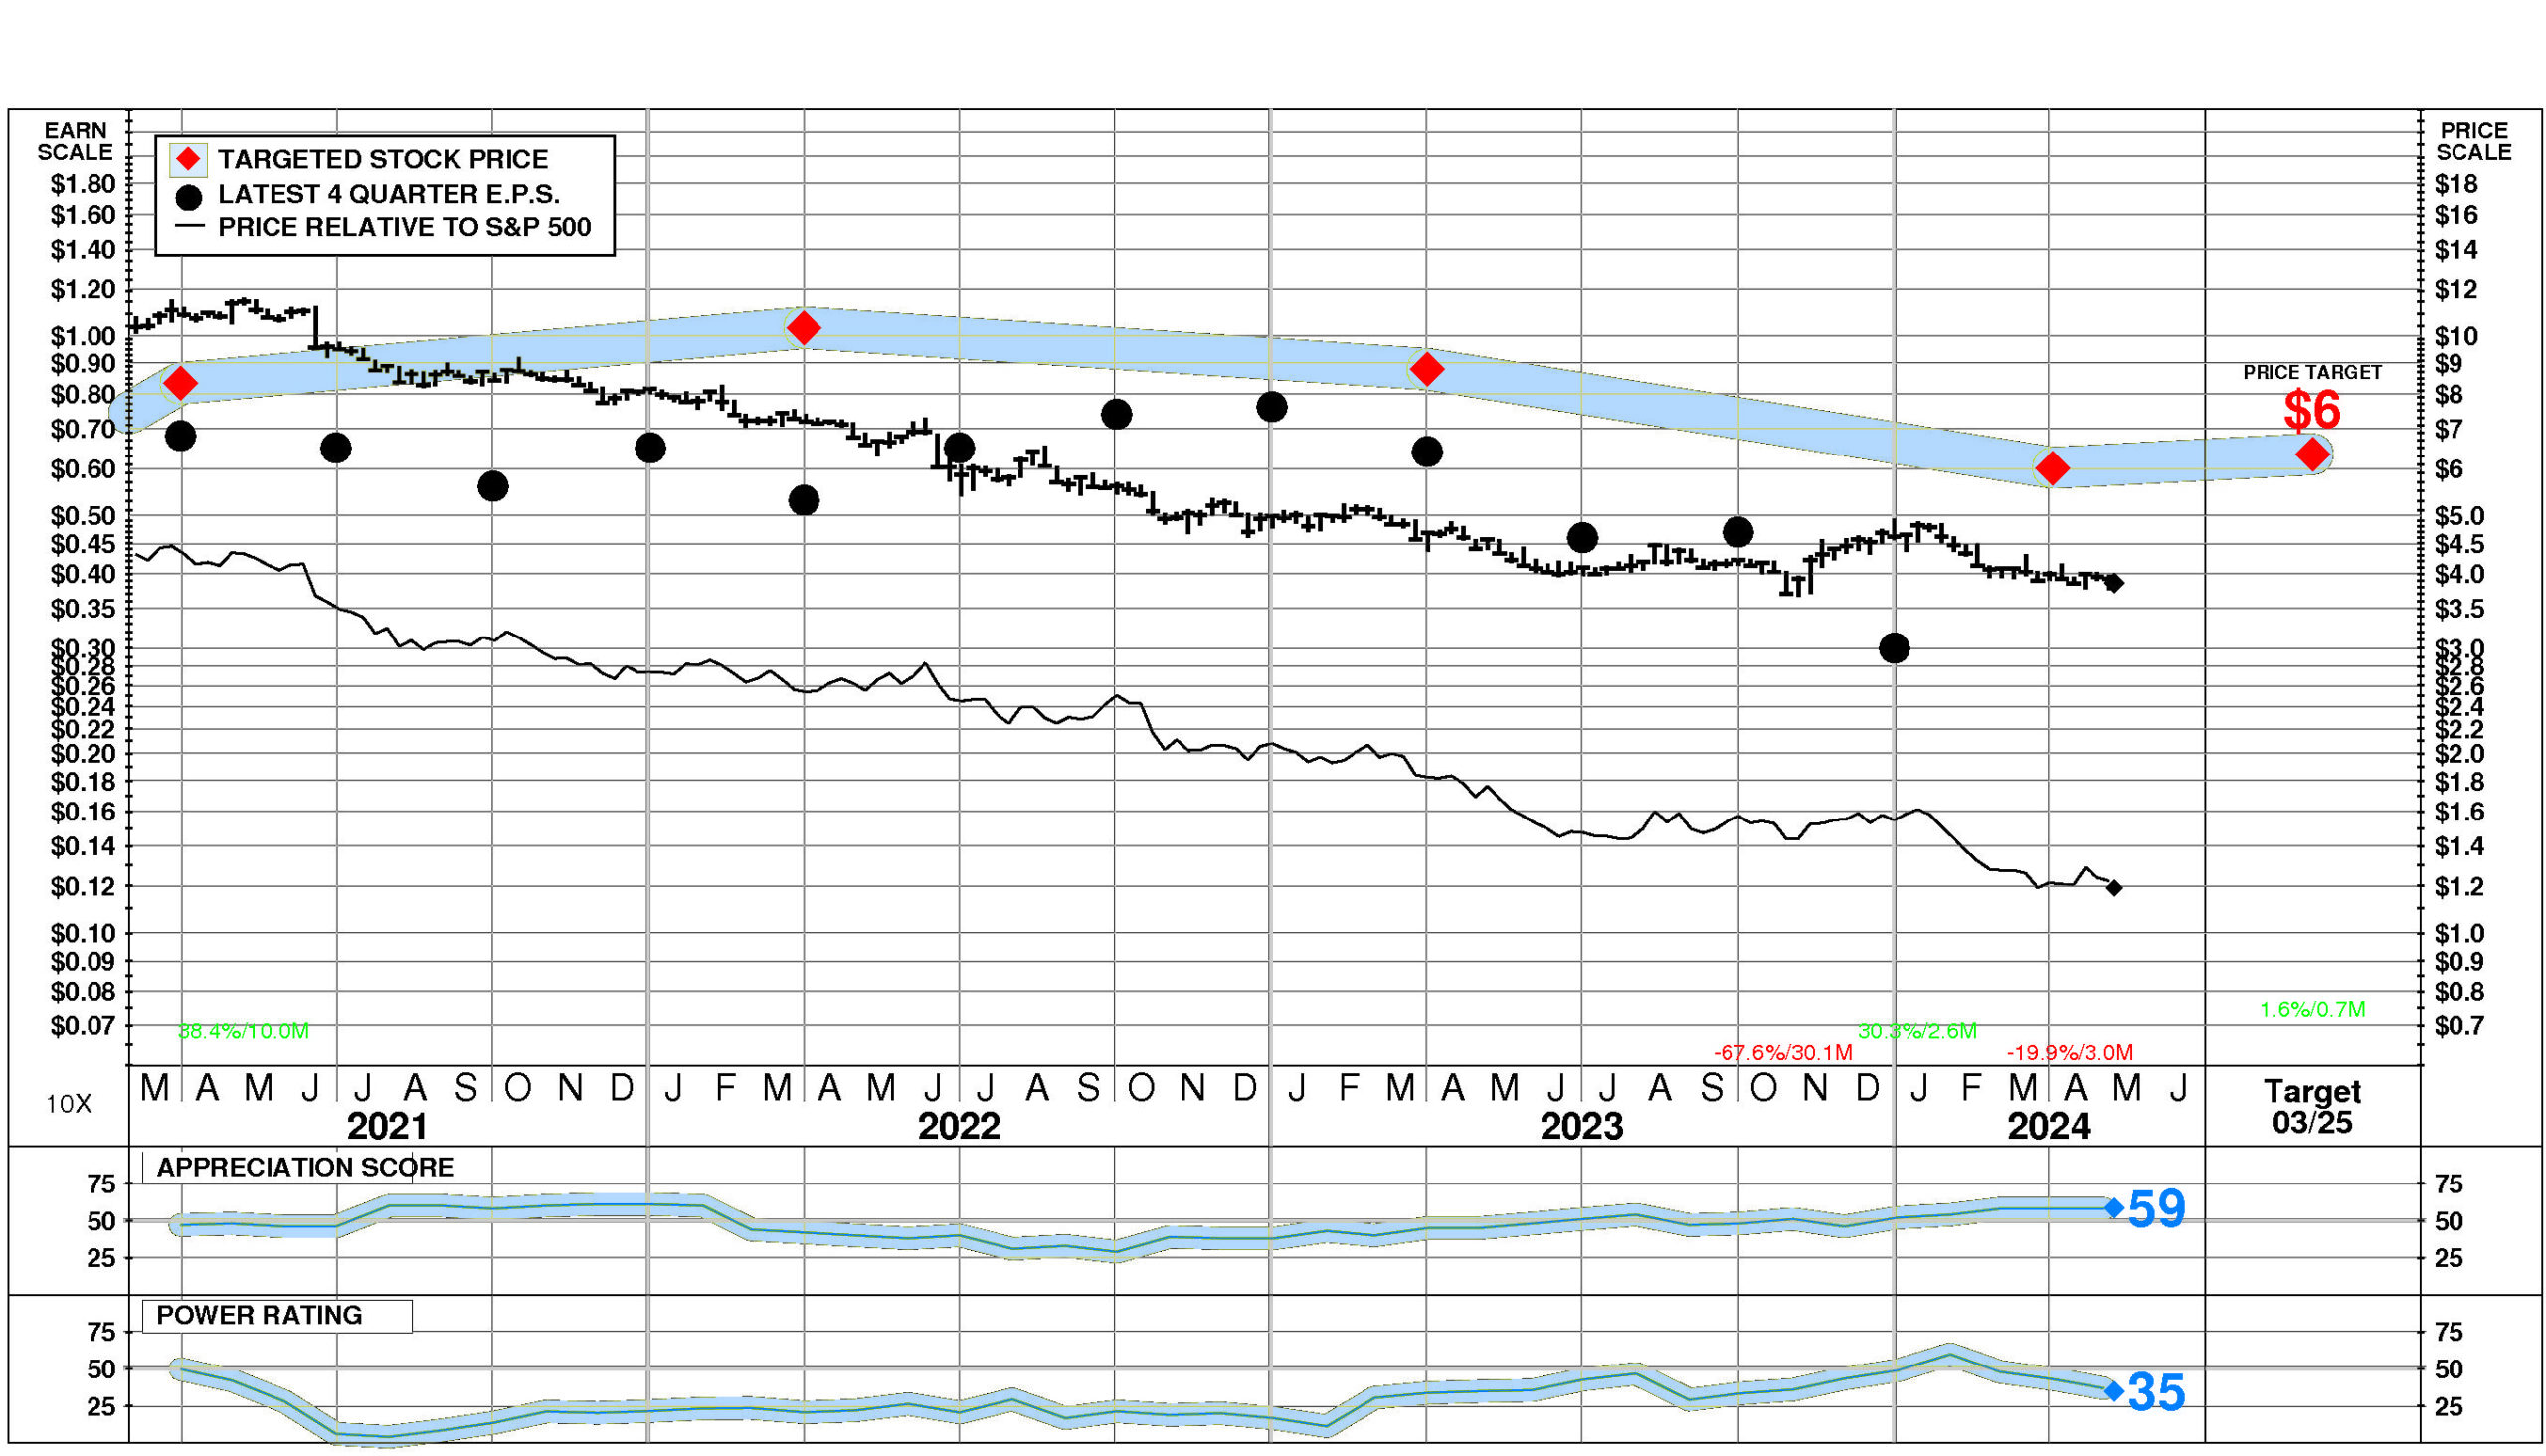
Andrew Peller’s stock is selling well below targeted value. The current stock price of $3.86 compares to targeted value 12 months forward of $6.
This neutral appreciation potential results in an appreciation score of 59 (41% of the universe has greater appreciation potential.)
Andrew Peller has a Power Rating of 35. (This slightly negative Power Rating indicates that ADW.A’s chances of enjoying attractive investment performance over the near to intermediate term are only average.)
Factors contributing to this slightly negative Power Rating include: recent price action has been slightly unfavorable; the Prepackaged Software comparison group is in a slightly weakened position currently; and earnings estimate behavior for ADW.A has been slightly negative recently.
INVESTMENT PROFILE
ADW.A’s financial strength is poor. Financial strength rating is 6.
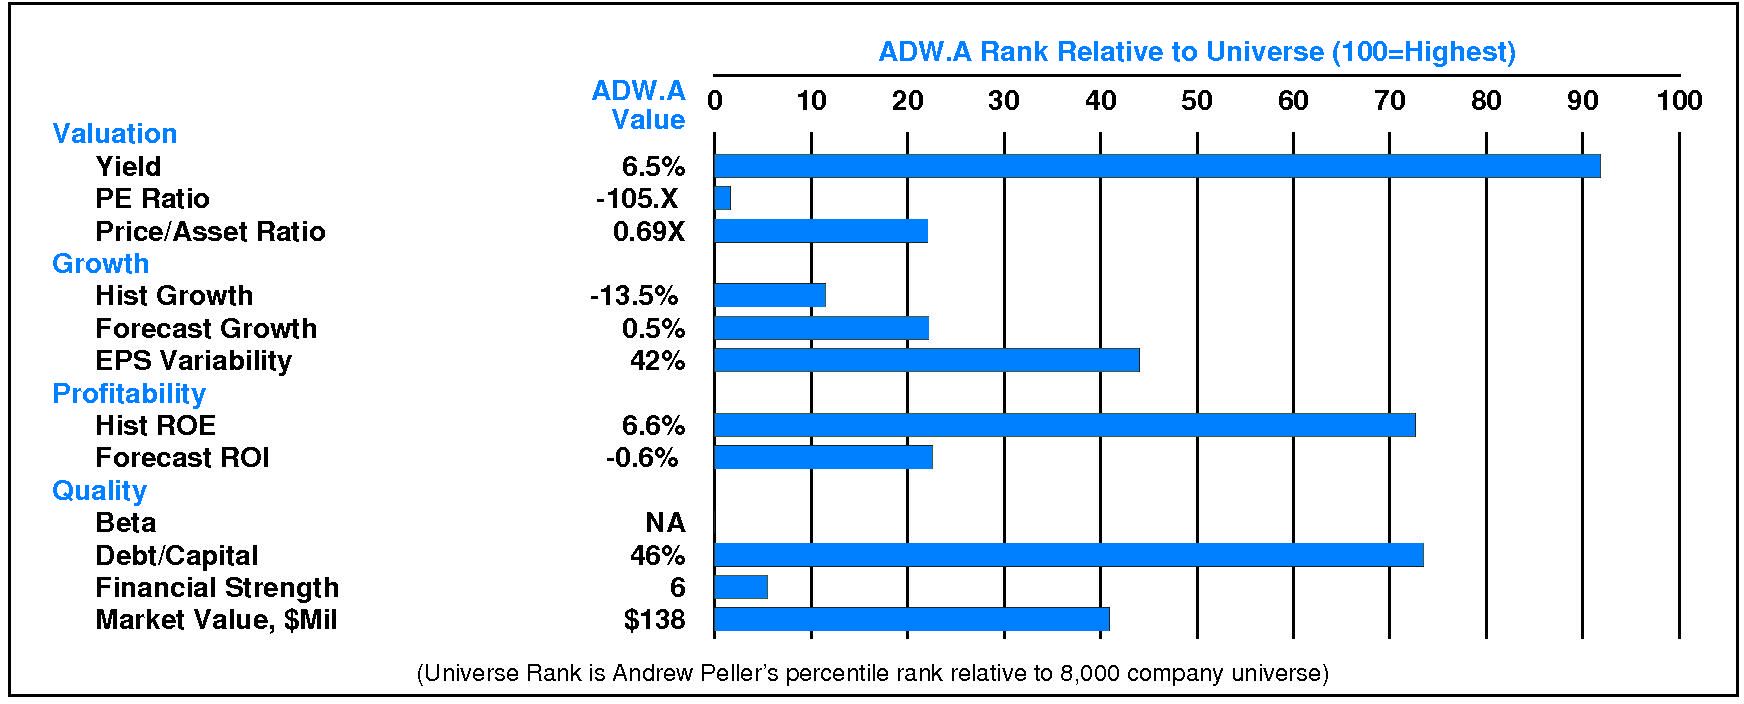
Relative to the S&P 500 Composite, Andrew Peller Ltd has significant Value characteristics; its appeal is likely to be to investors heavily oriented toward Income; the perception is that ADW.A is higher risk. All factors are relative weaknesses. Relative weaknesses for ADW.A include: low historical profitability, low financial strength, low expected growth, and low historical growth. ADW.A’s valuation is low: high dividend yield, moderate P/E ratio, and low price/book ratio. ADW.A has unusually low market capitalization.
CURRENT SIGNALS
Andrew Peller’s current operations are eroding. Return on equity is falling, reflecting: declining pretax margin; and falling leverage.
Andrew Peller’s current technical position is very weak. The stock price is in a 3.0 month down move. The stock has declined 16.6% from its prior high. The stock price is below its 200 day moving average which is in a downtrend.
ALERTS
Important changes in Andrew Peller’s investment behavior have recently occurred: positive upside/downside volume.
CASH FLOW
In 2023, Andrew Peller experienced a very significant reduction in cash of -$1.30 million (-100%). Sources of cash were much lower than uses. Cash generated from 2023 EBITDA totaled +$38.01 million. Non-operating uses consumed -$3.17 million (-8% of EBITDA). Cash taxes contributed +$2.16 million (+6% of EBITDA). Re-investment in the business amounted to -$32.75 million (-86% of EBITDA). On a net basis, debt investors supplied +$2.87 million (+8% of EBITDA) while equity investors pulled out -$8.41 million (-22% of EBITDA).
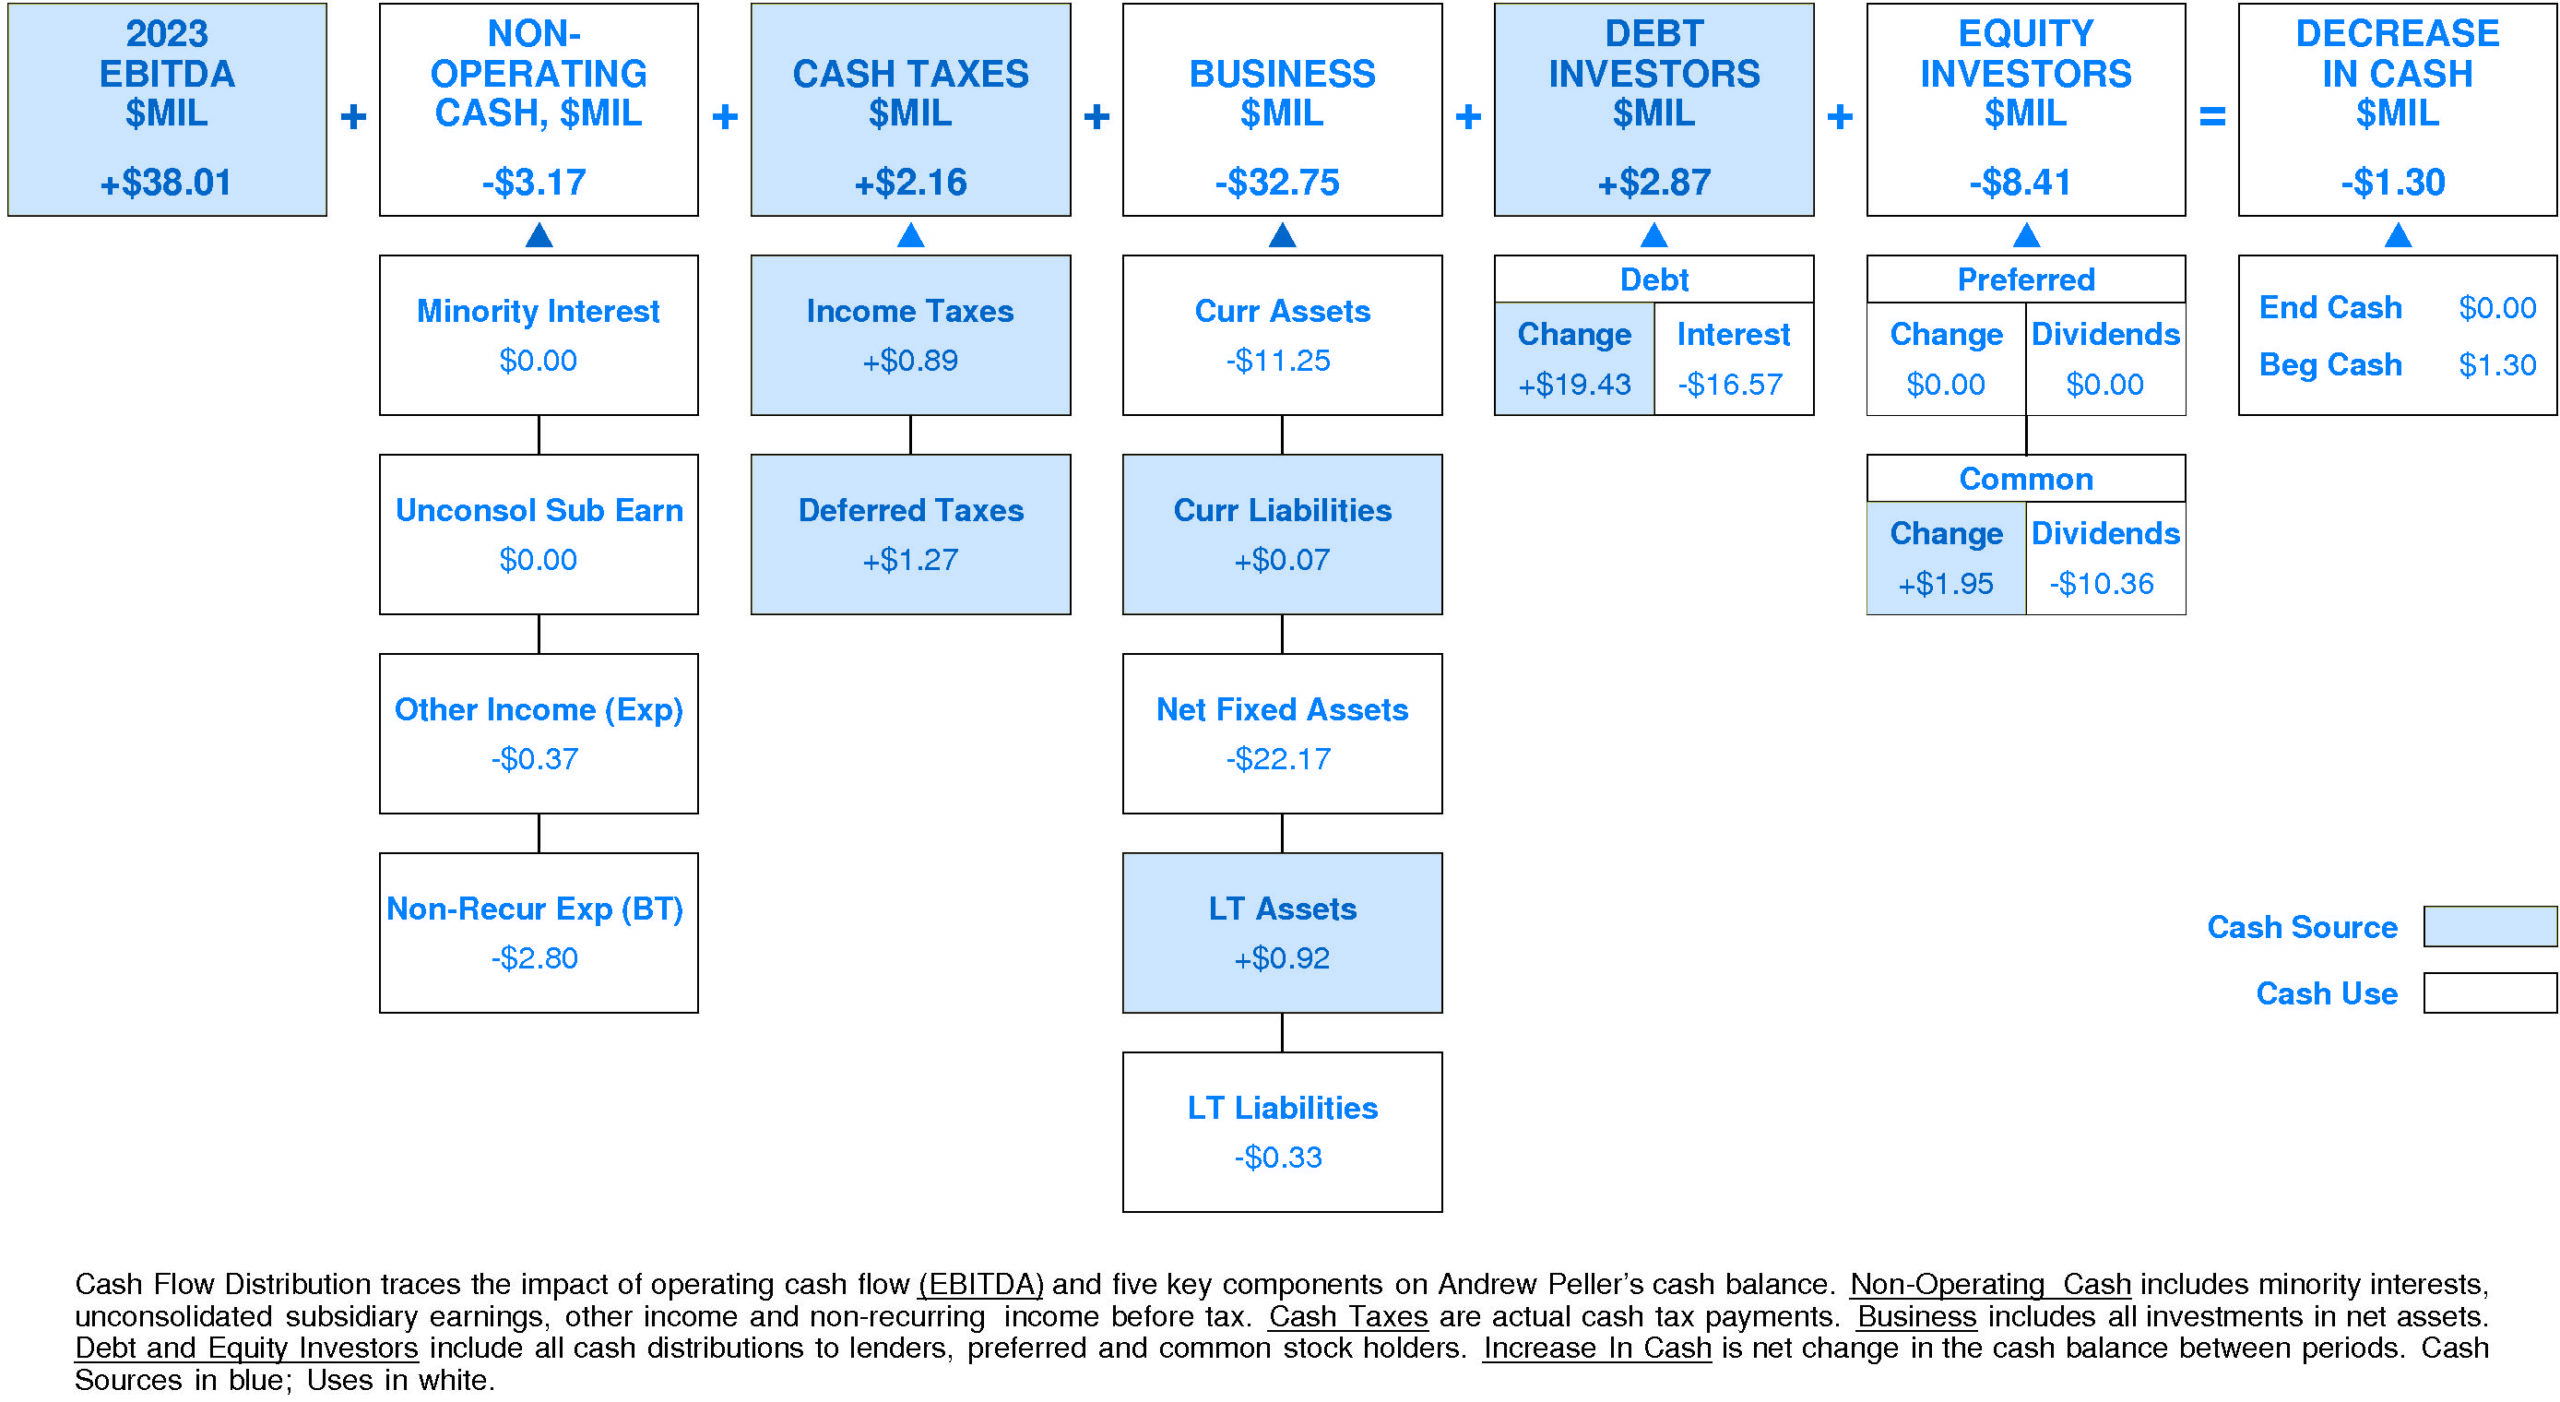
Andrew Peller’s Non-operating Income, %EBITDA has exhibited a volatile overall uptrend over the period. This improvement was accompanied by stability for the Andrew Peller Peer Group. In most years, Andrew Peller was in the third quartile and top quartile. Currently, Andrew Peller is substantially below median at -8% of EBITDA (-$3.17 million).
Andrew Peller’s Cash Taxes, %EBITDA has exhibited a minor overall uptrend over the period. This improvement was accompanied by a similar trend for the Andrew Peller Peer Group. In most years, Andrew Peller was in the top quartile and third quartile. Currently, Andrew Peller is upper quartile at +6% of EBITDA (+$2.16 million).
Andrew Peller’s Business Re-investment, %EBITDA has suffered a volatile overall downtrend over the period. This downtrend was accompanied by a similar trend for the Andrew Peller Peer Group. In most years, Andrew Peller was in the third quartile and second quartile. Currently, Andrew Peller is substantially below median at -86% of EBITDA (-$32.75 million).
Andrew Peller’s Debt Investors, %EBITDA has experienced a volatile overall uptrend over the period. This improvement was accompanied by stability for the Andrew Peller Peer Group. In most years, Andrew Peller was in the top quartile and lower quartile. Currently, Andrew Peller is upper quartile at +8% of EBITDA (+$2.87 million).
Andrew Peller’s Equity Investors, %EBITDA has experienced a downtrend over the period. This downtrend was accompanied by a similar trend for the Andrew Peller Peer Group. In most years, Andrew Peller was in the third quartile and second quartile. Currently, Andrew Peller is slightly below median at -22% of EBITDA (-$8.41 million).
Andrew Peller’s Change in Cash, %EBITDA has exhibited little to no overall change over the period. This stability was accompanied by stability for the Andrew Peller Peer Group as well. In most years, Andrew Peller was in the second quartile and third quartile. Currently, Andrew Peller is slightly above median at -3% of EBITDA (-$1.30 million).
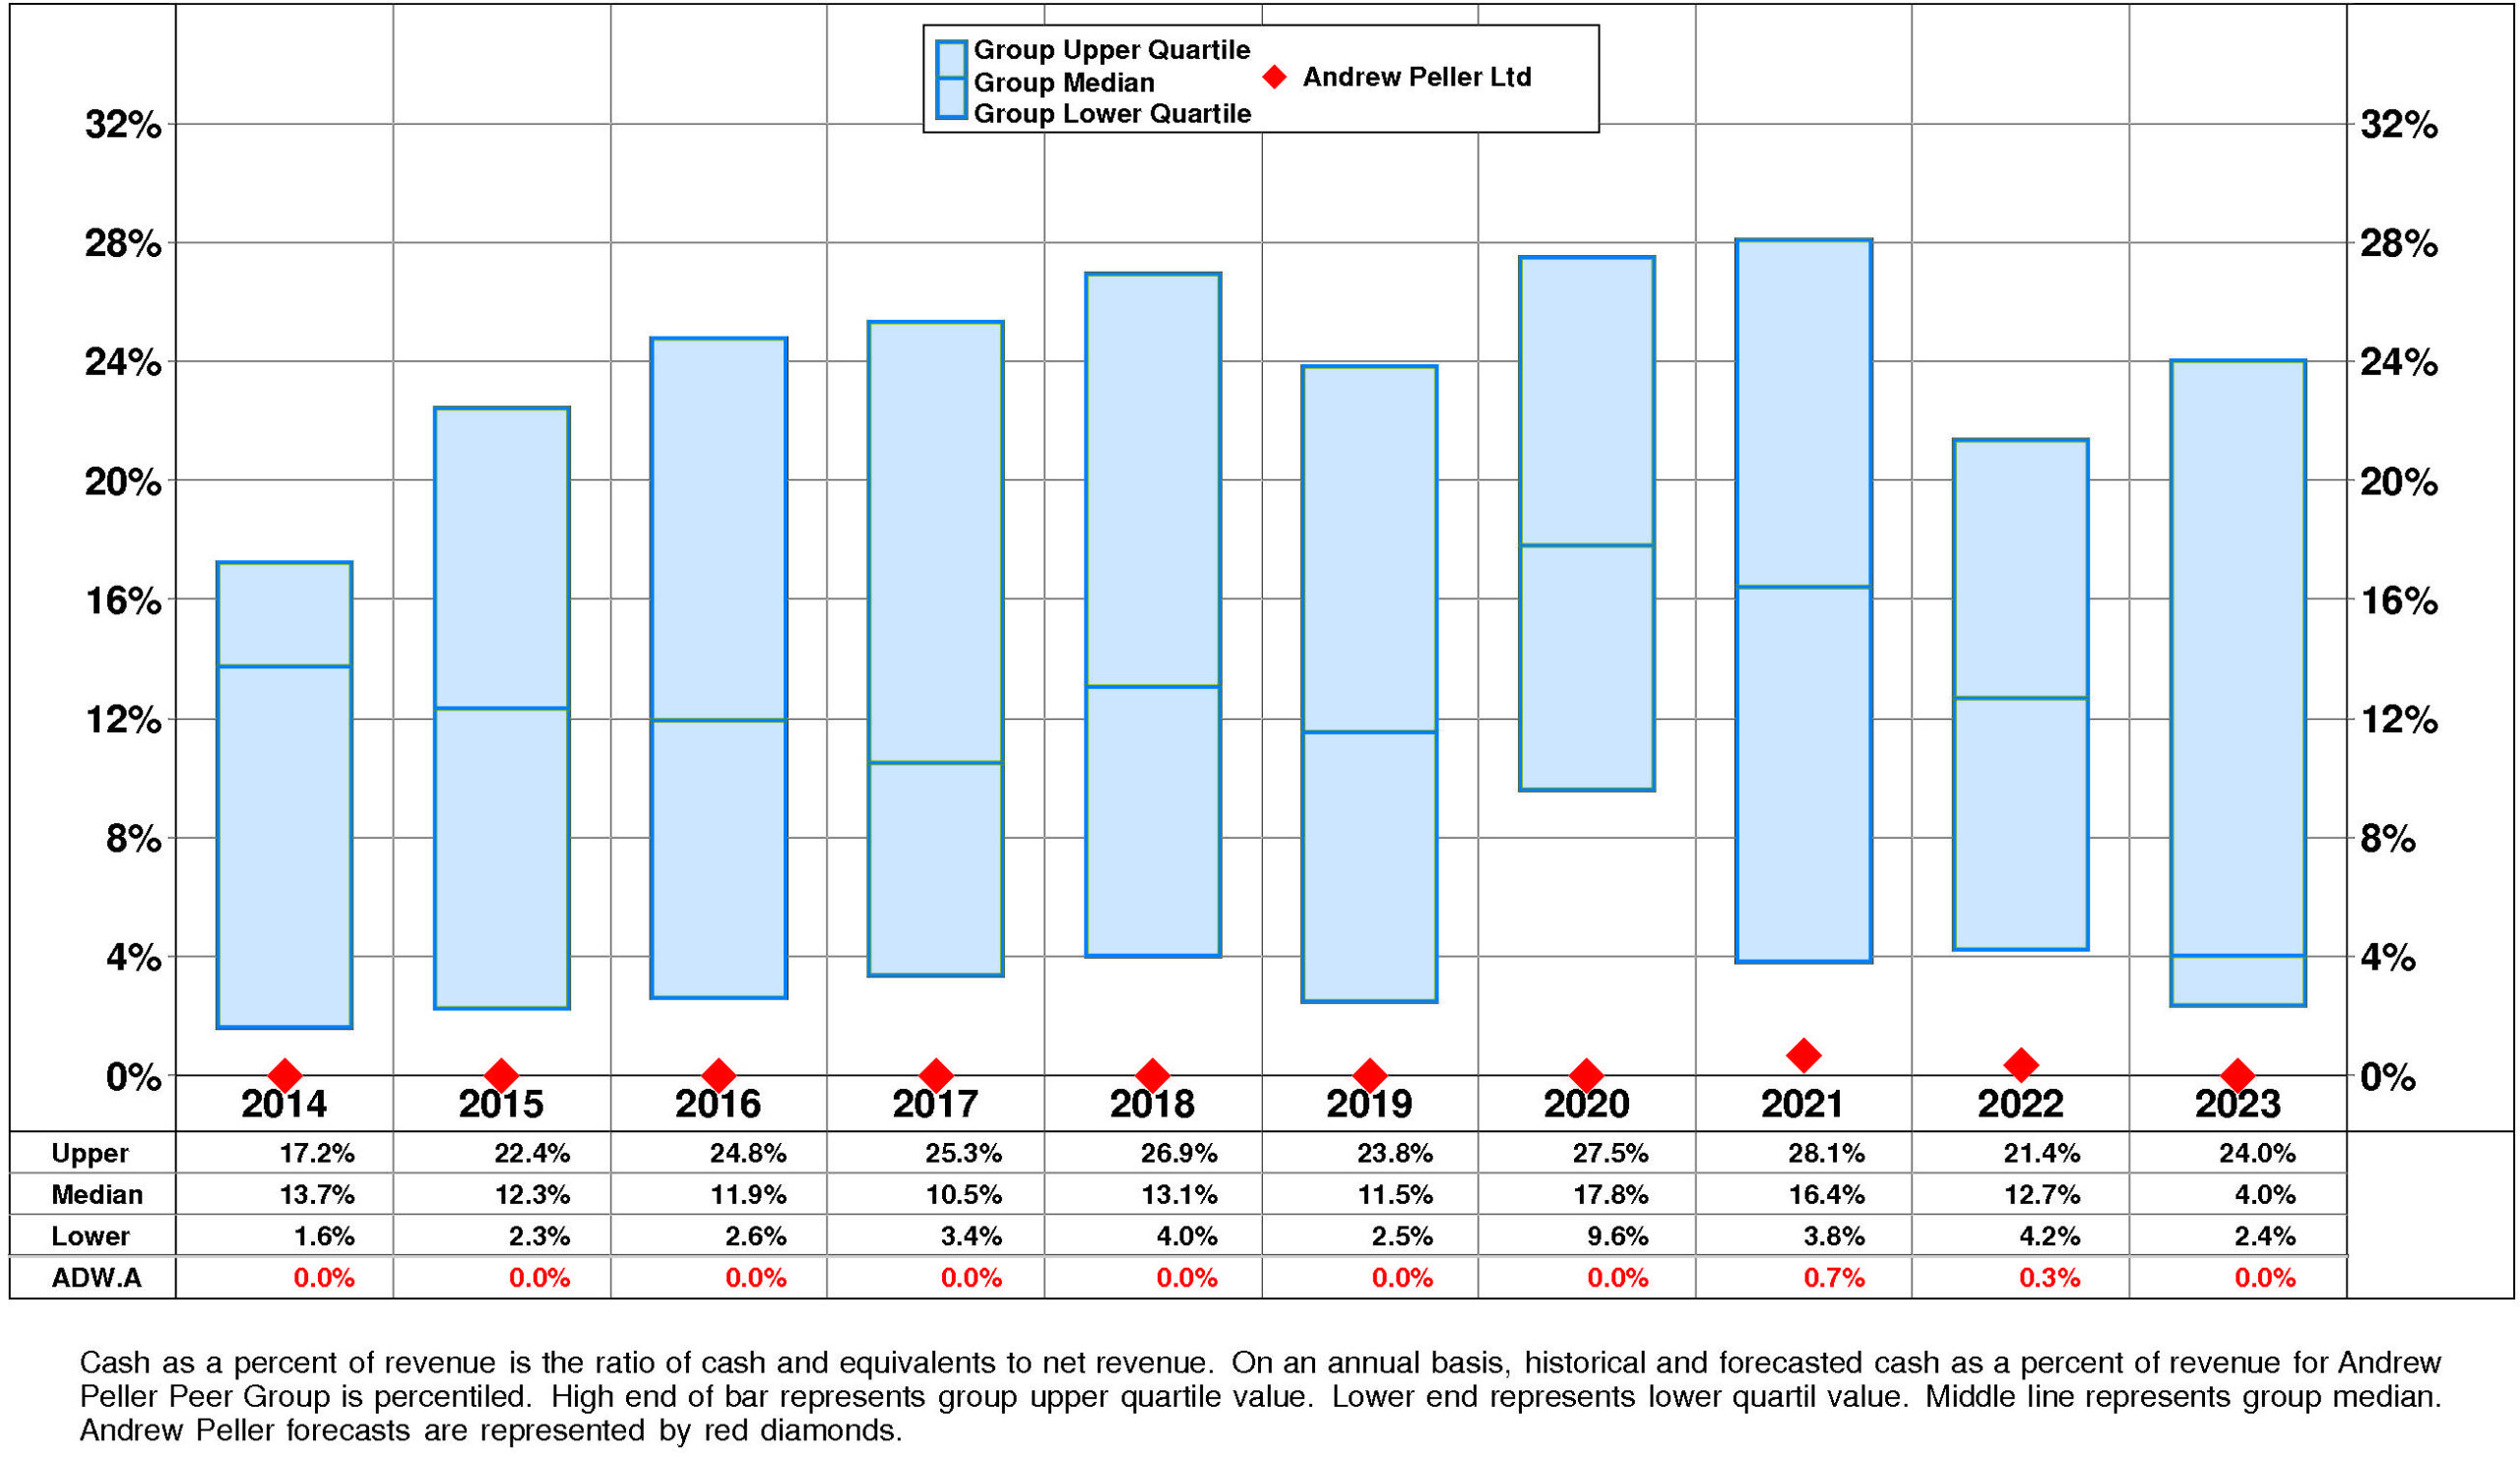
Andrew Peller’s Cash, %Revenue has exhibited little to no overall change over the period. This stability was accompanied by stability for the Andrew Peller Peer Group as well. In most years, Andrew Peller was in the lower quartile. Currently, Andrew Peller is lower quartile at 0%.
PROFITABILITY
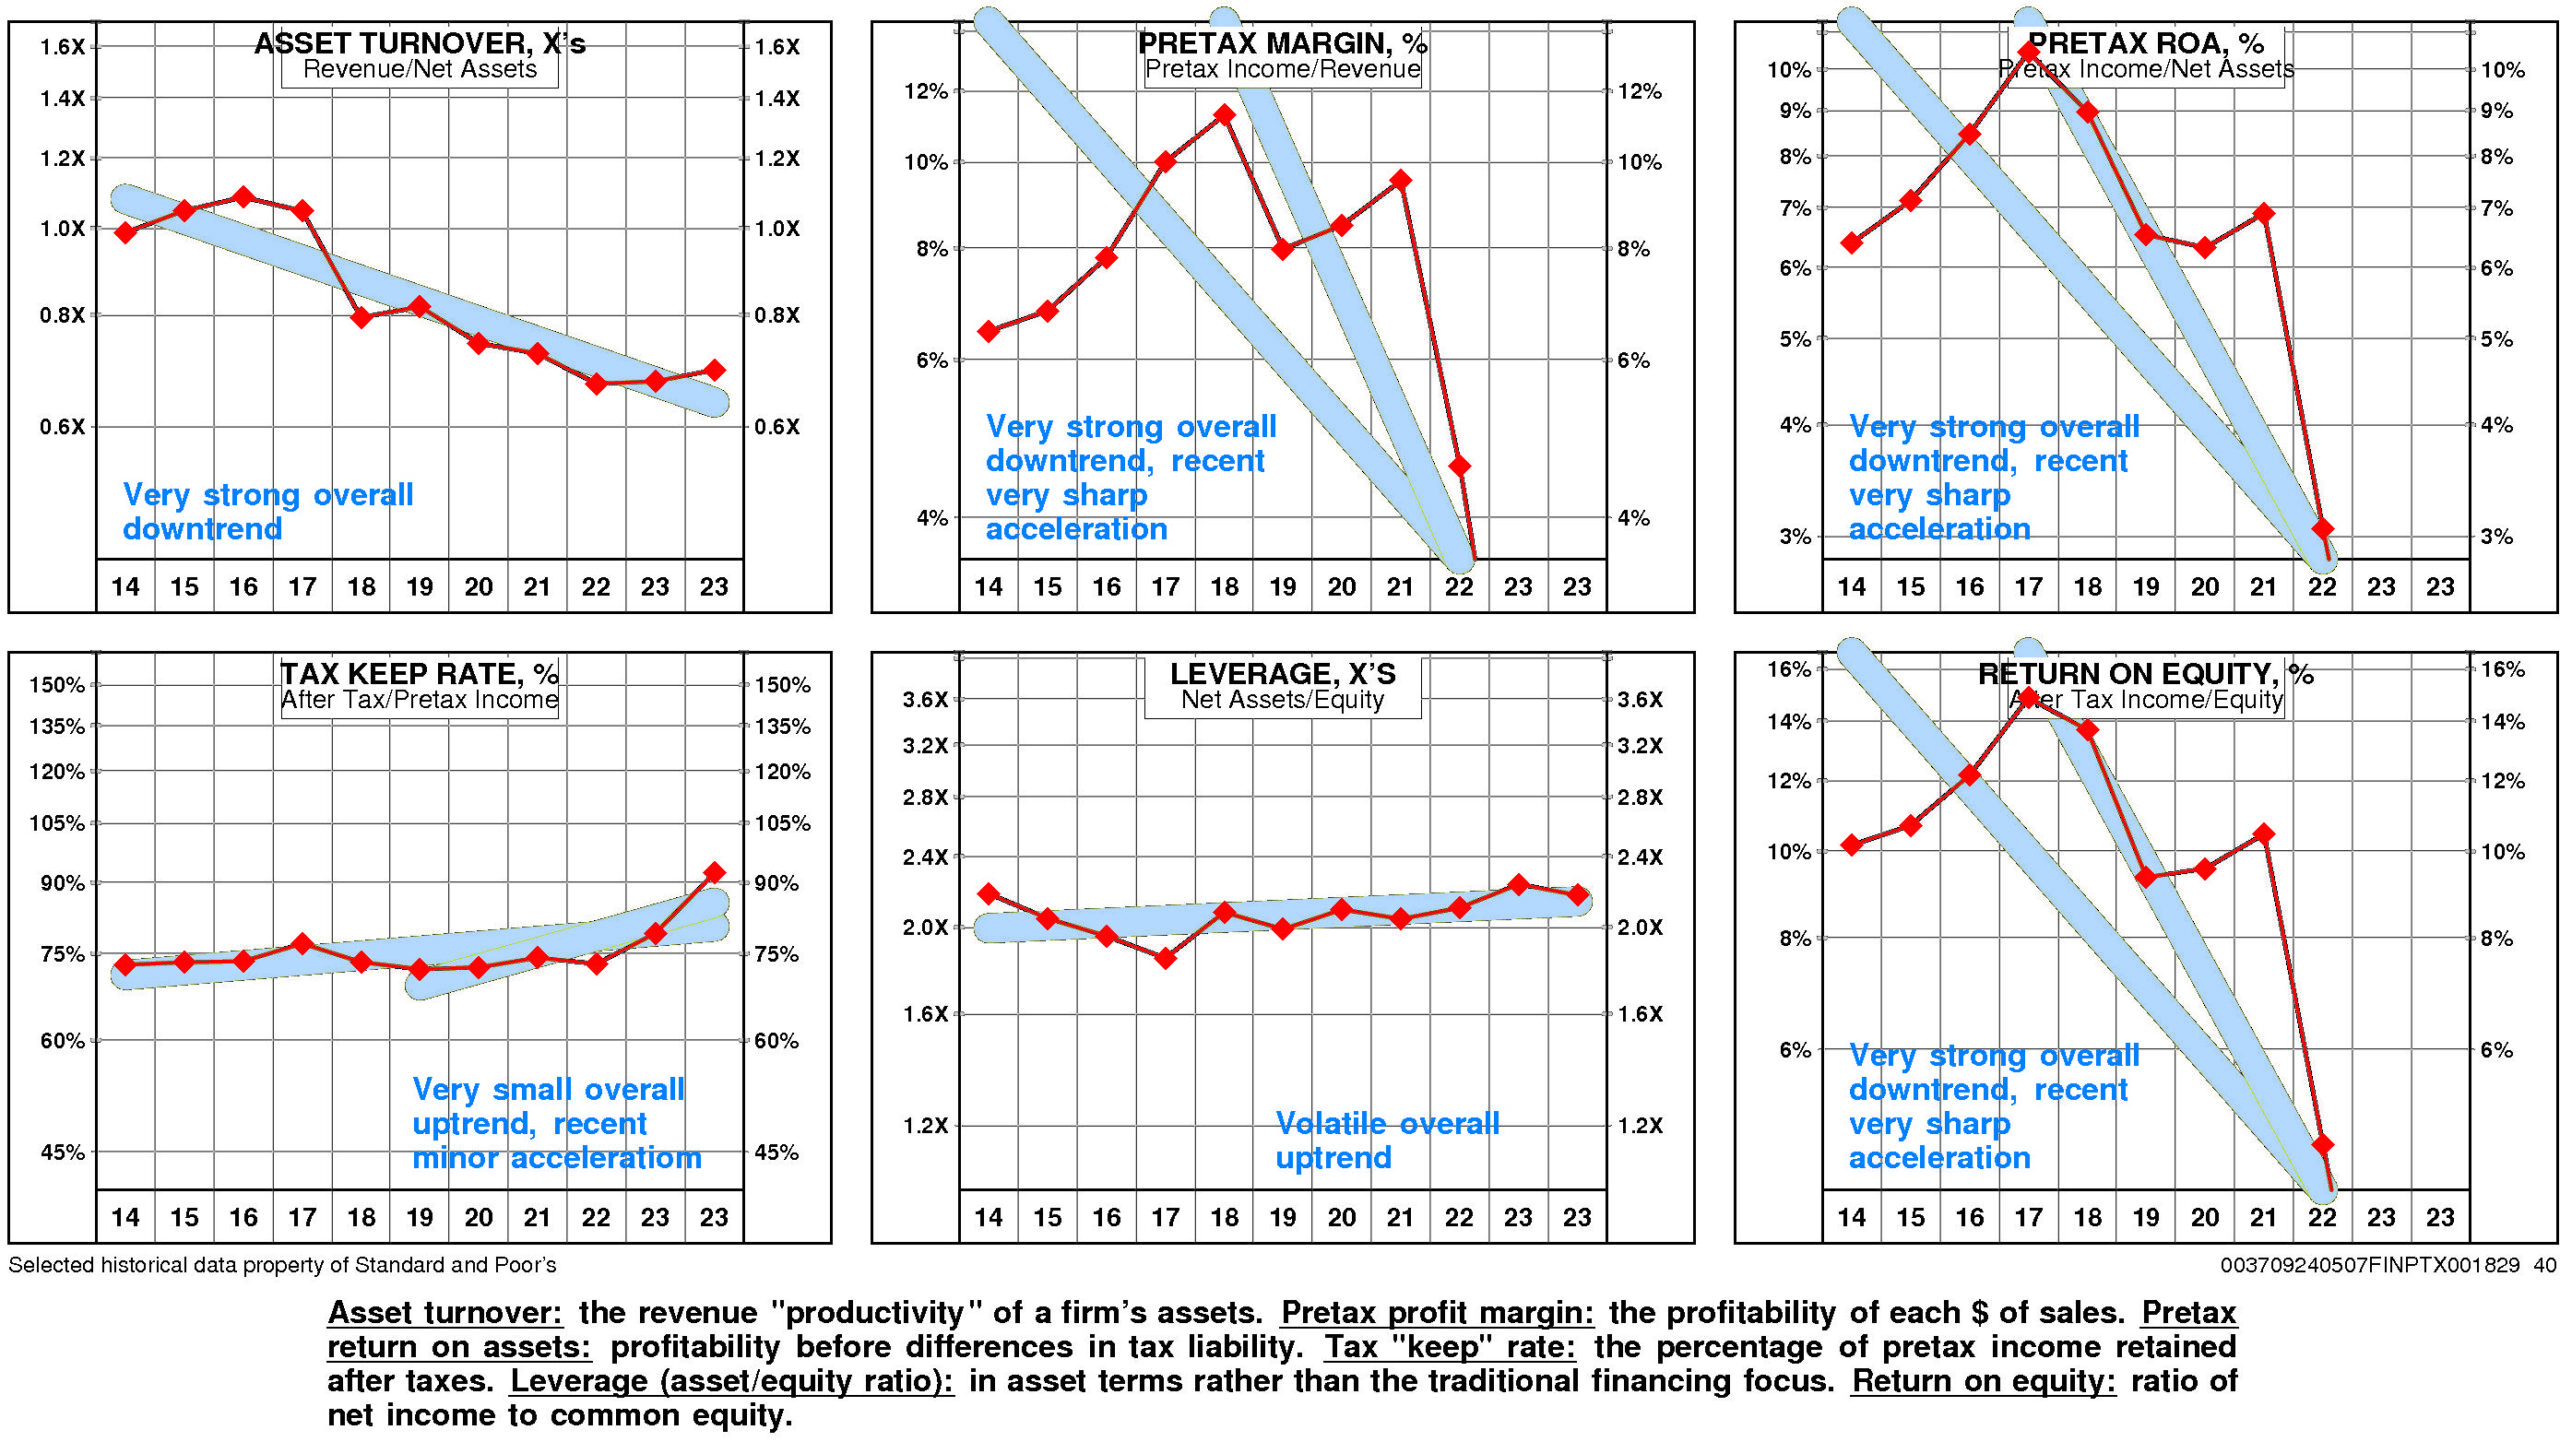
Andrew Peller’s return on equity has eroded very significantly since 2014. The current level is -2.4% versus the high of 10.2% and the low of -2.4%.
This very significant erosion was due to very strong negative trend in pretax operating return and strong negative trend in non-operating factors.
The productivity of Andrew Peller’s assets declined over the full period 2014-2023: asset turnover has suffered a very strong overall downtrend.
Reinforcing this trend, pretax margin experienced a very strong overall downtrend that accelerated very sharply from the 2018 level.
Non-operating factors (income taxes and financial leverage) had a significant negative influence on return on equity.
Andrew Peller’s return on equity is lower quartile (-2.4%) for the four quarters ended December, 2023.
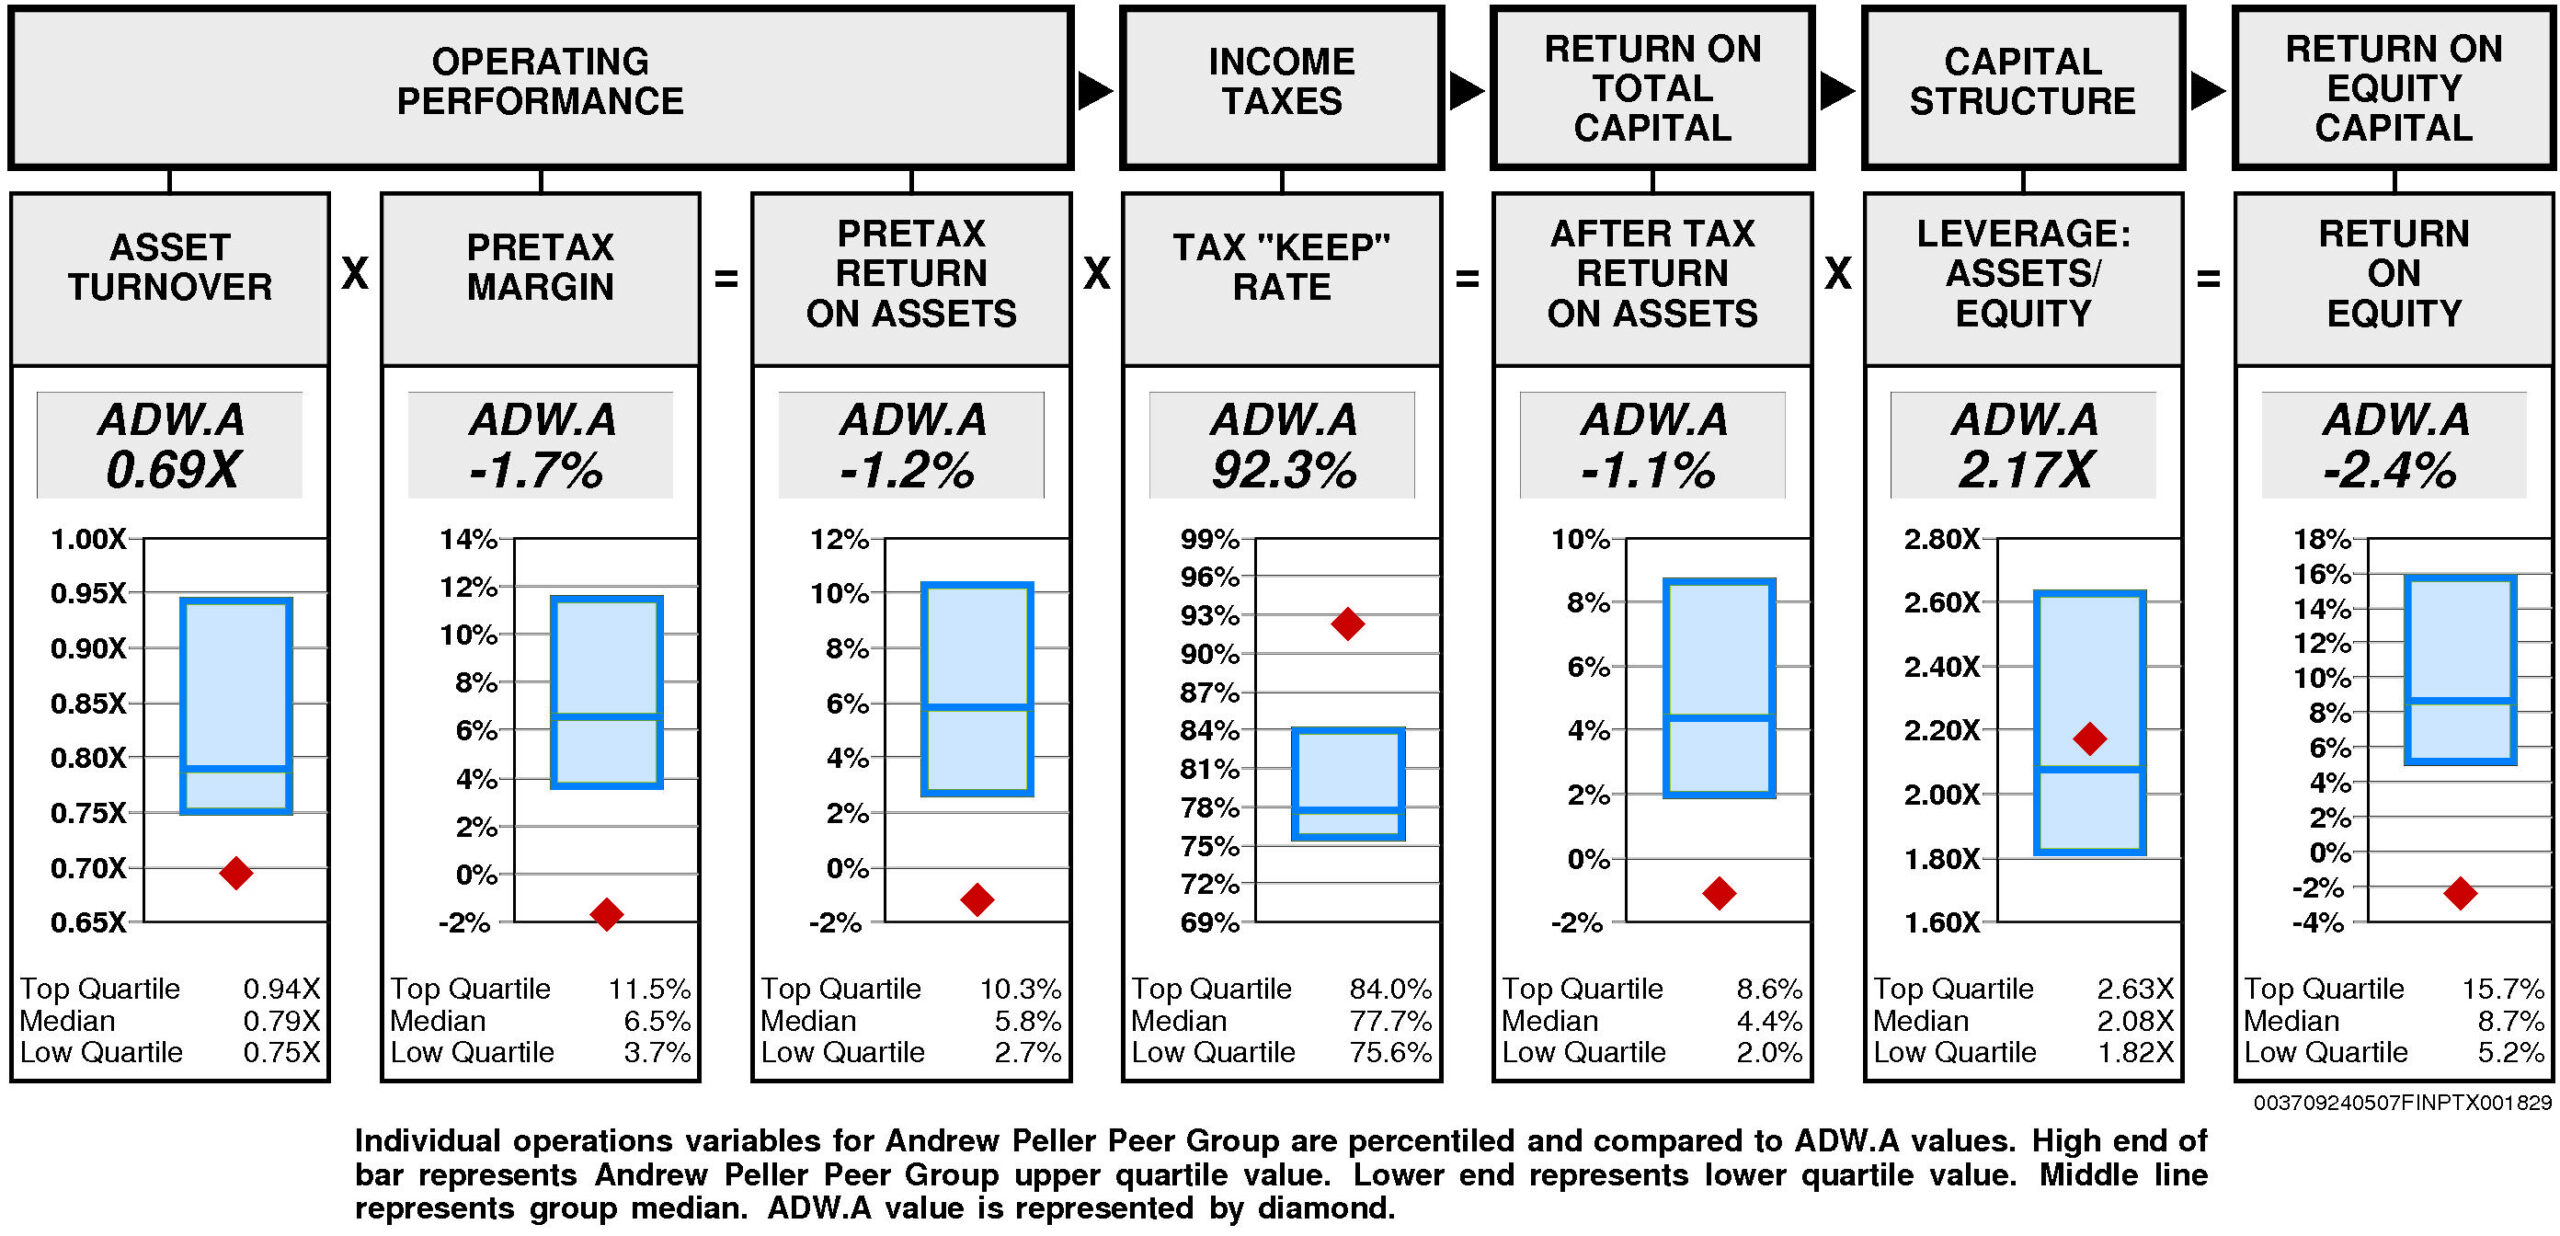
Operating performance (pretax return on assets) is lower quartile (-1.2%) reflecting asset turnover that is lower quartile (0.69X) and lower quartile pretax margin (-1.7%).
Tax “keep” rate (income tax management) is upper quartile (92.3%) resulting in after tax return on assets that is lower quartile.
Financial leverage (leverage) is slightly above median (2.17X).
GROWTH RATES
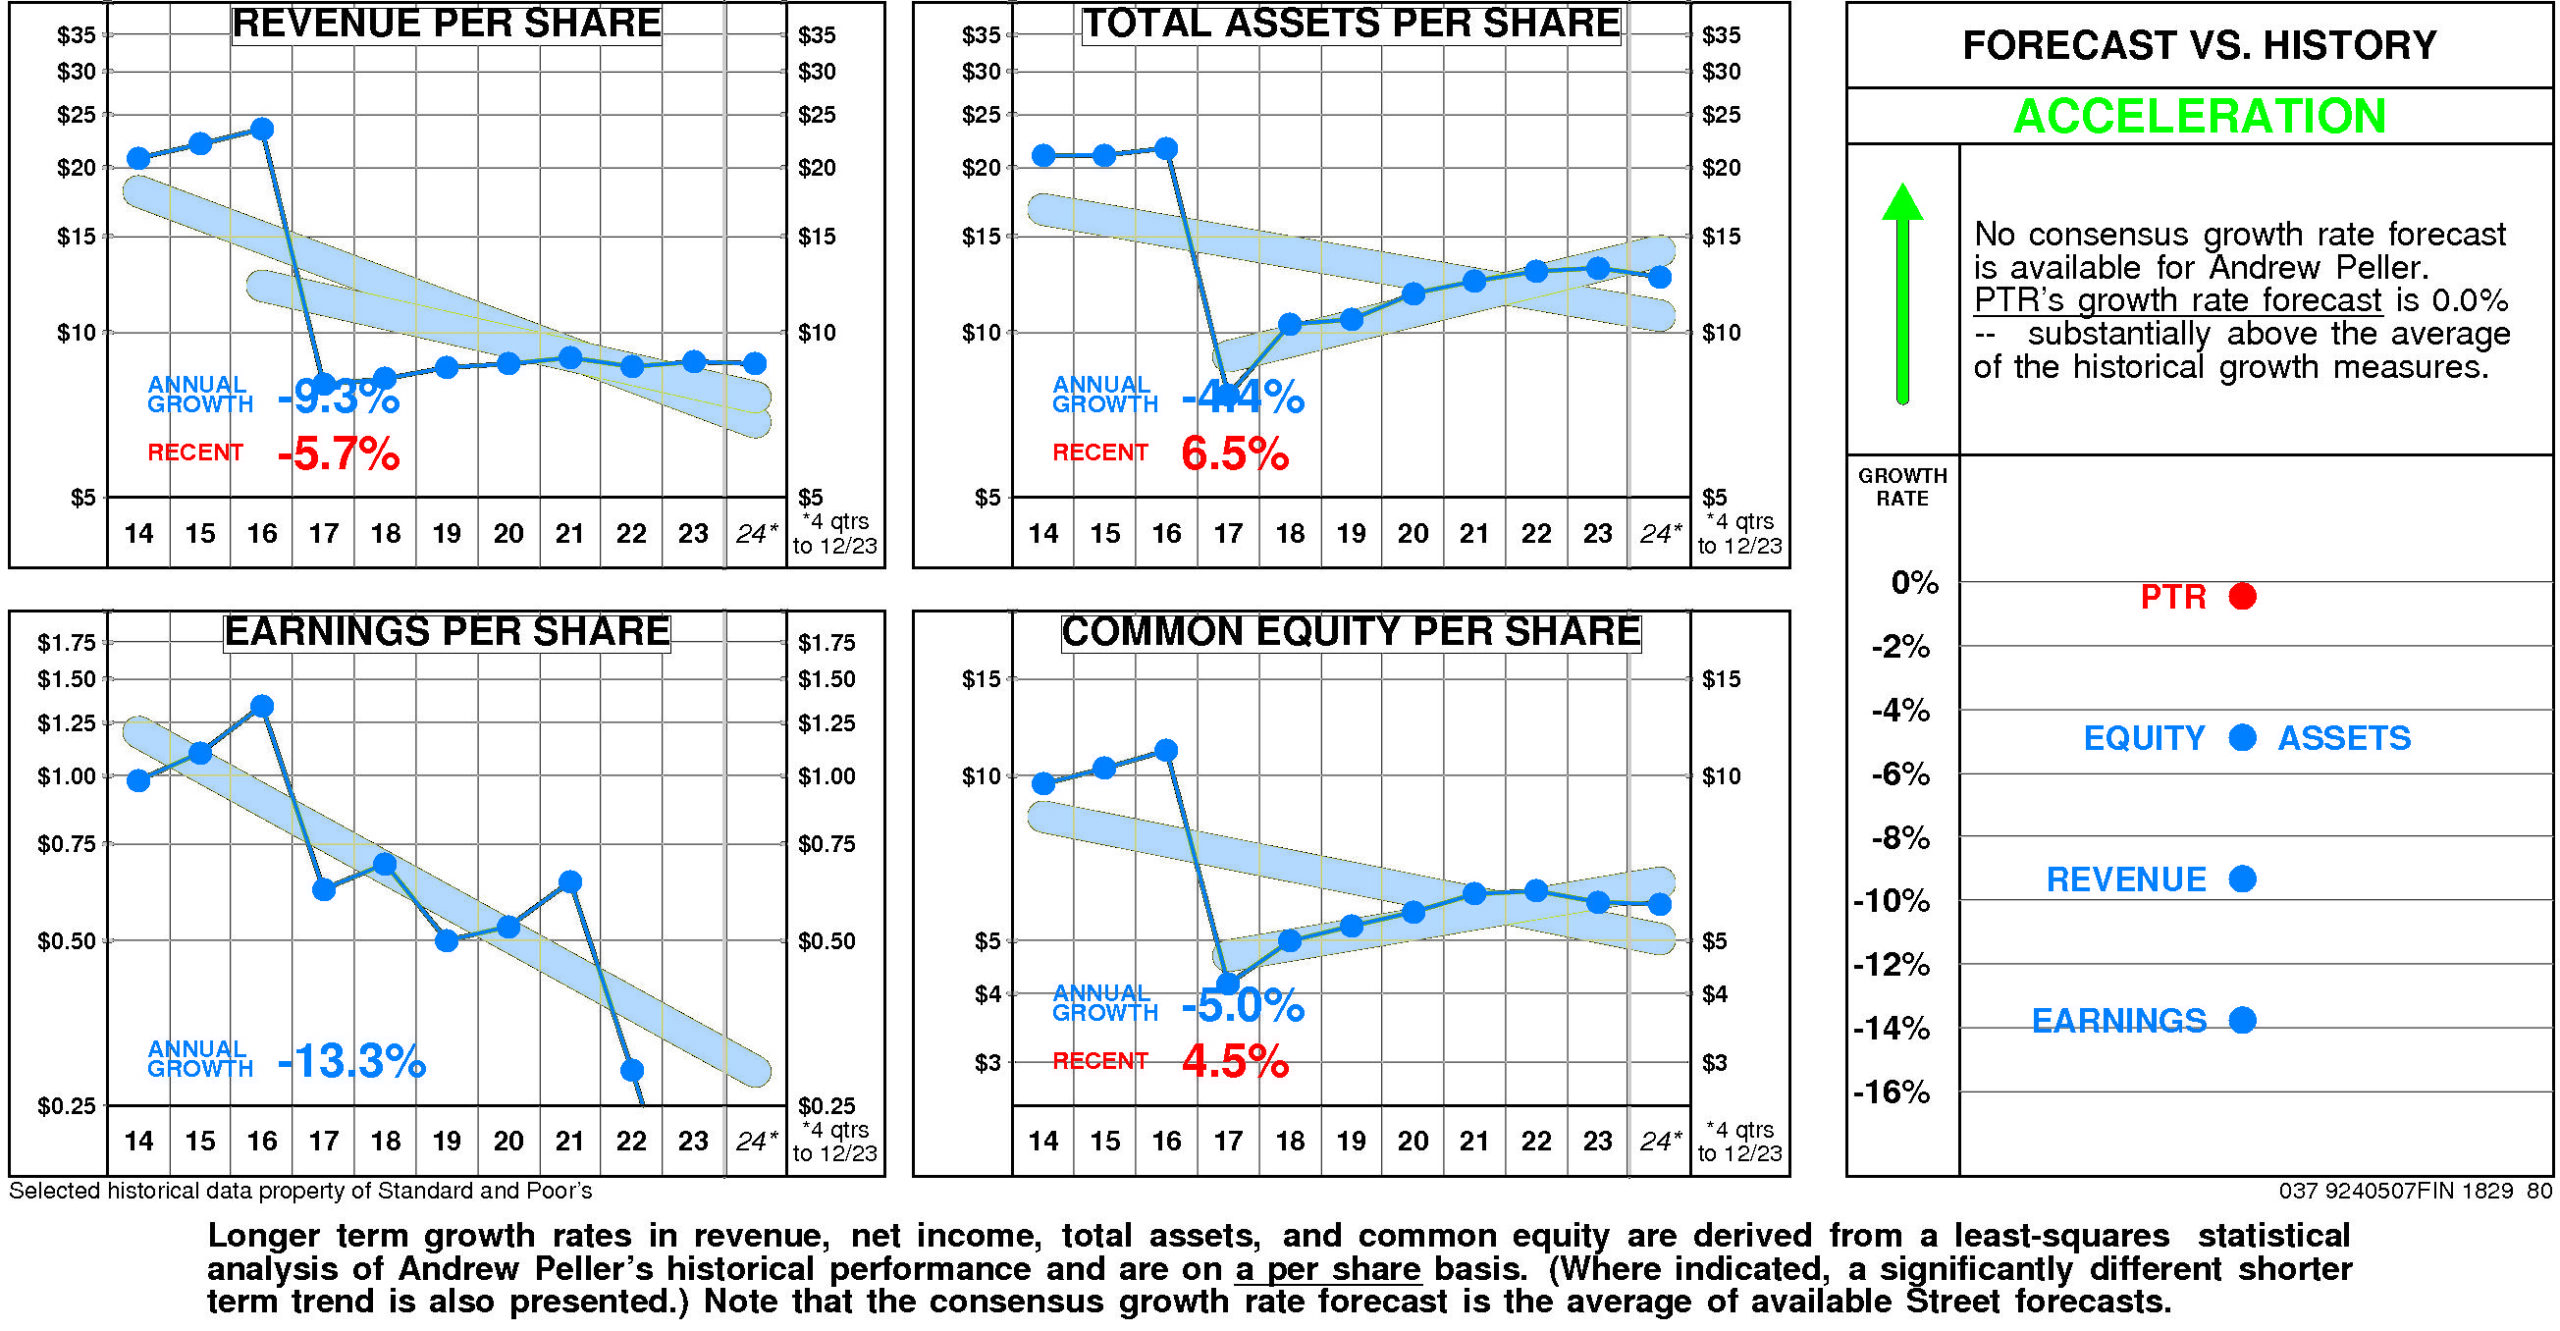
There are no significant differences between Andrew Peller’s longer term growth and growth in recent years.
Andrew Peller’s historical income statement growth has been lower than balance sheet growth. Revenue growth has fallen short of asset growth; earnings growth has fallen short of equity growth.
Annual revenue growth has been -9.3% per year. (More recently it has been -5.7%.)
Total asset growth has been -4.4% per year. (More recently it has been 6.5%.)
Annual E.P.S. growth has been -13.3% per year.
Equity growth has been -5.0% per year. (More recently it has been 4.5%.)
No consensus growth rate forecast is available for Andrew Peller.
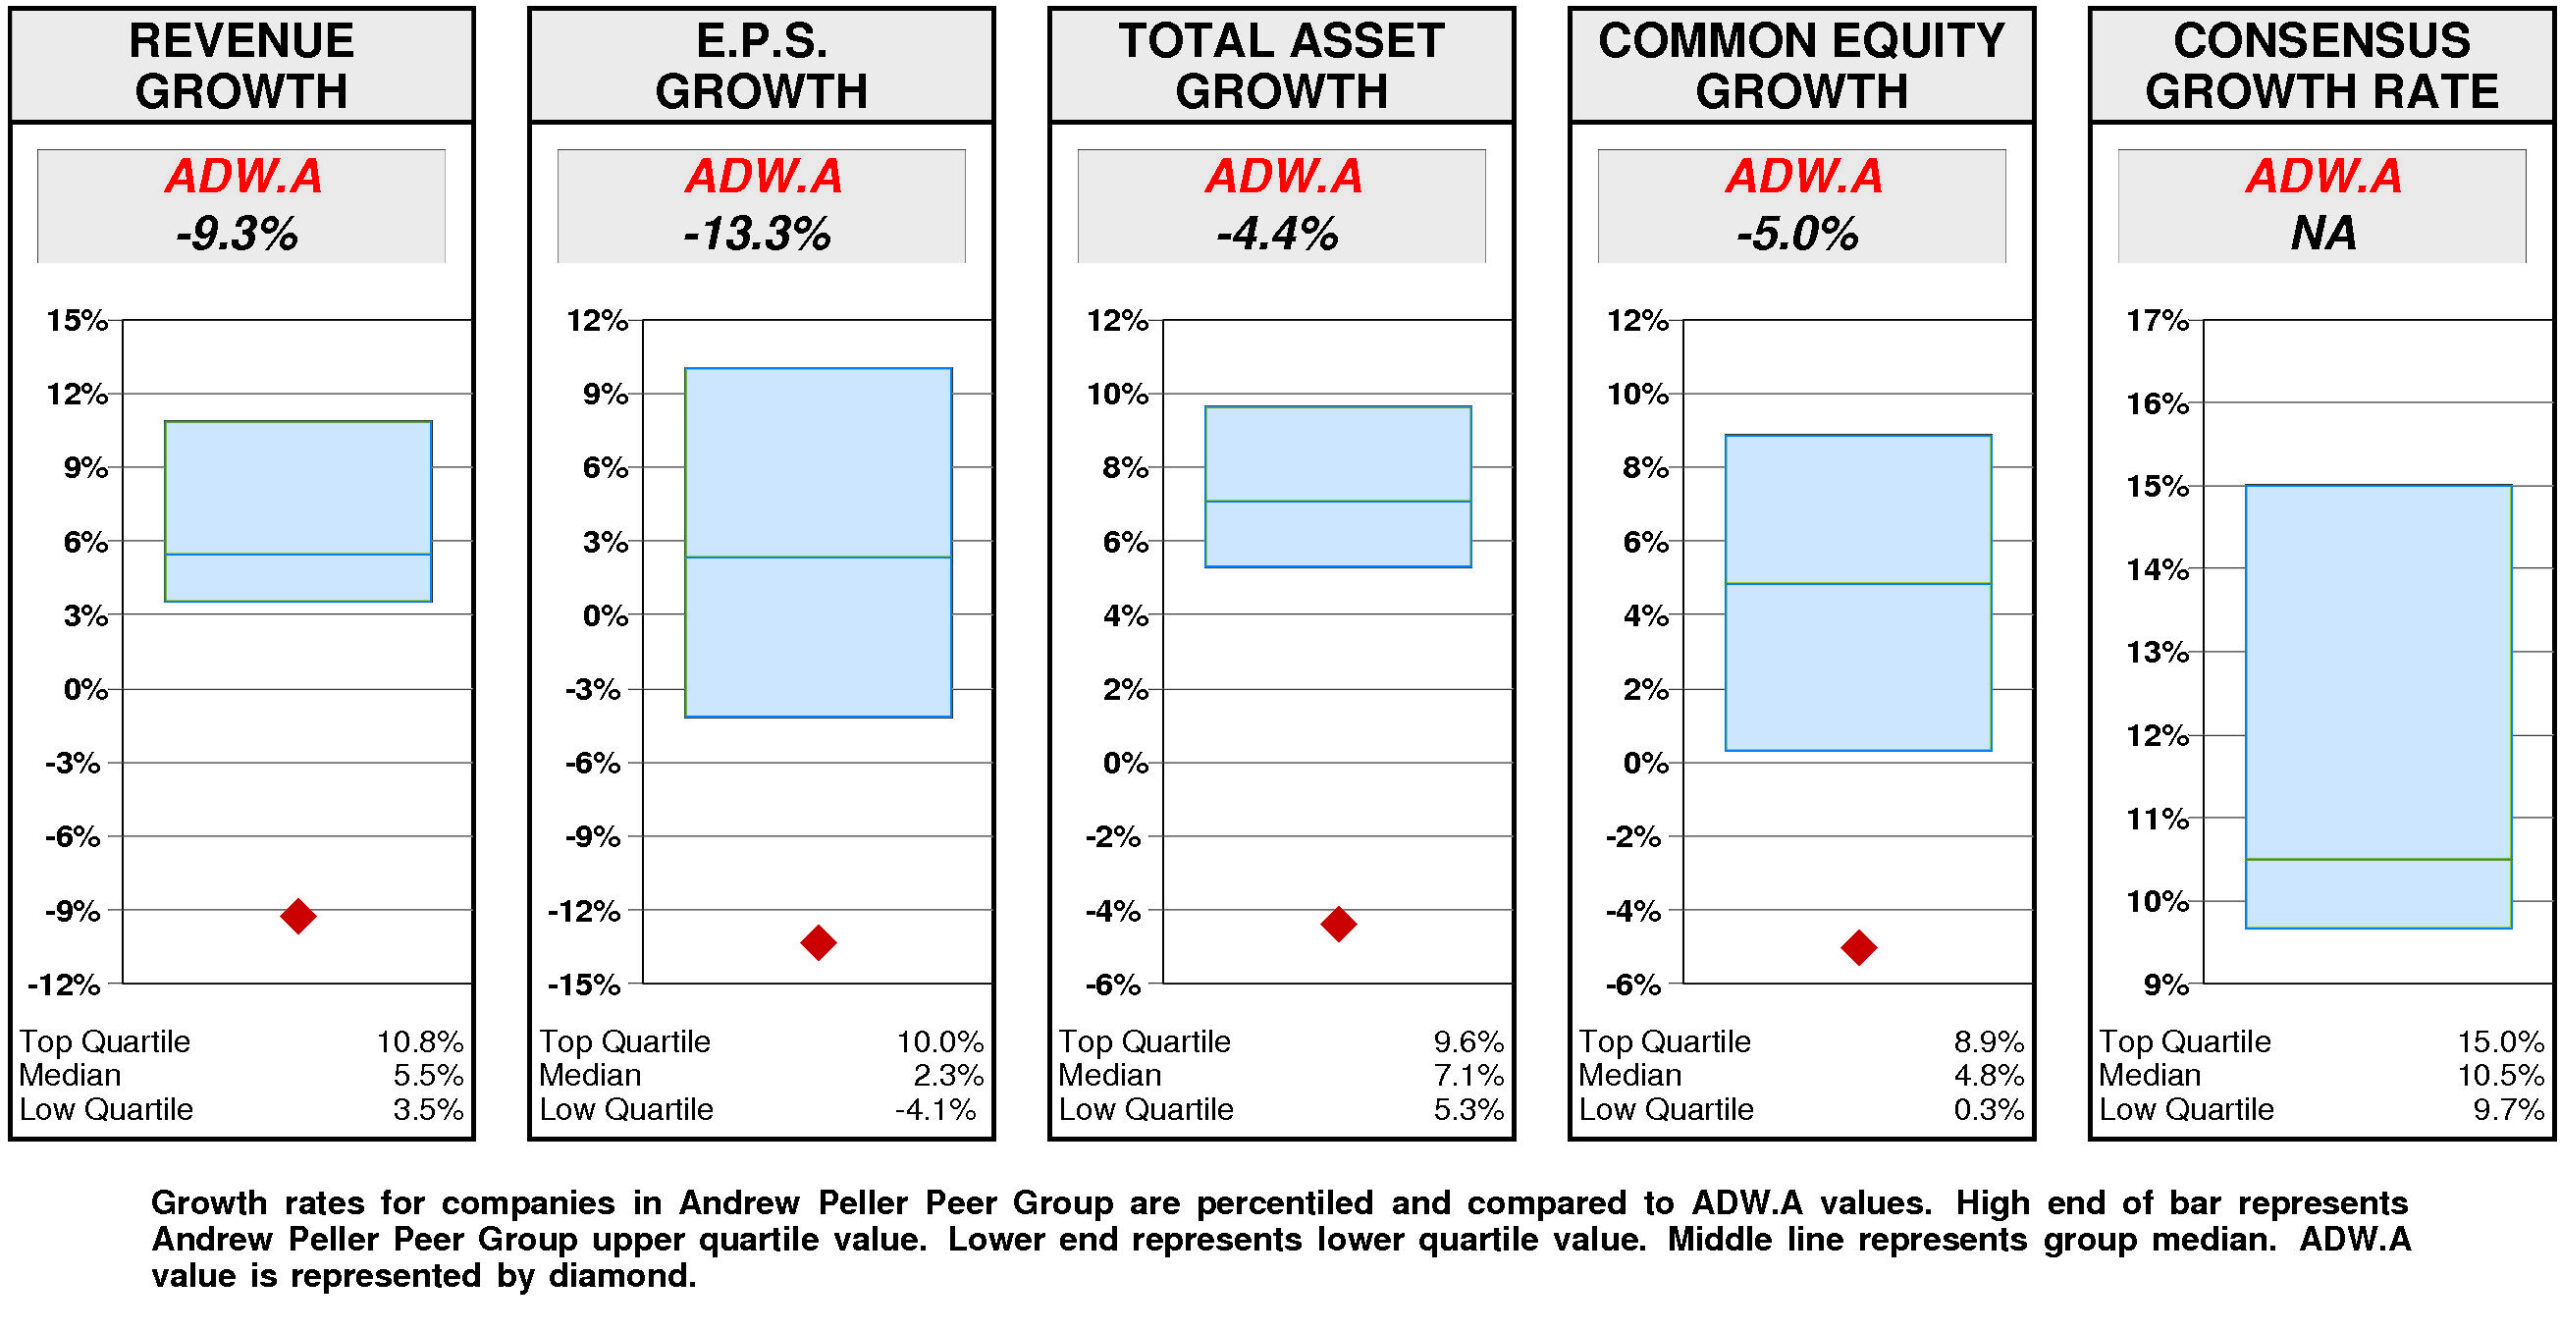
Relative to the Andrew Peller Peer Group, Andrew Peller’s historical growth measures are consistently lower quartile. Revenue growth (-9.3%) has been lower quartile. Total asset growth (-4.4%) has been lower quartile. E.P.S. growth (-13.3%) has been lower quartile. Equity growth (-5.0%) has been lower quartile.
Consensus growth forecast is unavailable.
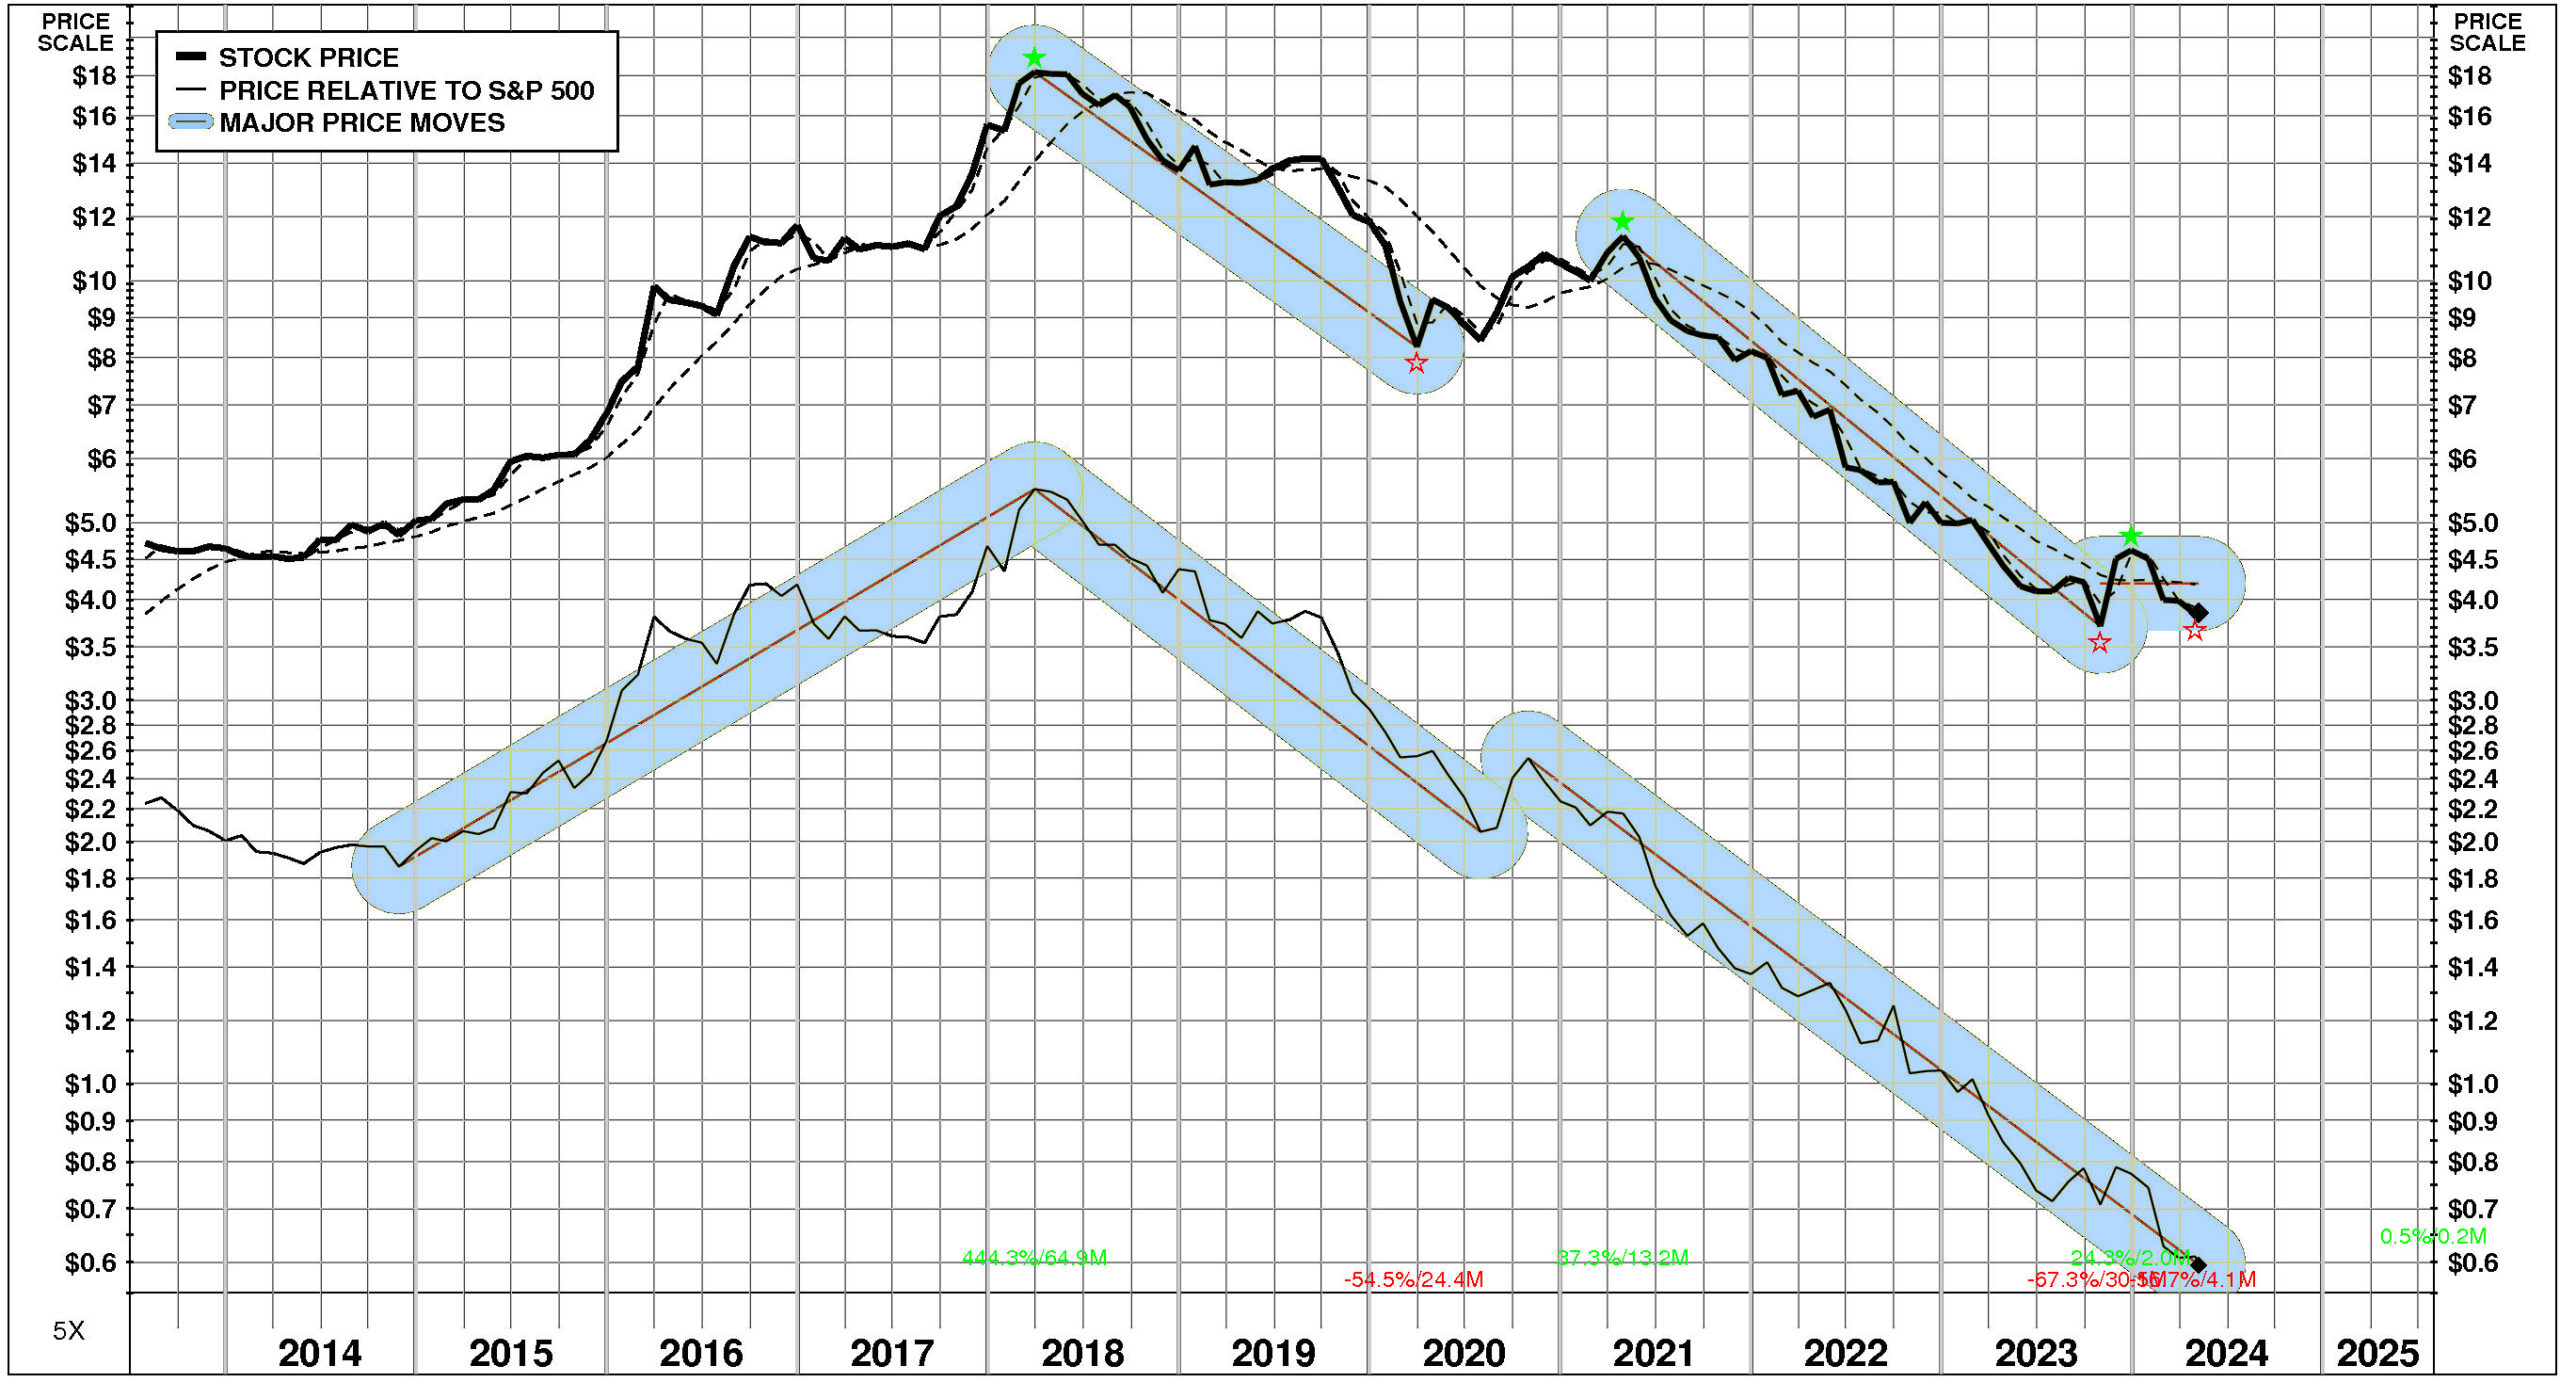
PRICE HISTORY
Over the full time period, Andrew Peller’s stock price performance has been significantly below market. Between July, 2013 and May, 2024, Andrew Peller’s stock price fell -18%; relative to the market, this was a -73% loss. Significant price moves during the period: 1) April, 2021 – October, 2023: -67%; and 2) March, 2018 – March, 2020: -54%.
TOTAL INVESTMENT RETURNS
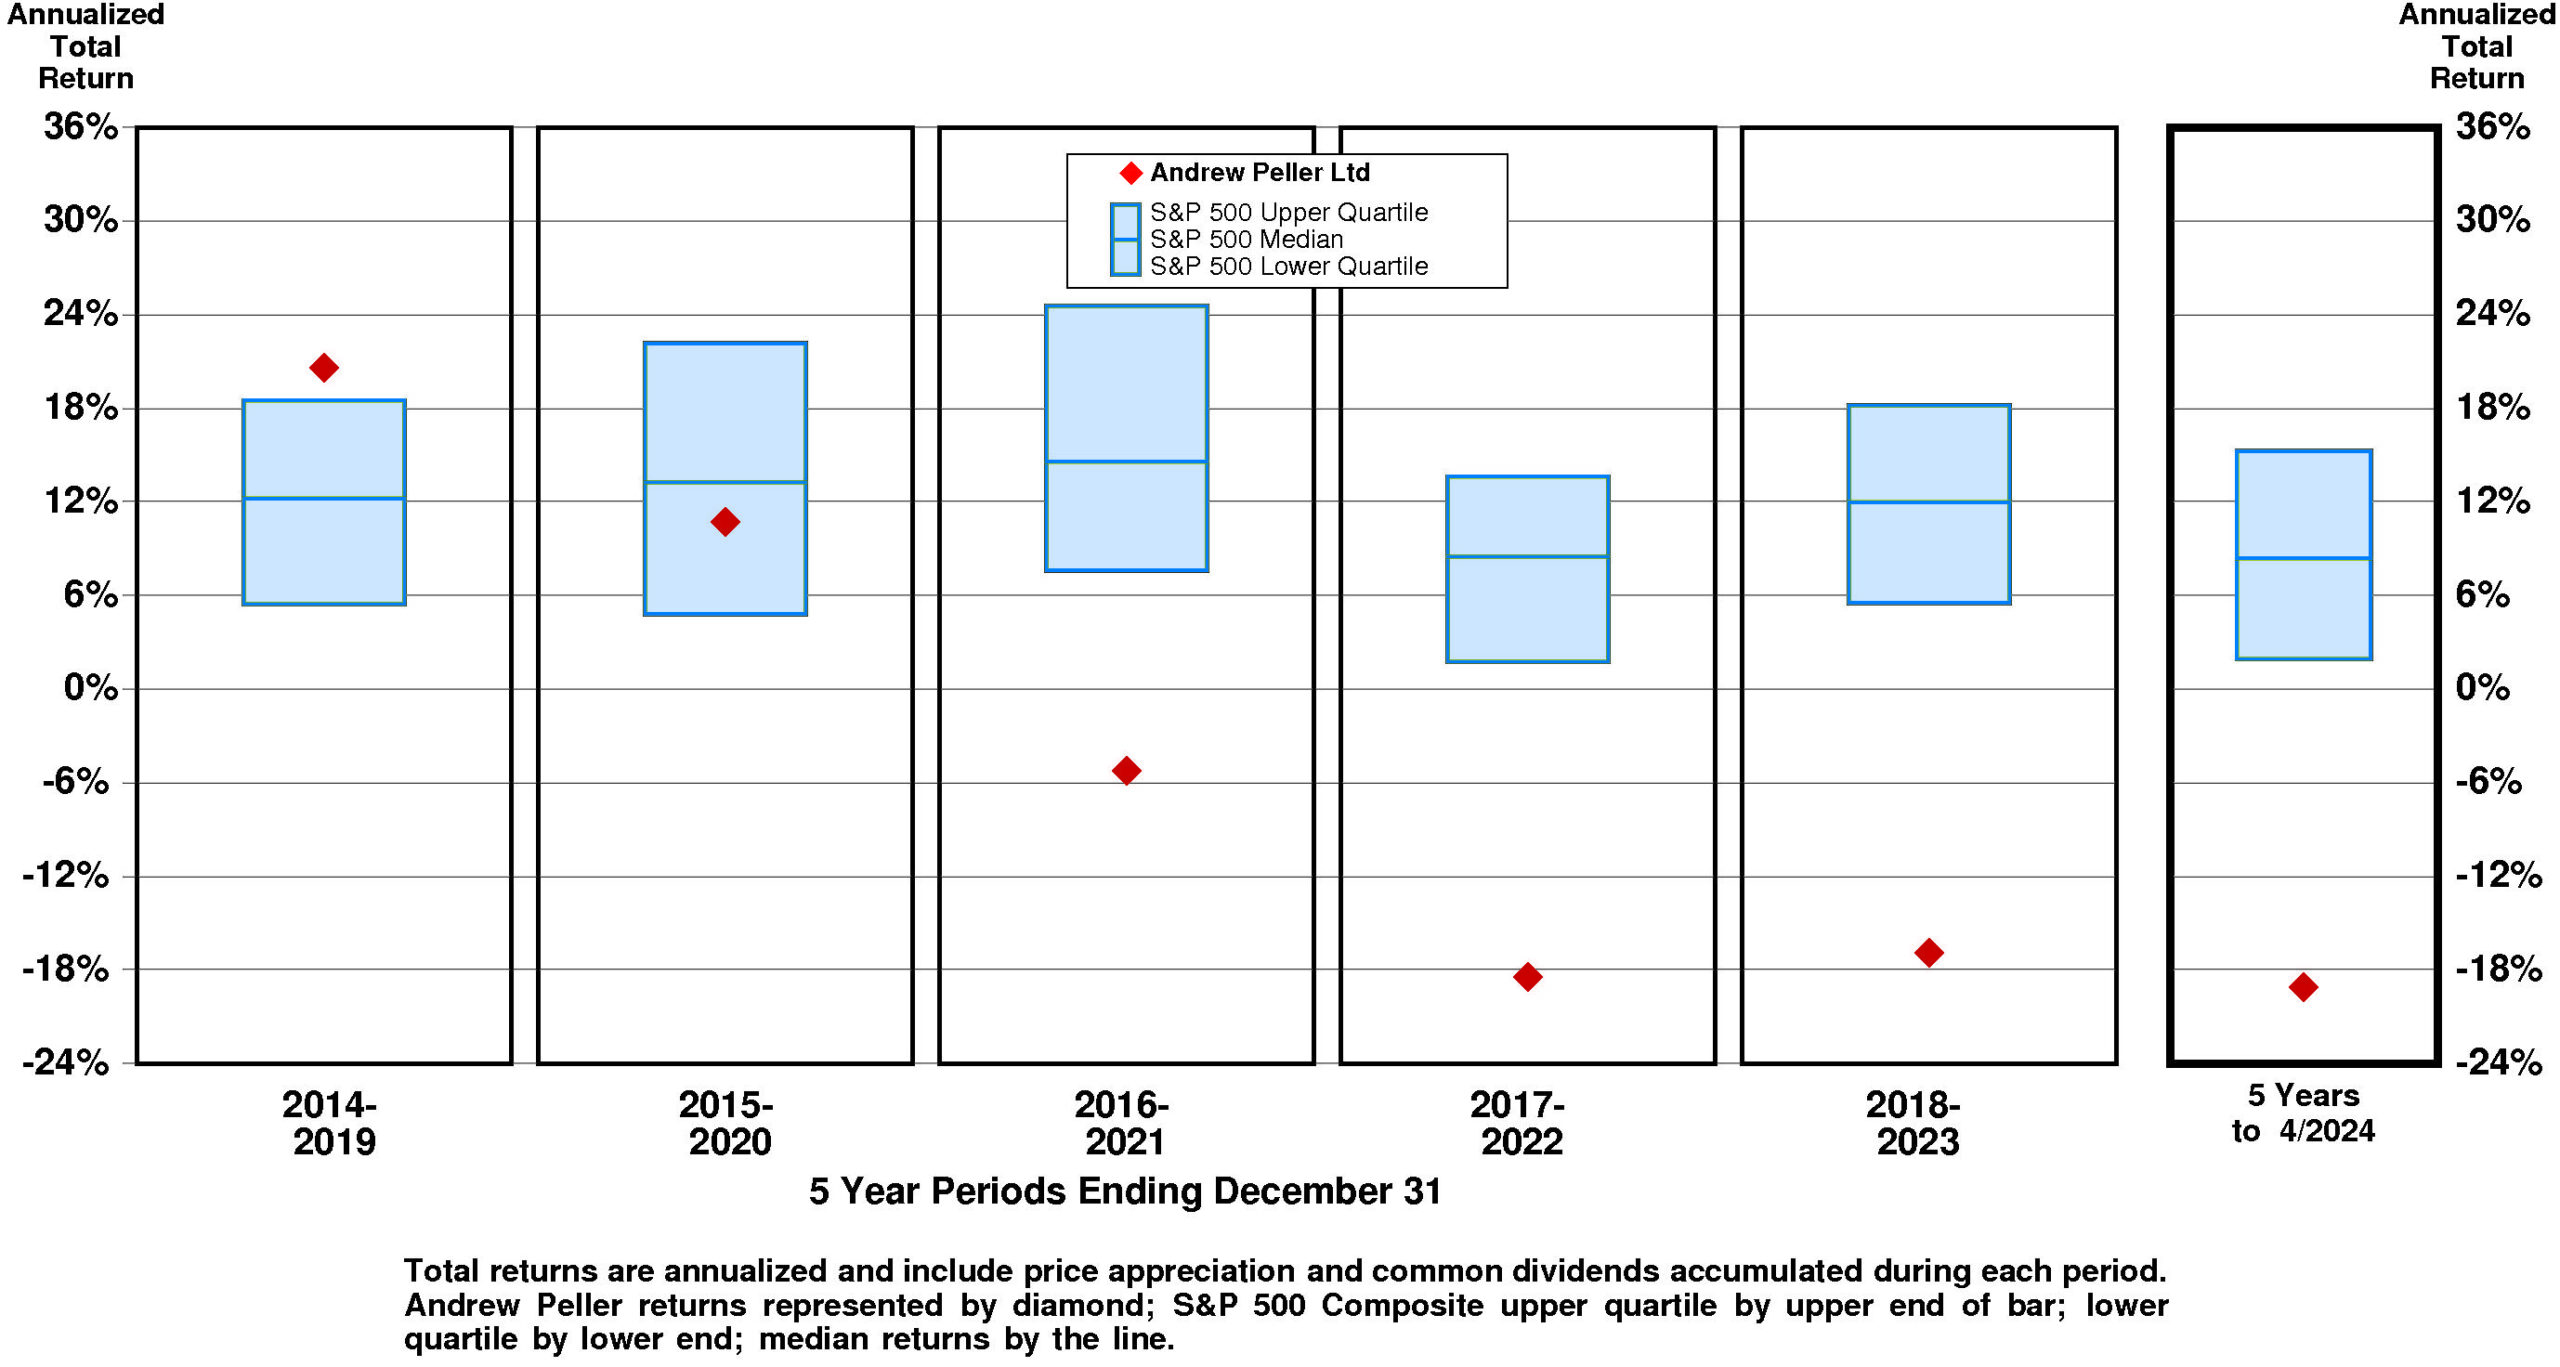
Current annual total return performance of -7.7% is lower quartile relative to the S&P 500 Composite.
In addition to being lower quartile relative to S&P 500 Composite, current annual total return performance through April, 2024 of -7.7% is substantially below median relative to Andrew Peller Ltd Peer Group.
Current 5-year total return performance of -19.1% is lower quartile relative to the S&P 500 Composite.
Through April, 2024, with lower quartile current 5-year total return of -19.1% relative to S&P 500 Composite, Andrew Peller’s total return performance is lower quartile relative to Andrew Peller Ltd Peer Group.
VALUATION BENCHMARKS
Relative to S&P 500 Composite, ADW.A’s overall valuation is quite low. Ratio of enterprise value/earnings before interest and taxes is above median. Ratio of enterprise value/assets is lower quartile. Ratio of enterprise value/revenue is lower quartile. Price/equity ratio is lower quartile. Price/earnings ratio is unavailable.
Relative to Andrew Peller Peer Group, ADW.A’s overall valuation is quite low. Ratio of enterprise value/earnings before interest and taxes is at the upper quartile. Ratio of enterprise value/revenue is lower quartile. Ratio of enterprise value/assets is lower quartile. Price/equity ratio is lower quartile. Price/earnings ratio is unavailable.
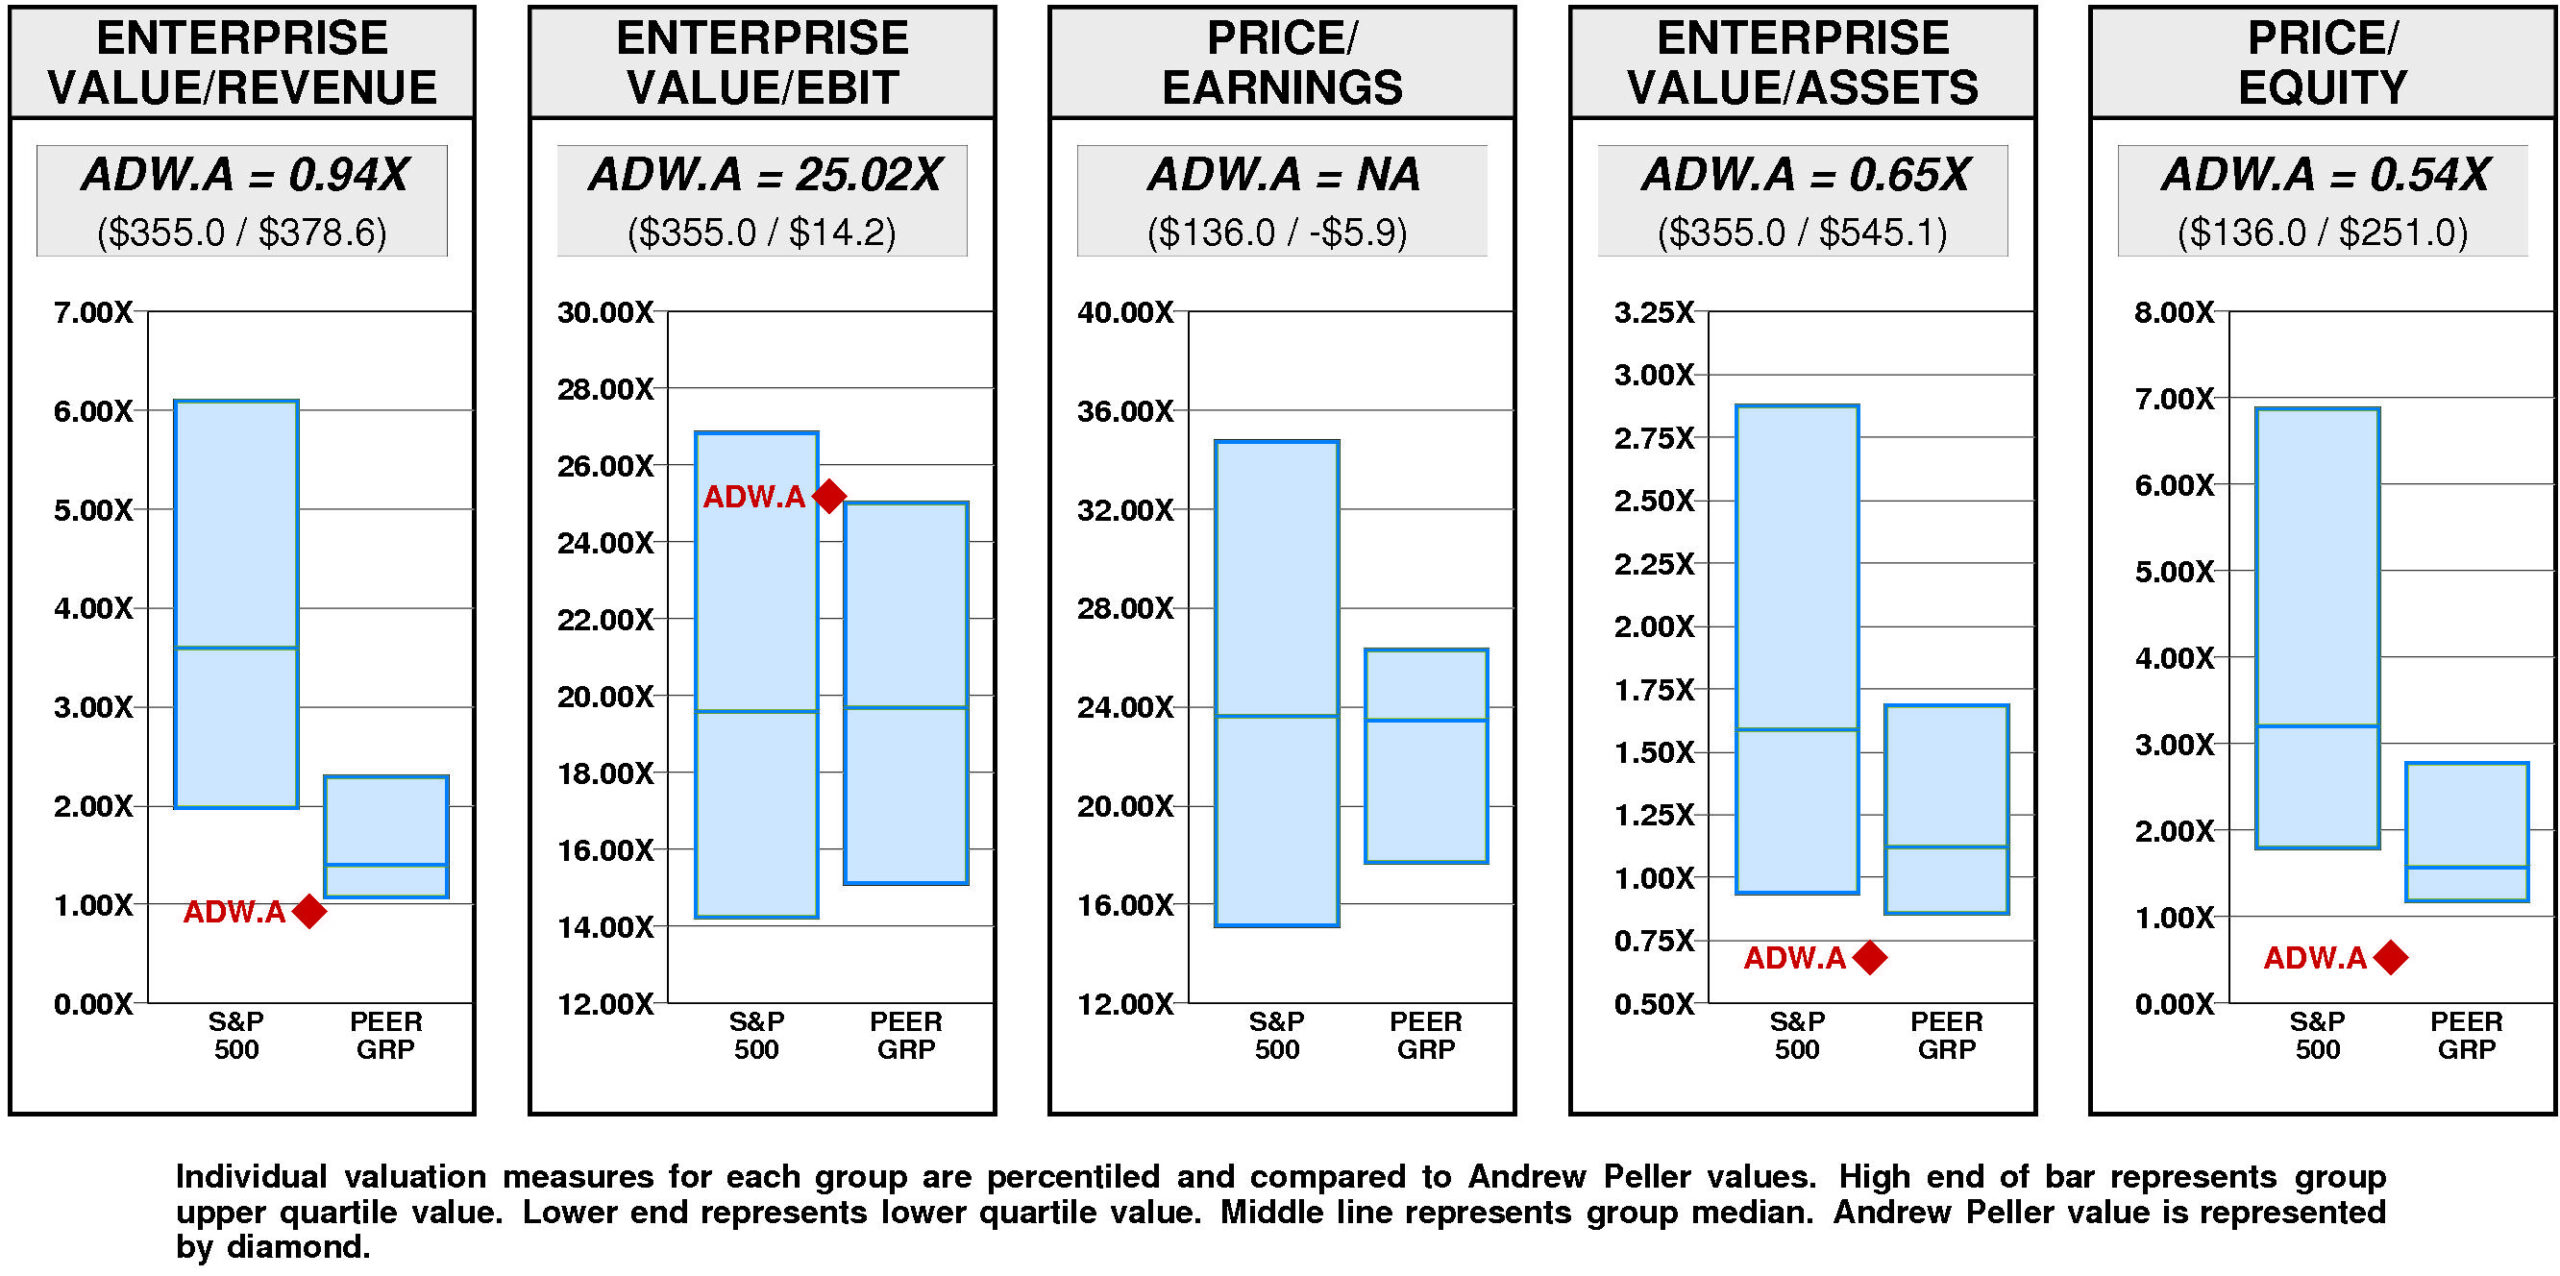
Andrew Peller has a major value gap compared to the median. For ADW.A to hit median valuation, its current ratio of enterprise value/revenue would have to rise from the current level of 0.94X to 1.40X. If ADW.A’s ratio of enterprise value/revenue were to rise to 1.40X, its stock price would be higher by $5 to $9.
For ADW.A to achieve upper quartile valuation relative to the Andrew Peller Peer Group, its current ratio of enterprise value/revenue would have to rise from the current level of 0.94X to 2.29X. If ADW.A’s ratio of enterprise value/revenue were to rise to 2.29X, its stock price would increase by $15 from the current level of $3.86.
VALUE TARGETS
With future capital returns forecasted to be in line with the cost of capital, ADW.A is expected to be Value Creation neutral.
Andrew Peller’s current Price Target of $6 represents a +65% change from the current price of $3.84.
This neutral appreciation potential results in an appreciation score of 59 (41% of the universe has greater appreciation potential.)
Reinforcing this neutral Appreciation Score of 59, the moderately low Power Rating of 35 contributes to an Value Trend Rating of C.
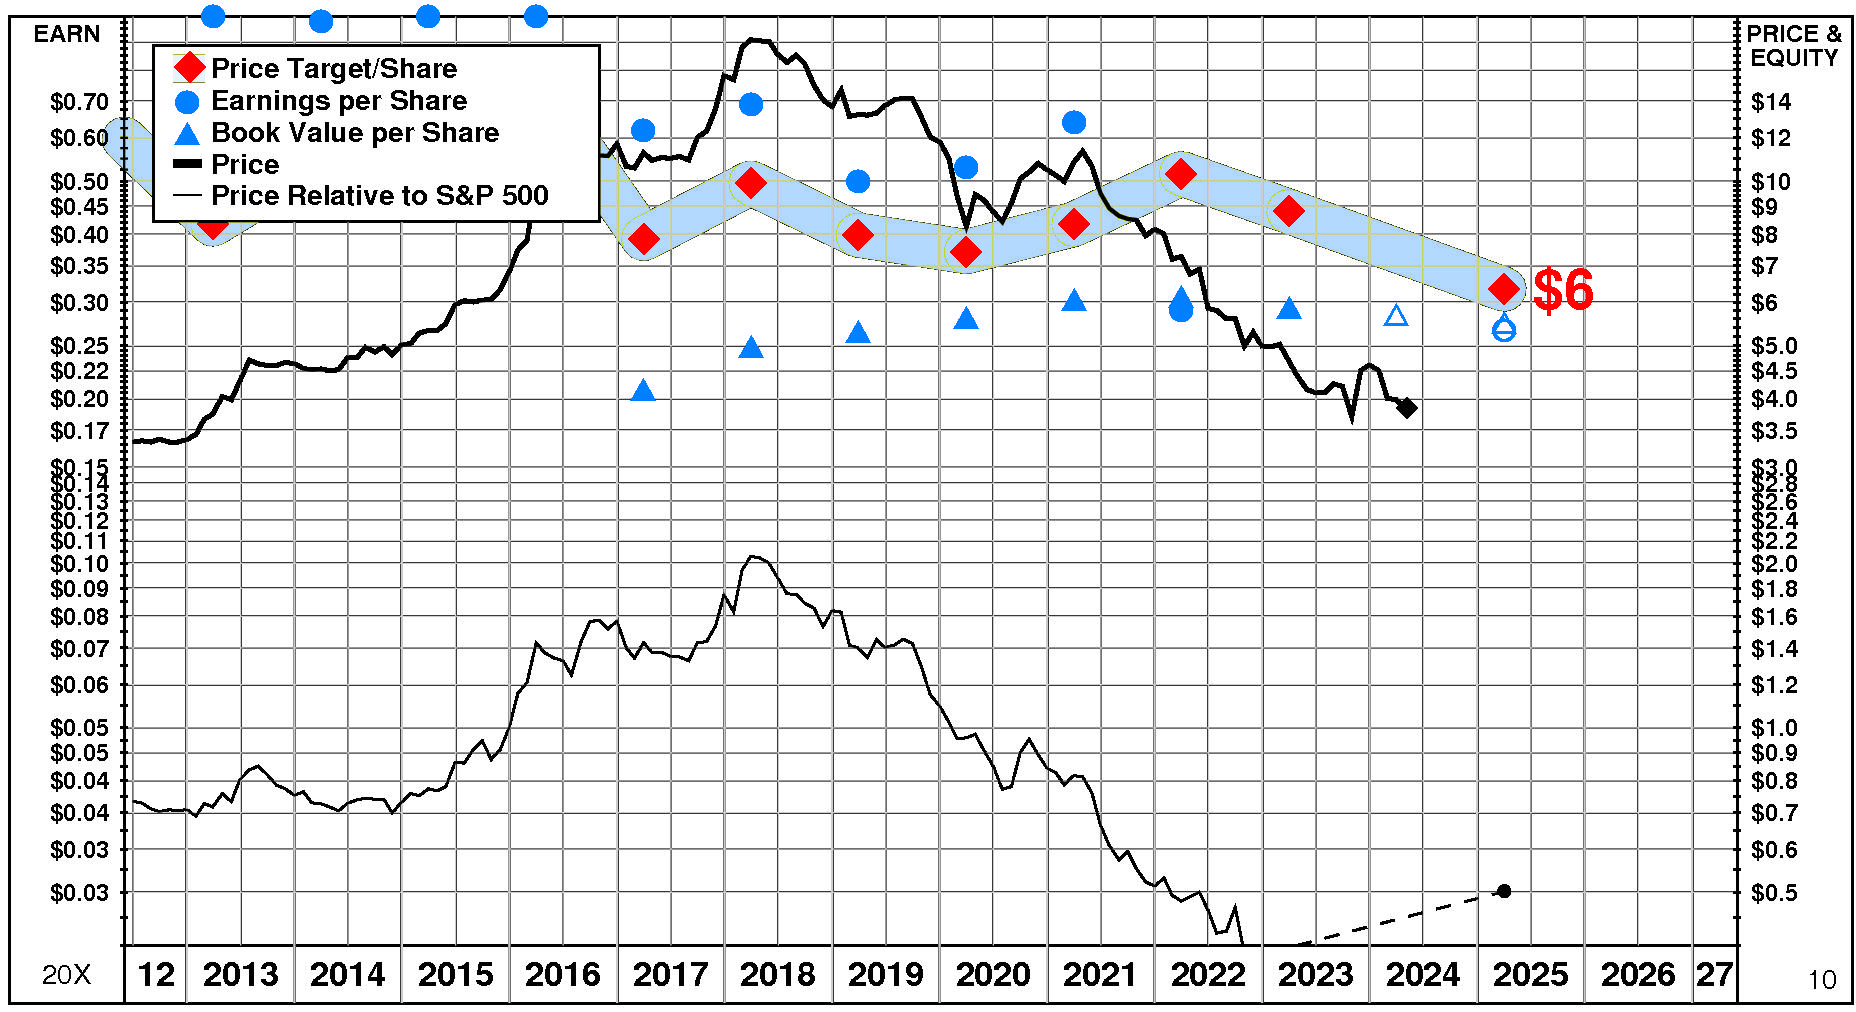
Andrew Peller’s current Price Target is $6 (-28% from the 2023 Target of $9 but +65% from the 04/30/24 price of $3.84). This dramatic fall in the Target is the result of a -11% decrease in the equity base and a -19% decrease in the price/equity multiple. The forecasted decline in return on equity has a very large negative impact on the price/equity multiple and the forecasted decline in growth has a large negative impact as well. Partially offsetting these Drivers, the forecasted decline in cost of equity has a very large positive impact.
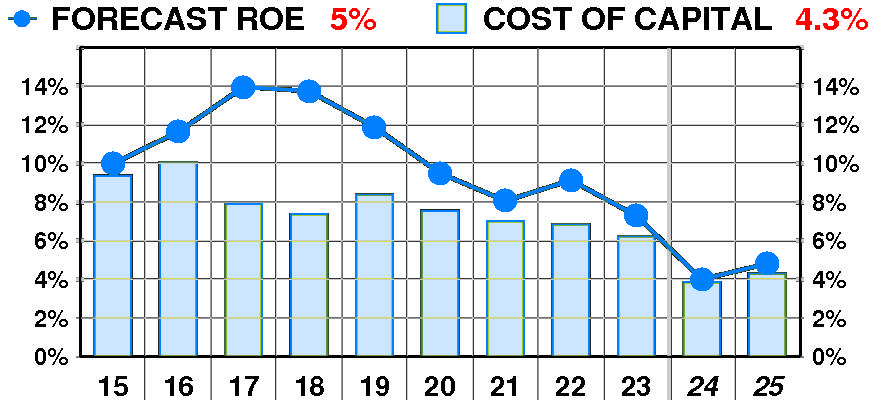
PTR’s return on equity forecast is 4.8% — slightly below our recent forecasts. Forecasted return on equity suffered a dramatic, erratic decline between 2015 and 2023. The current forecast is well below the 2017 peak of 14%.
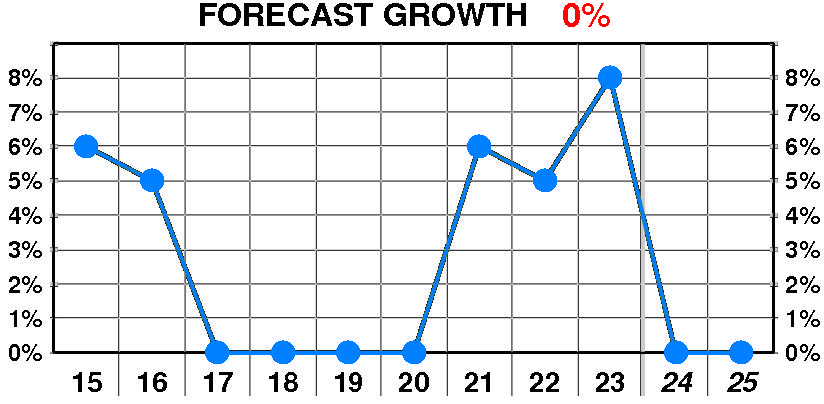
PTR’s growth forecast is 0.0% — below our recent forecasts. Forecasted growth enjoyed a dramatic, erratic increase between 2015 and 2023. The current forecast is well below the 2015 peak of 6%.
PTR’s cost of equity forecast is 4.3% — in line with recent levels. Forecasted cost of equity enjoyed a dramatic, steady decline between 2015 and 2023. The current forecast is well below the 2016 peak of 10.0%.
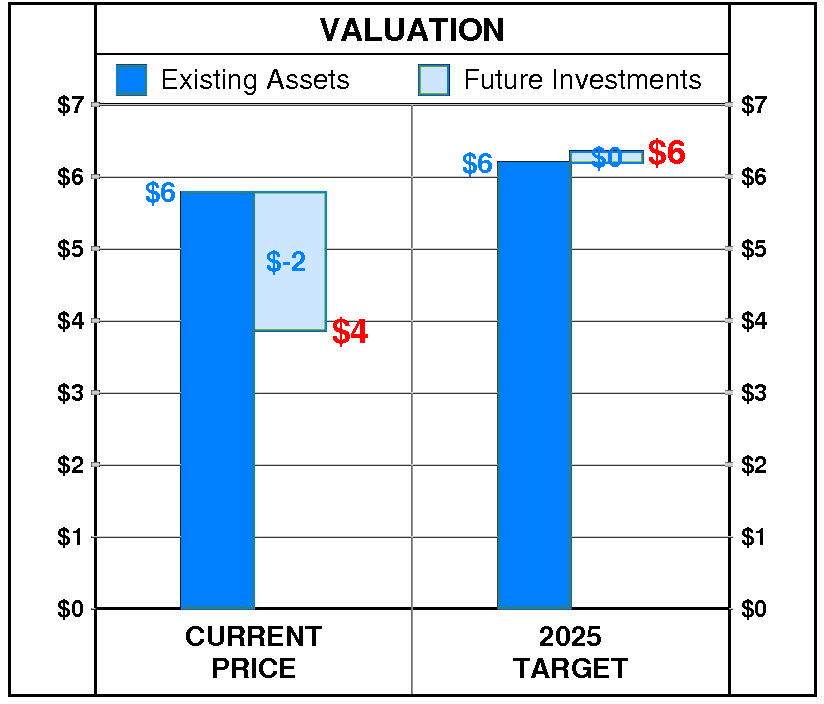
At Andrew Peller’s current price of $3.84, investors are placing a negative value of $-2 on its future investments. This view is not supported by the company’s most recent performance that reflected a growth rate of 8.0% per year, and a return on equity of 7.3% versus a cost of equity of 6.2%.
PTR’s 2025 Price Target of $6 is based on these forecasts and reflects an estimated value of existing assets of $6 and a value of future investments of $0.
Be the first to comment