![]()
BUSINESS
Adobe Inc. operates as a diversified software company worldwide. It operates through three segments: Digital Media, Digital Experience, and Publishing and Advertising. The Digital Media segment offers products, services, and solutions that enable individuals, teams, and enterprises to create, publish, and promote content; and Document Cloud, a unified cloud-based document services platform. Its flagship product is Creative Cloud, a subscription service that allows members to access its creative products. This segment serves content creators, workers, marketers, educators, enthusiasts, communicators, and consumers. The Digital Experience segment provides an integrated platform and set of applications and services that enable brands and businesses to create, manage, execute, measure, monetize, and optimize customer experiences from analytics to commerce.
INVESTMENT RATING
Reflecting future returns on capital that are forecasted to be above the cost of capital, ADBE is expected to continue to be a major Value Builder.
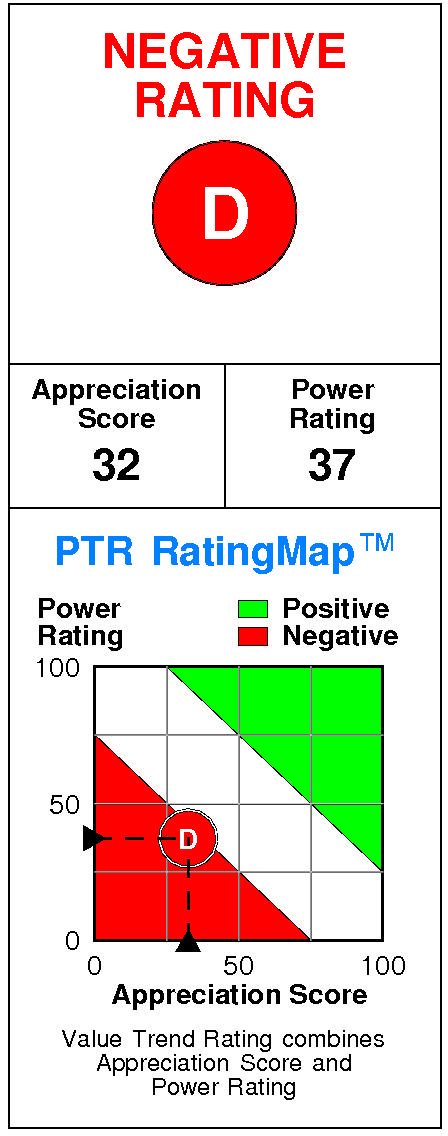
Adobe has a current Value Trend Rating of D (Negative).
This rating combines highly consistent signals from two proprietary PTR measures of a stock’s attractiveness. Adobe has a slightly negative Power Rating of 37 and a slightly negative Appreciation Score of 32, and the Negative Value Trend Rating results.
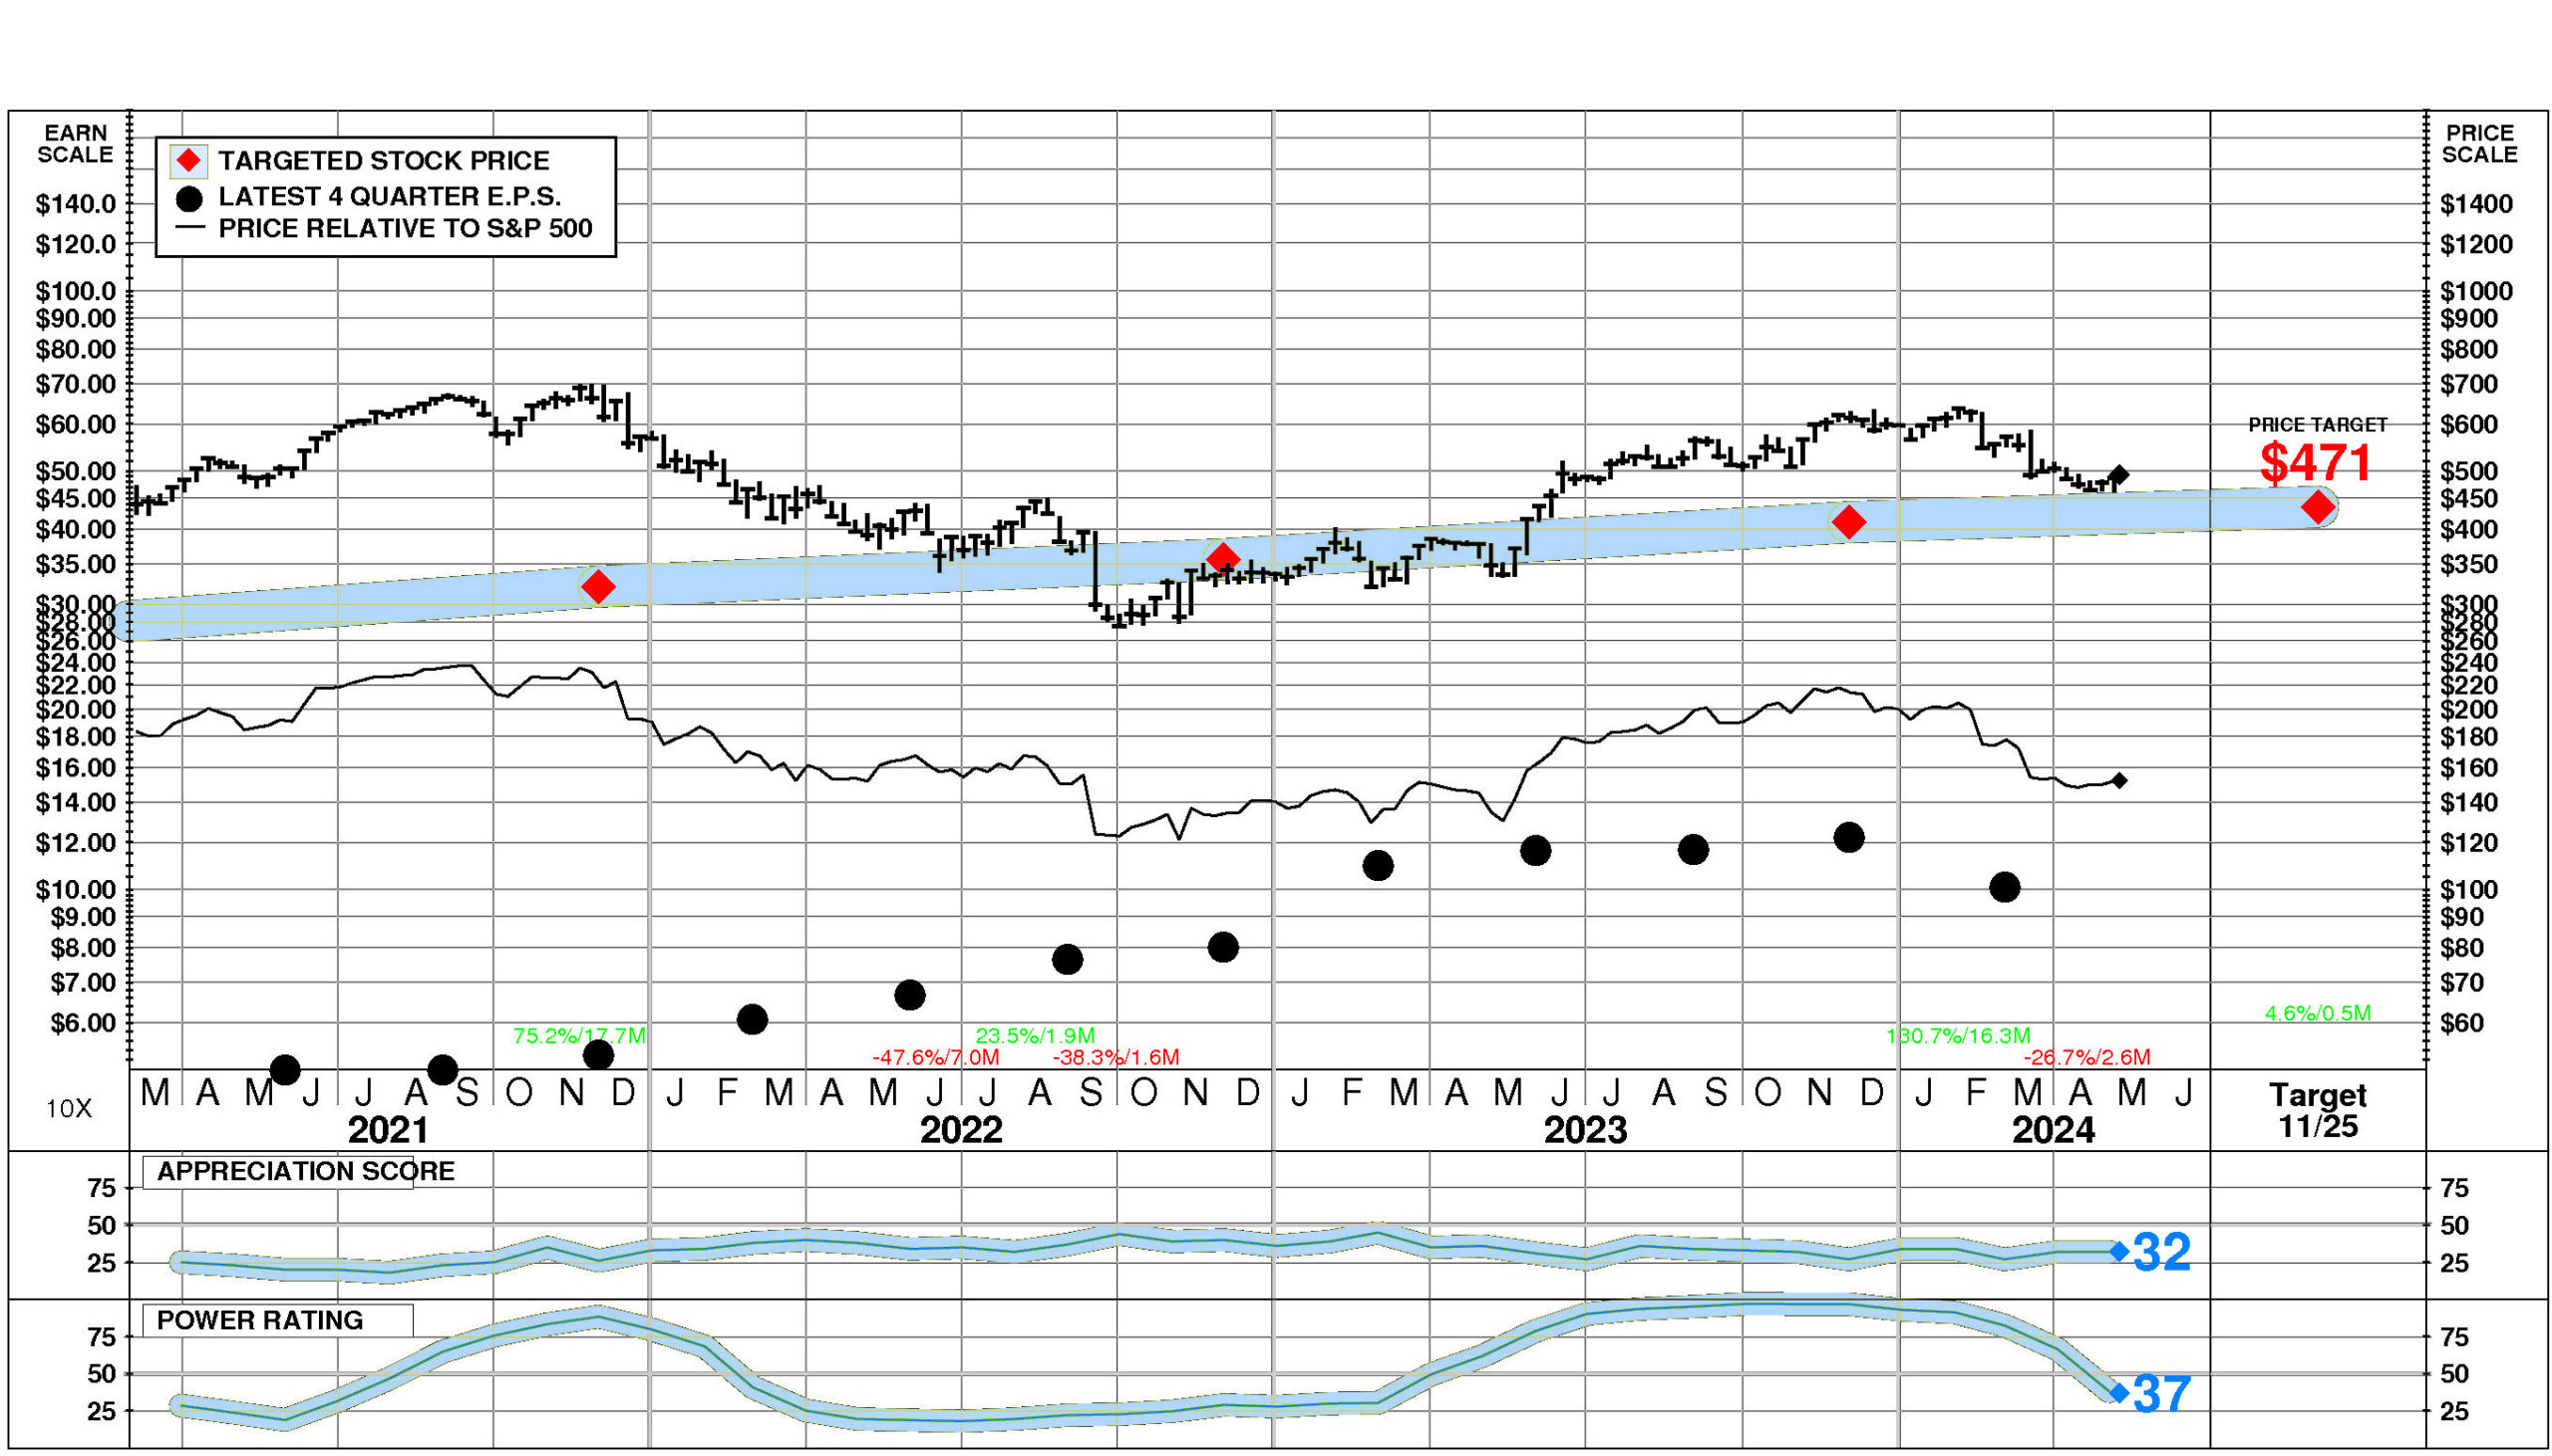
Adobe’s stock is selling above targeted value. The current stock price of $493.59 compares to targeted value 12 months forward of $436.
This moderately low appreciation potential results in an appreciation score of 32 (68% of the universe has greater appreciation potential.)
Adobe has a Power Rating of 37. (This slightly negative Power Rating indicates that Adobe’s chances of enjoying favorable investment performance over the near to intermediate term are only average.)
Factors contributing to this slightly negative Power Rating include: recent price action has been slightly unfavorable; and the Computer Programming, Data Processing comparison group is in a slightly weakened position currently. An offsetting factor is earnings estimate behavior for Adobe has been slightly favorable recently.
INVESTMENT PROFILE
Adobe’s financial strength is exceptional. Financial strength rating is 100.
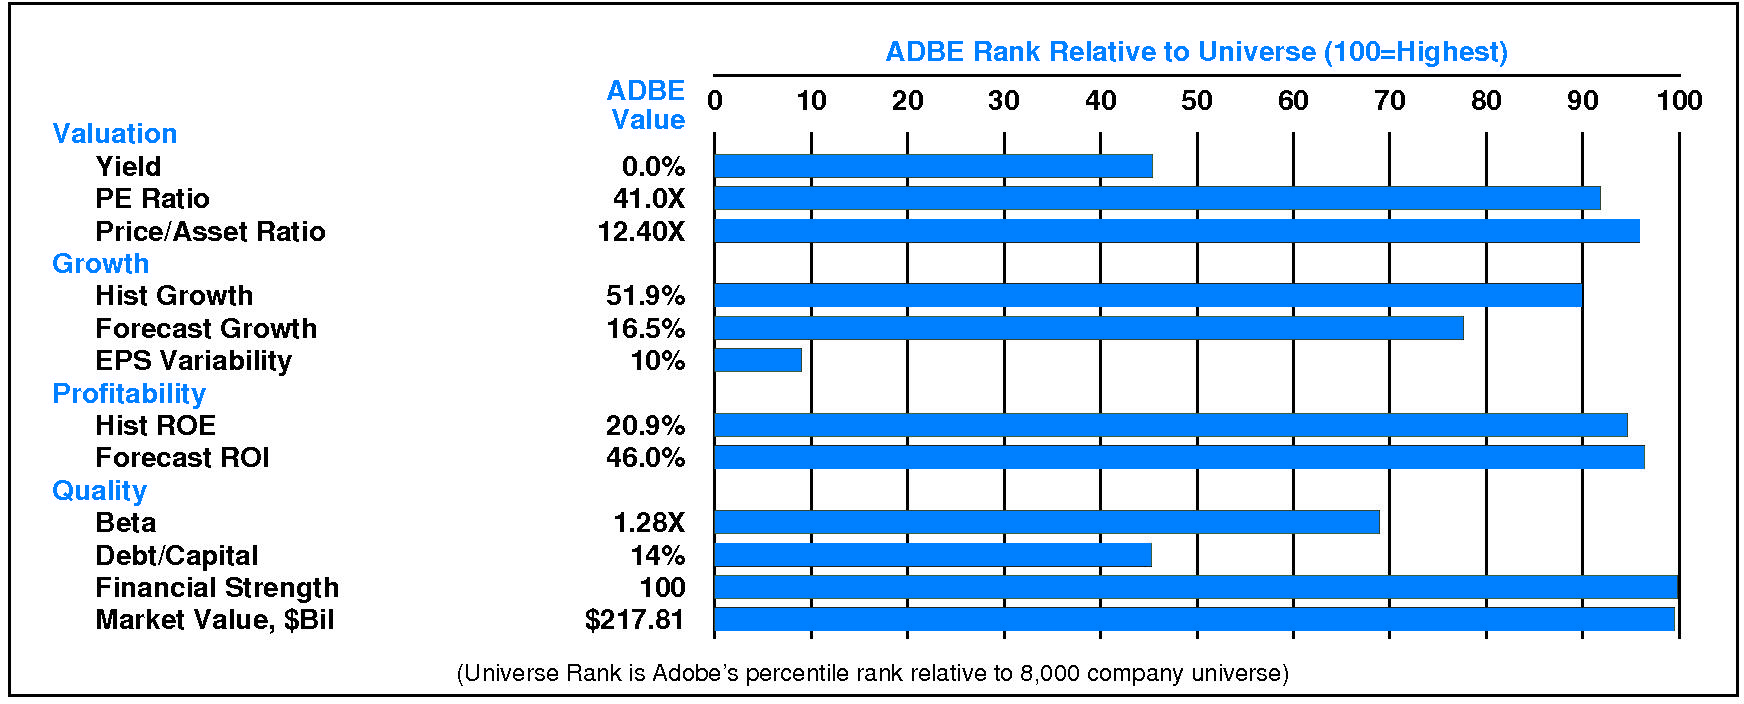
Relative to the S&P 500 Composite, Adobe Inc has significant Growth characteristics; its appeal is likely to be to Capital Gain-oriented investors; the perception is that ADBE is lower risk. High stock price volatility is a relative weakness for Adobe. Adobe’s valuation is high: low dividend yield, high P/E ratio, and high price/book ratio. ADBE has unusually high market capitalization.
CURRENT SIGNALS
Adobe’s current operations are eroding. Return on equity is falling, reflecting: declining pretax margin; falling tax keep rate; and falling leverage.
Adobe’s current technical position is very weak. The stock price is in a 2.6 month down move. The stock has declined 21.1% from its prior high. The stock price is below its 200 day moving average which is in a downtrend.
ALERTS
Marginal negative changes in Adobe Inc (NASDAQ: ADBE) fundamentals have recently occurred: the stock’s power rating fell below 50.
The stock is currently rated D.
Adobe Inc (NASDAQ: ADBE) stock closed at $493.59 on 5/6/24 after an increase of 1.5%. However, unusually low trading volume at 57% of normal accompanied the advance. The stock has risen 3.4% during the last week but has been weak relative to the market over the last nine months.
CASH FLOW
In 2023, Adobe generated a very significant increase in cash of +$1,746 million (+29%). Sources of cash were much larger than uses. Cash generated from 2023 EBITDA totaled +$7,420 million. Non-operating sources contributed +$102 million (+1% of EBITDA). Cash taxes consumed -$1,384 million (-19% of EBITDA). Re-investment in the business amounted to -$765 million (-10% of EBITDA). On a net basis, debt investors removed -$666 million (-9% of EBITDA) while equity investors received -$2,961 million (-40% of EBITDA).

Adobe’s Non-operating Income, %EBITDA has exhibited little to no overall change over the period. This stability was accompanied by stability for the Adobe Peer Group as well. In most years, Adobe was in the second quartile and third quartile. Currently, Adobe is above median at +1% of EBITDA (+$102 million).
Adobe’s Cash Taxes, %EBITDA has exhibited a volatile overall uptrend over the period. This improvement was accompanied by a similar trend for the Adobe Peer Group. (Since 2020 Cash Taxes, %EBITDA has experienced a very sharp decline.) In most years, Adobe was in the top quartile and second quartile. Currently, Adobe is lower quartile at -19% of EBITDA (-$1,384 million).
Adobe’s Business Re-investment, %EBITDA has experienced a downtrend over the period. This downtrend was accompanied by a similar trend for the Adobe Peer Group. In most years, Adobe was in the top quartile and second quartile. Currently, Adobe is upper quartile at -10% of EBITDA (-$765 million).
Adobe’s Debt Investors, %EBITDA has experienced a downtrend over the period. This downtrend was accompanied by stability for the Adobe Peer Group. In most years, Adobe was in the third quartile and top quartile. Currently, Adobe is substantially below median at -9% of EBITDA (-$666 million).
Adobe’s Equity Investors, %EBITDA has suffered a strong overall downtrend over the period. This downtrend was accompanied by stability for the Adobe Peer Group. In most years, Adobe was in the third quartile and second quartile. Currently, Adobe is below median at -40% of EBITDA (-$2,961 million).
Adobe’s Change in Cash, %EBITDA has experienced a volatile overall downtrend over the period. This downtrend was accompanied by a similar trend for the Adobe Peer Group. (Since 2021 Change in Cash, %EBITDA has experienced a very sharp recovery.) In most years, Adobe was in the second quartile and top quartile. Currently, Adobe is at the upper quartile at +24% of EBITDA (+$1,746 million).
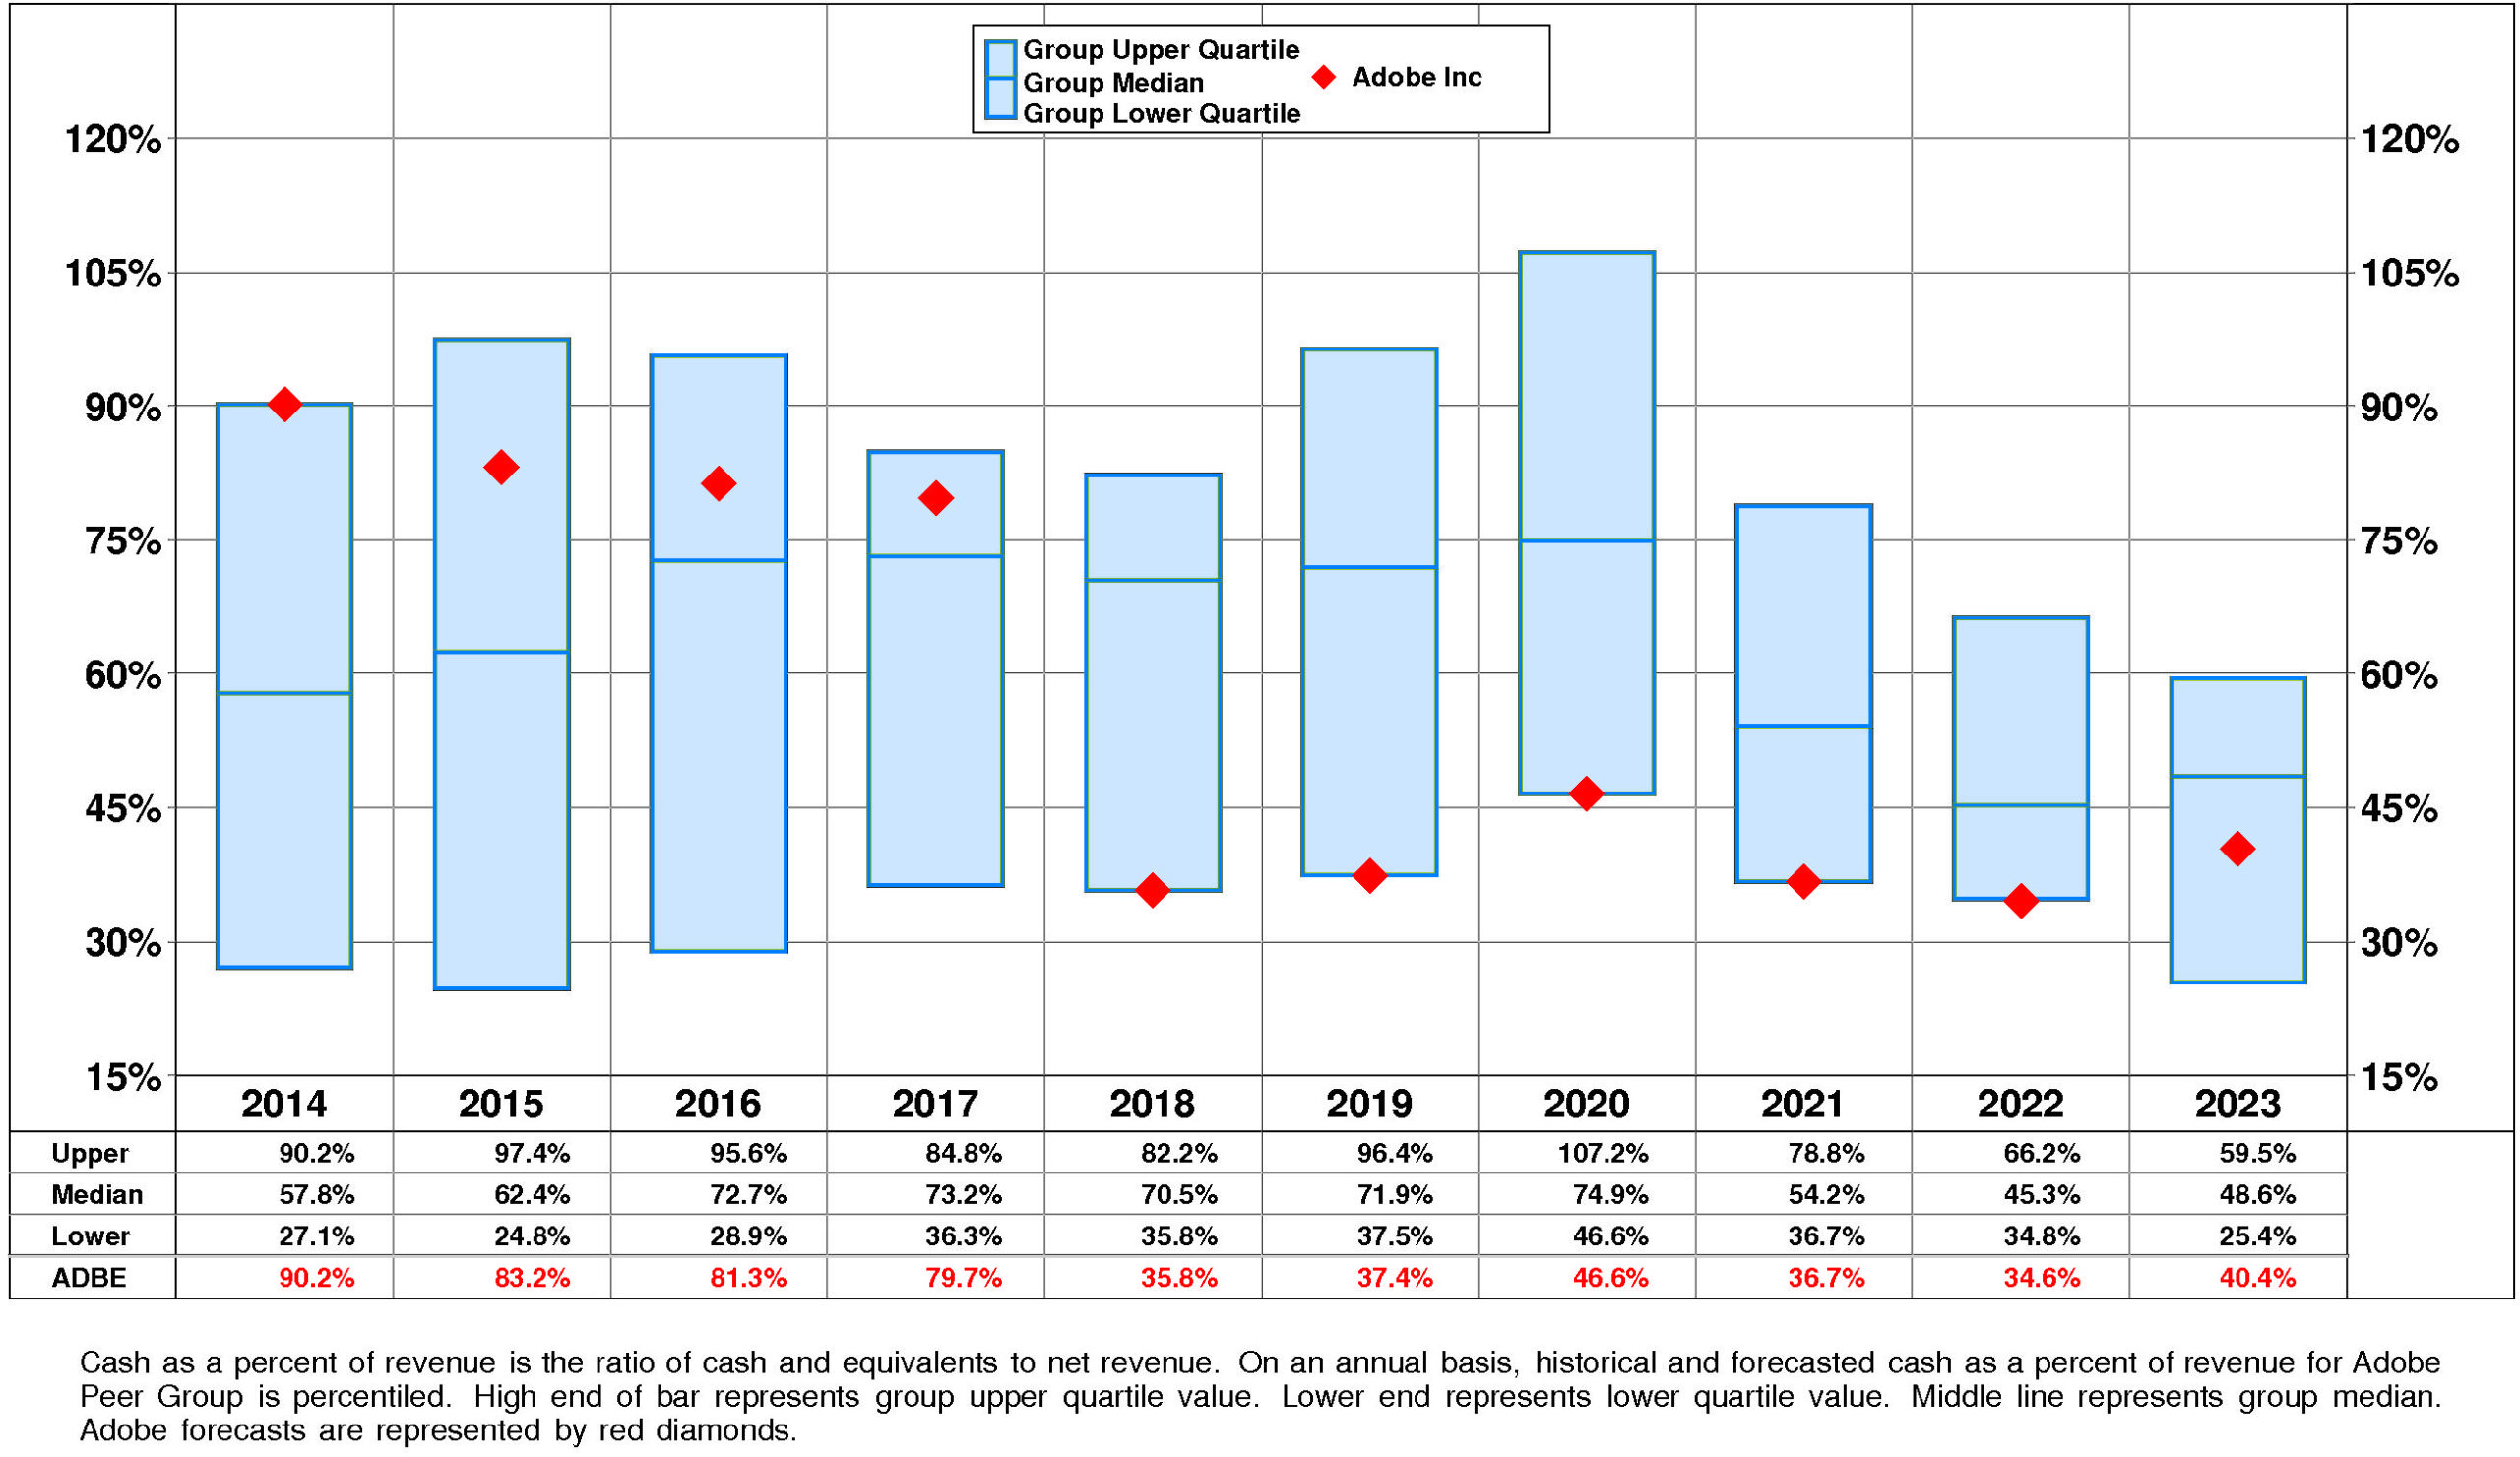
Adobe’s Cash, %Revenue has suffered a very strong overall downtrend over the period. This downtrend was accompanied by a similar trend for the Adobe Peer Group. (Since 2020 Cash, %Revenue has decelerated.) In most years, Adobe was in the third quartile and second quartile. Currently, Adobe is below median at +40%.
PROFITABILITY
Adobe’s return on equity has improved very significantly since 2014. The current level of 31.1% is 7.84X the low for the period and is -21.7% from the high.
This very significant improvement was due to very strong positive trend in pretax operating return and small positive trend in non-operating factors.
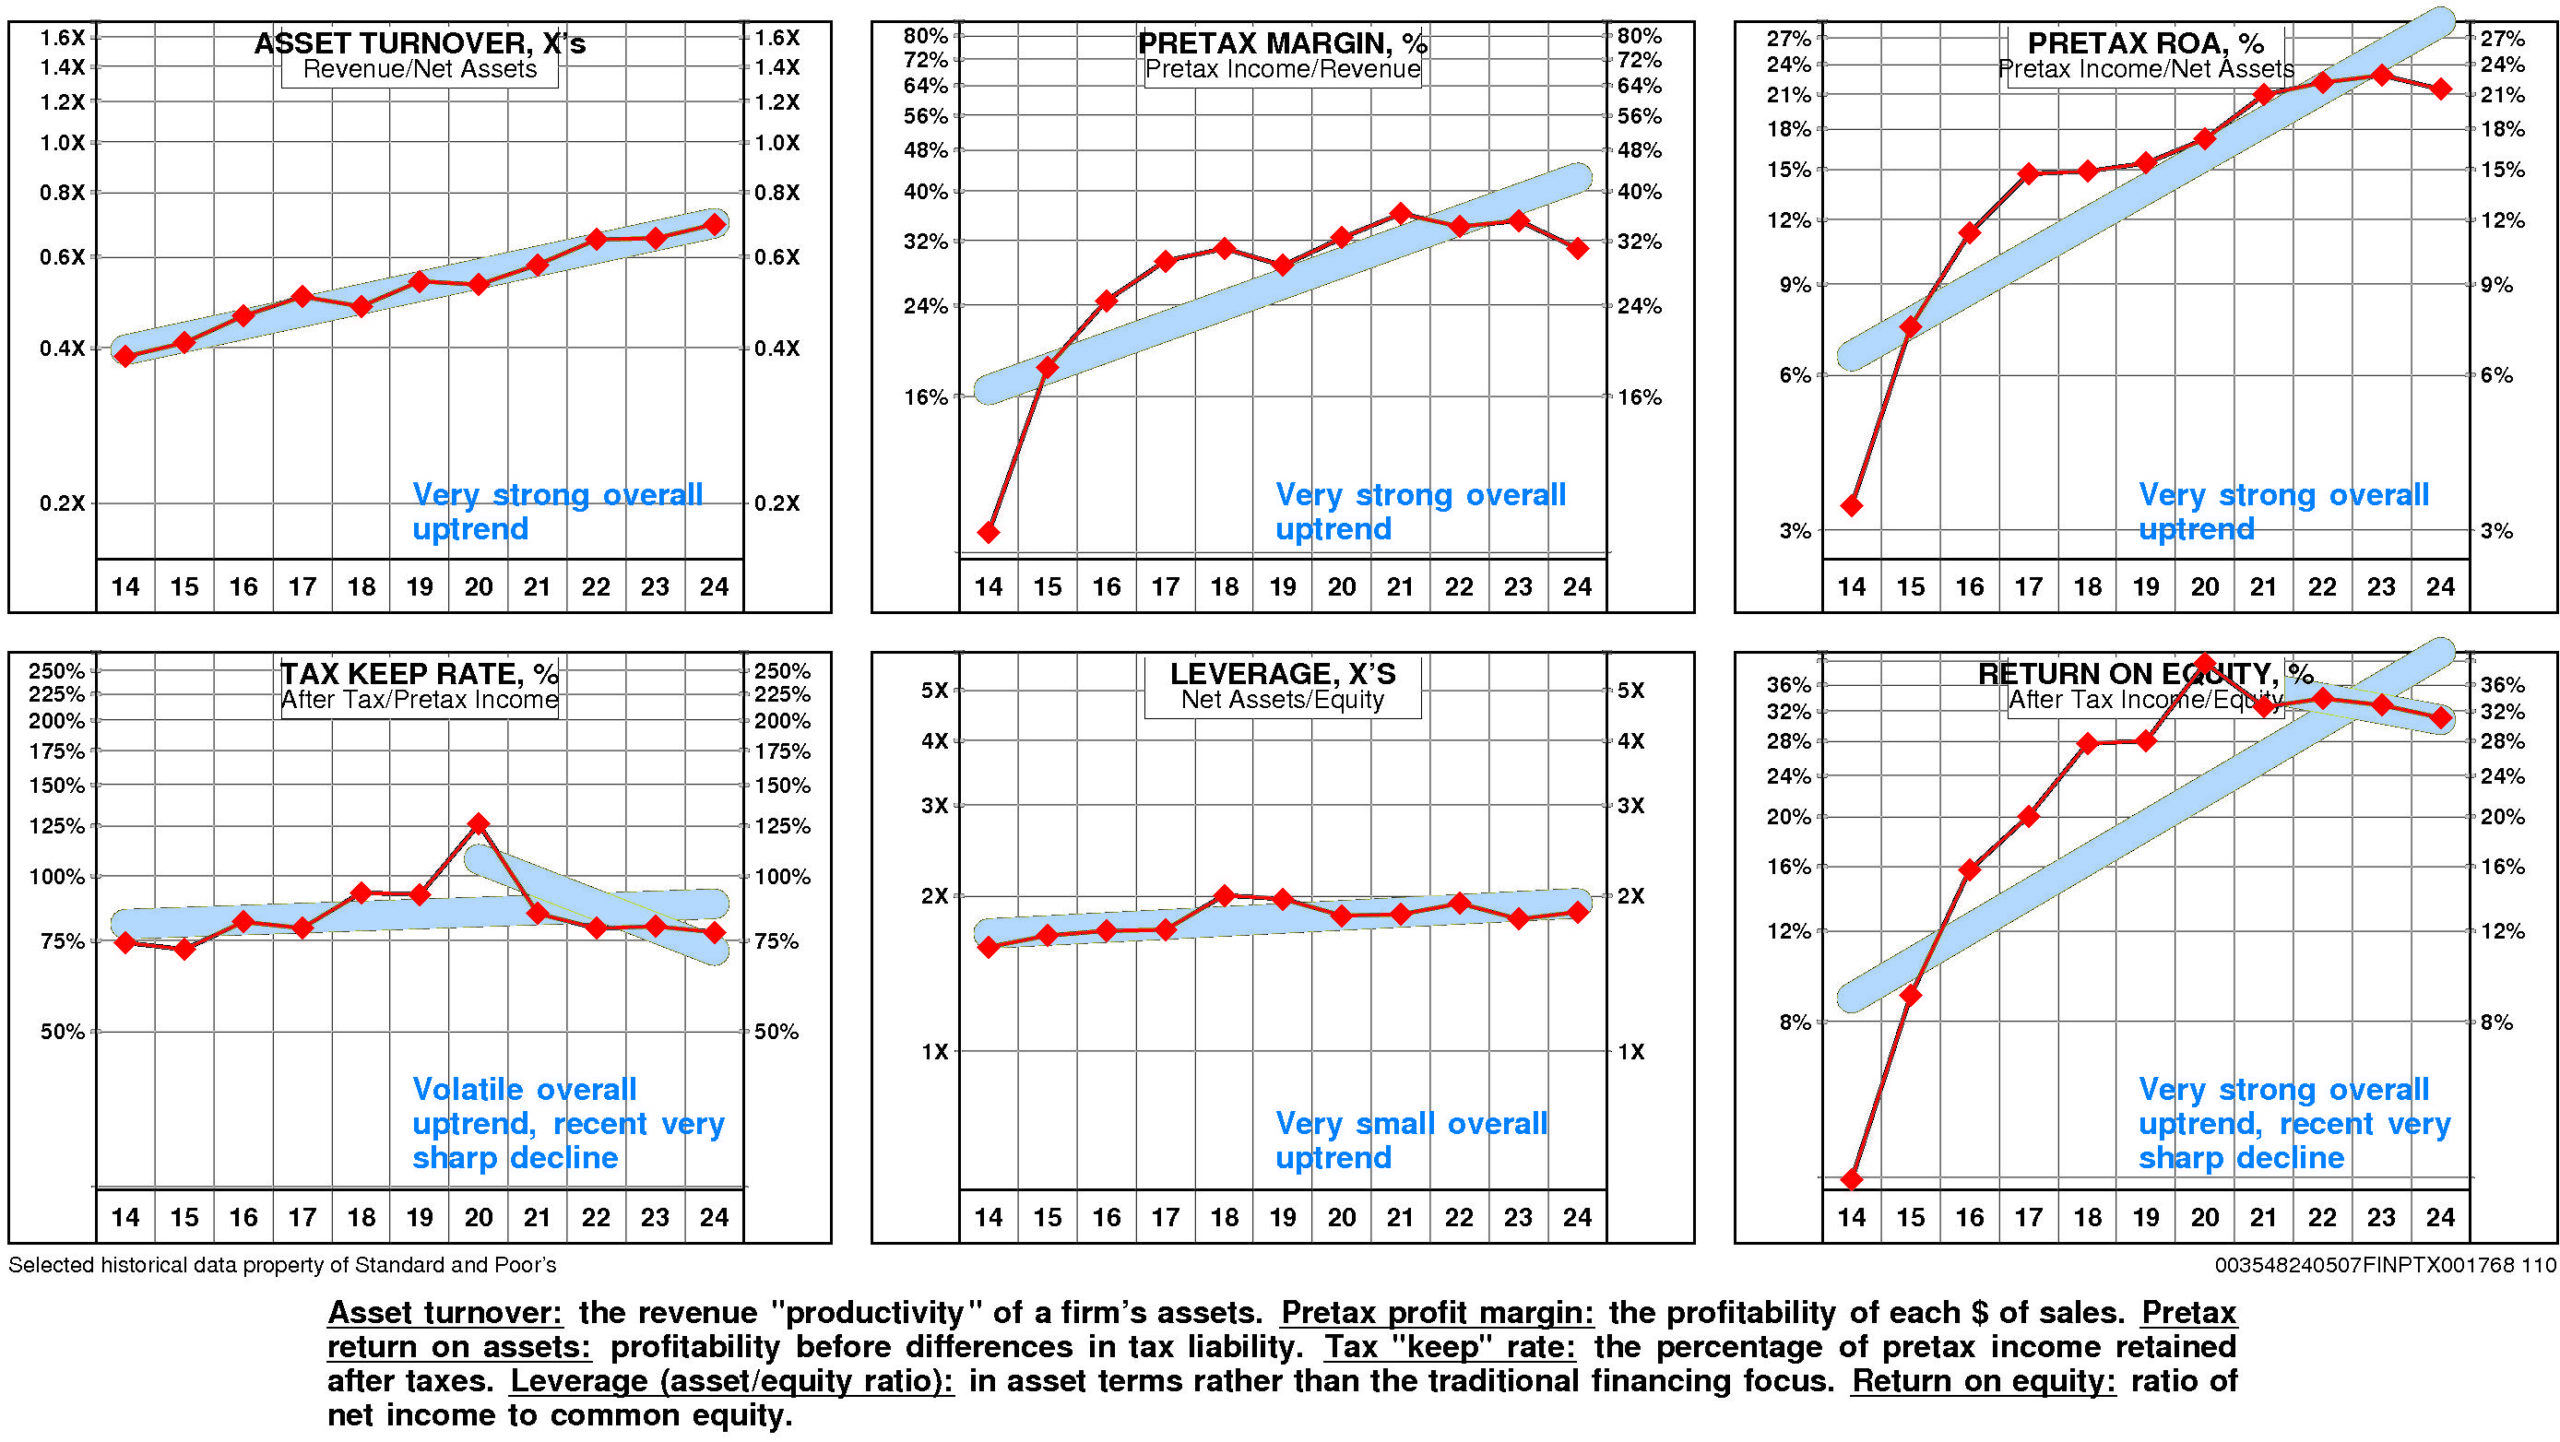
The productivity of Adobe’s assets rose over the full period 2014-2024: asset turnover has enjoyed a very strong overall uptrend.
Adobe’s pretax margin enjoyed a very strong overall uptrend over the period 2014-2024.
Non-operating factors (income taxes and financial leverage) had a minor positive influence on return on equity.
Adobe’s return on equity is at median (31.1%) for the four quarters ended February, 2024.
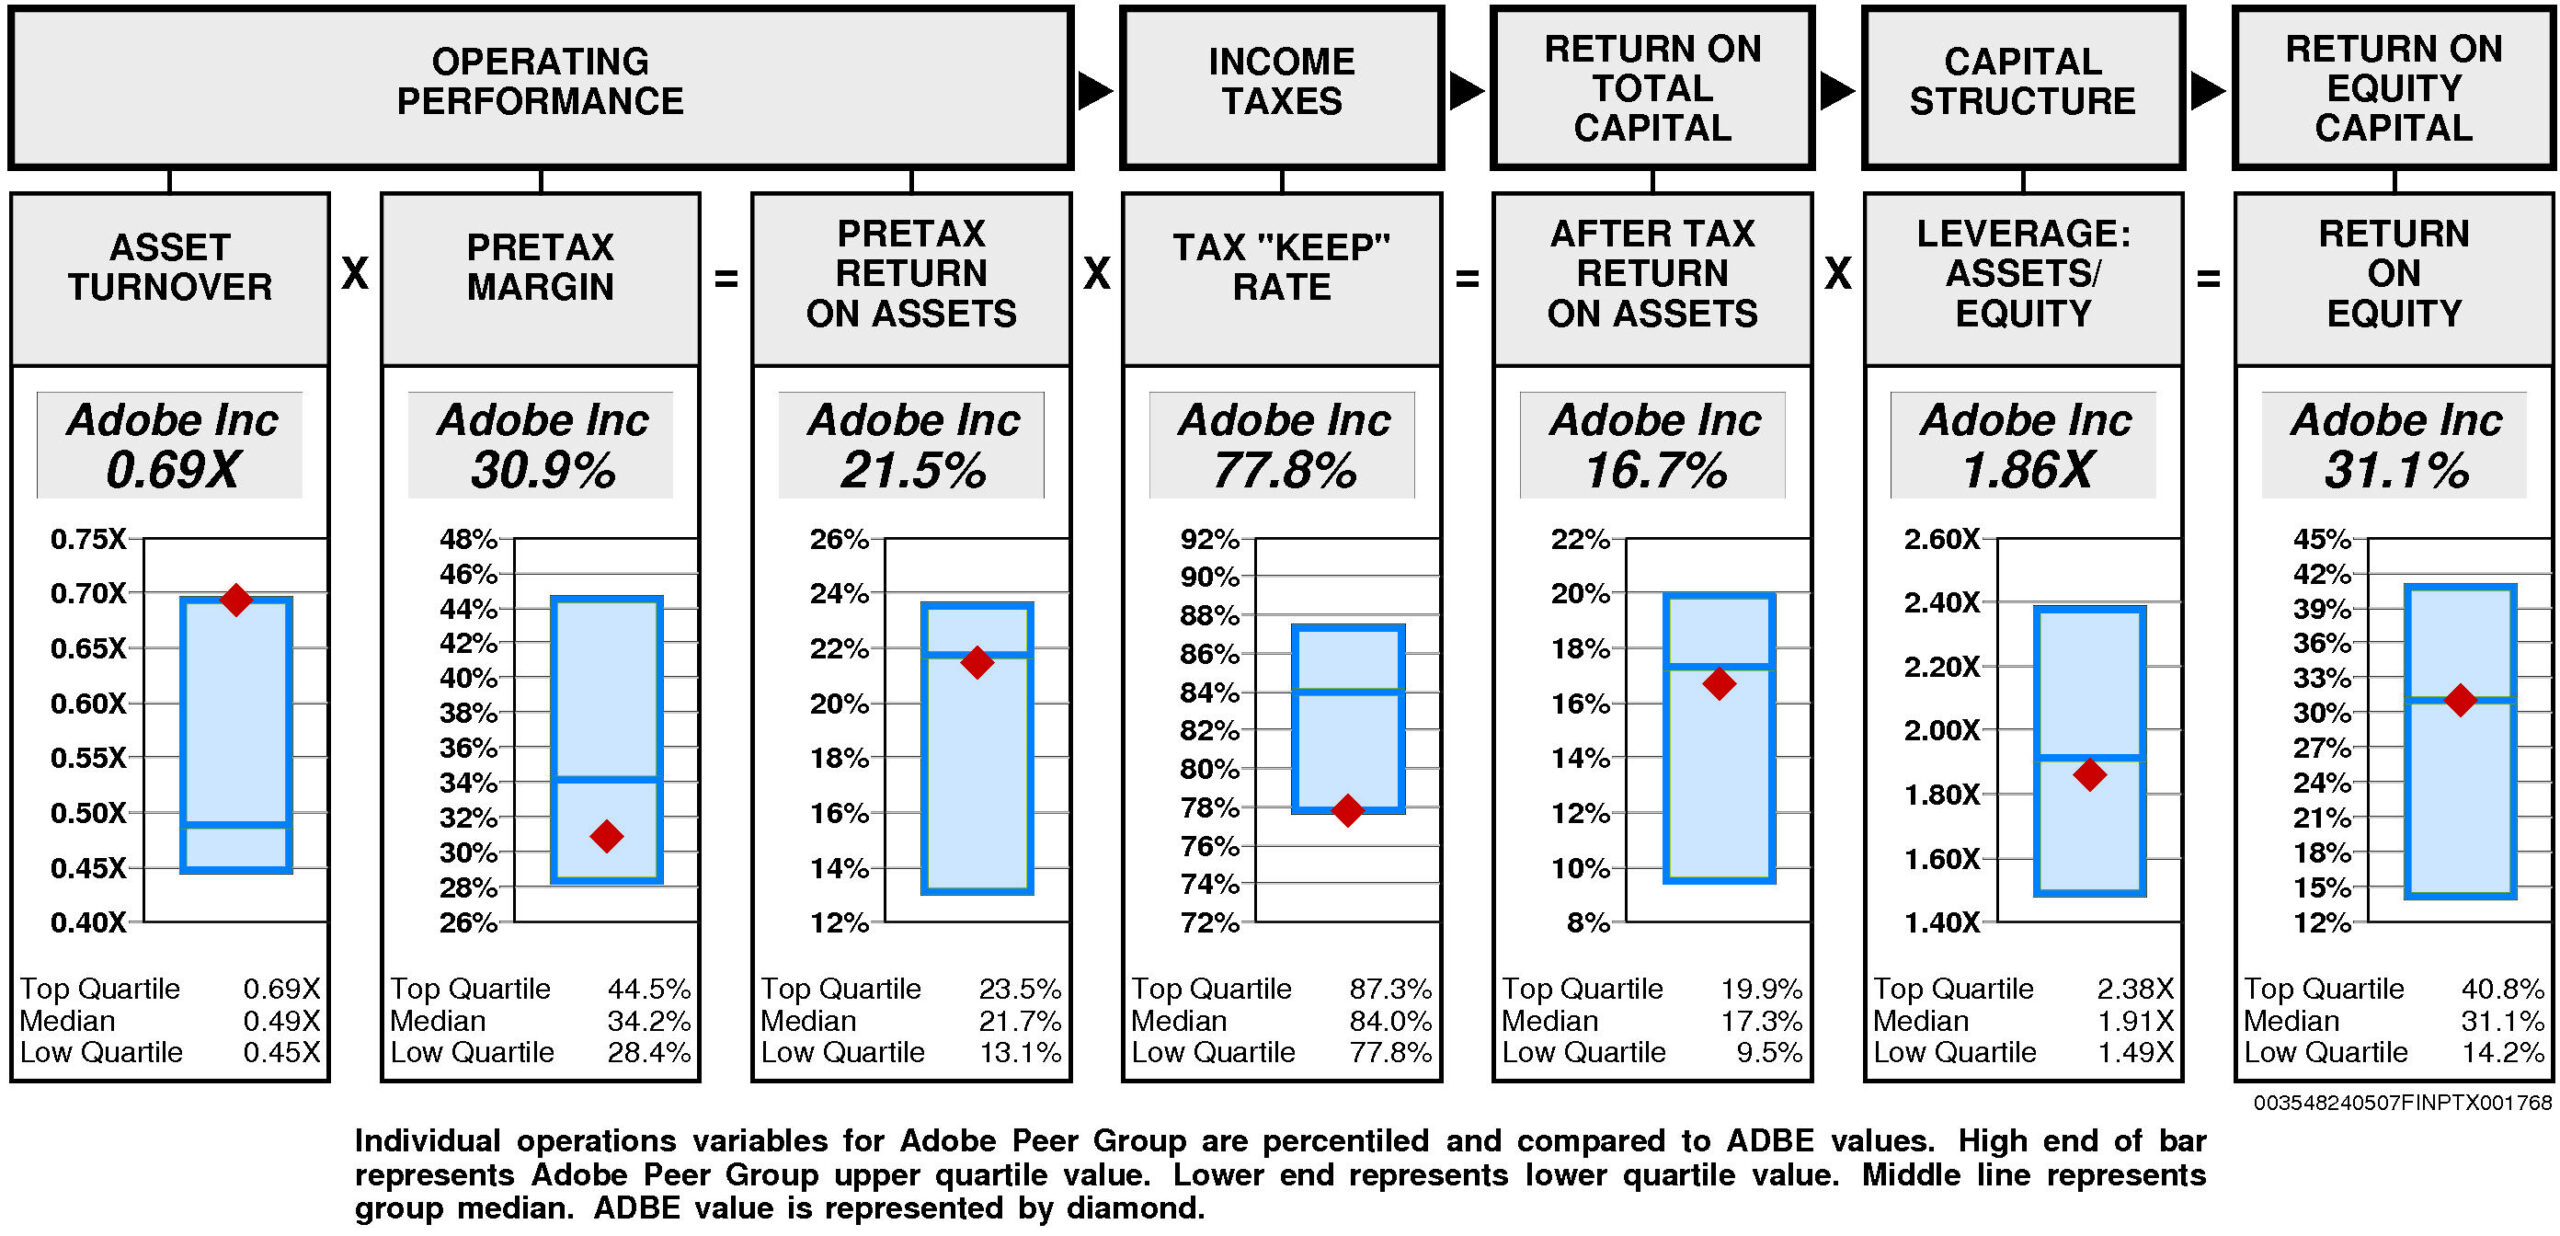
Operating performance (pretax return on assets) is at median (21.5%) reflecting asset turnover that is at the upper quartile (0.69X) and below median pretax margin (30.9%).
Tax “keep” rate (income tax management) is at the lower quartile (77.8%) resulting in after tax return on assets that is slightly below median.
Financial leverage (leverage) is slightly below median (1.86X).
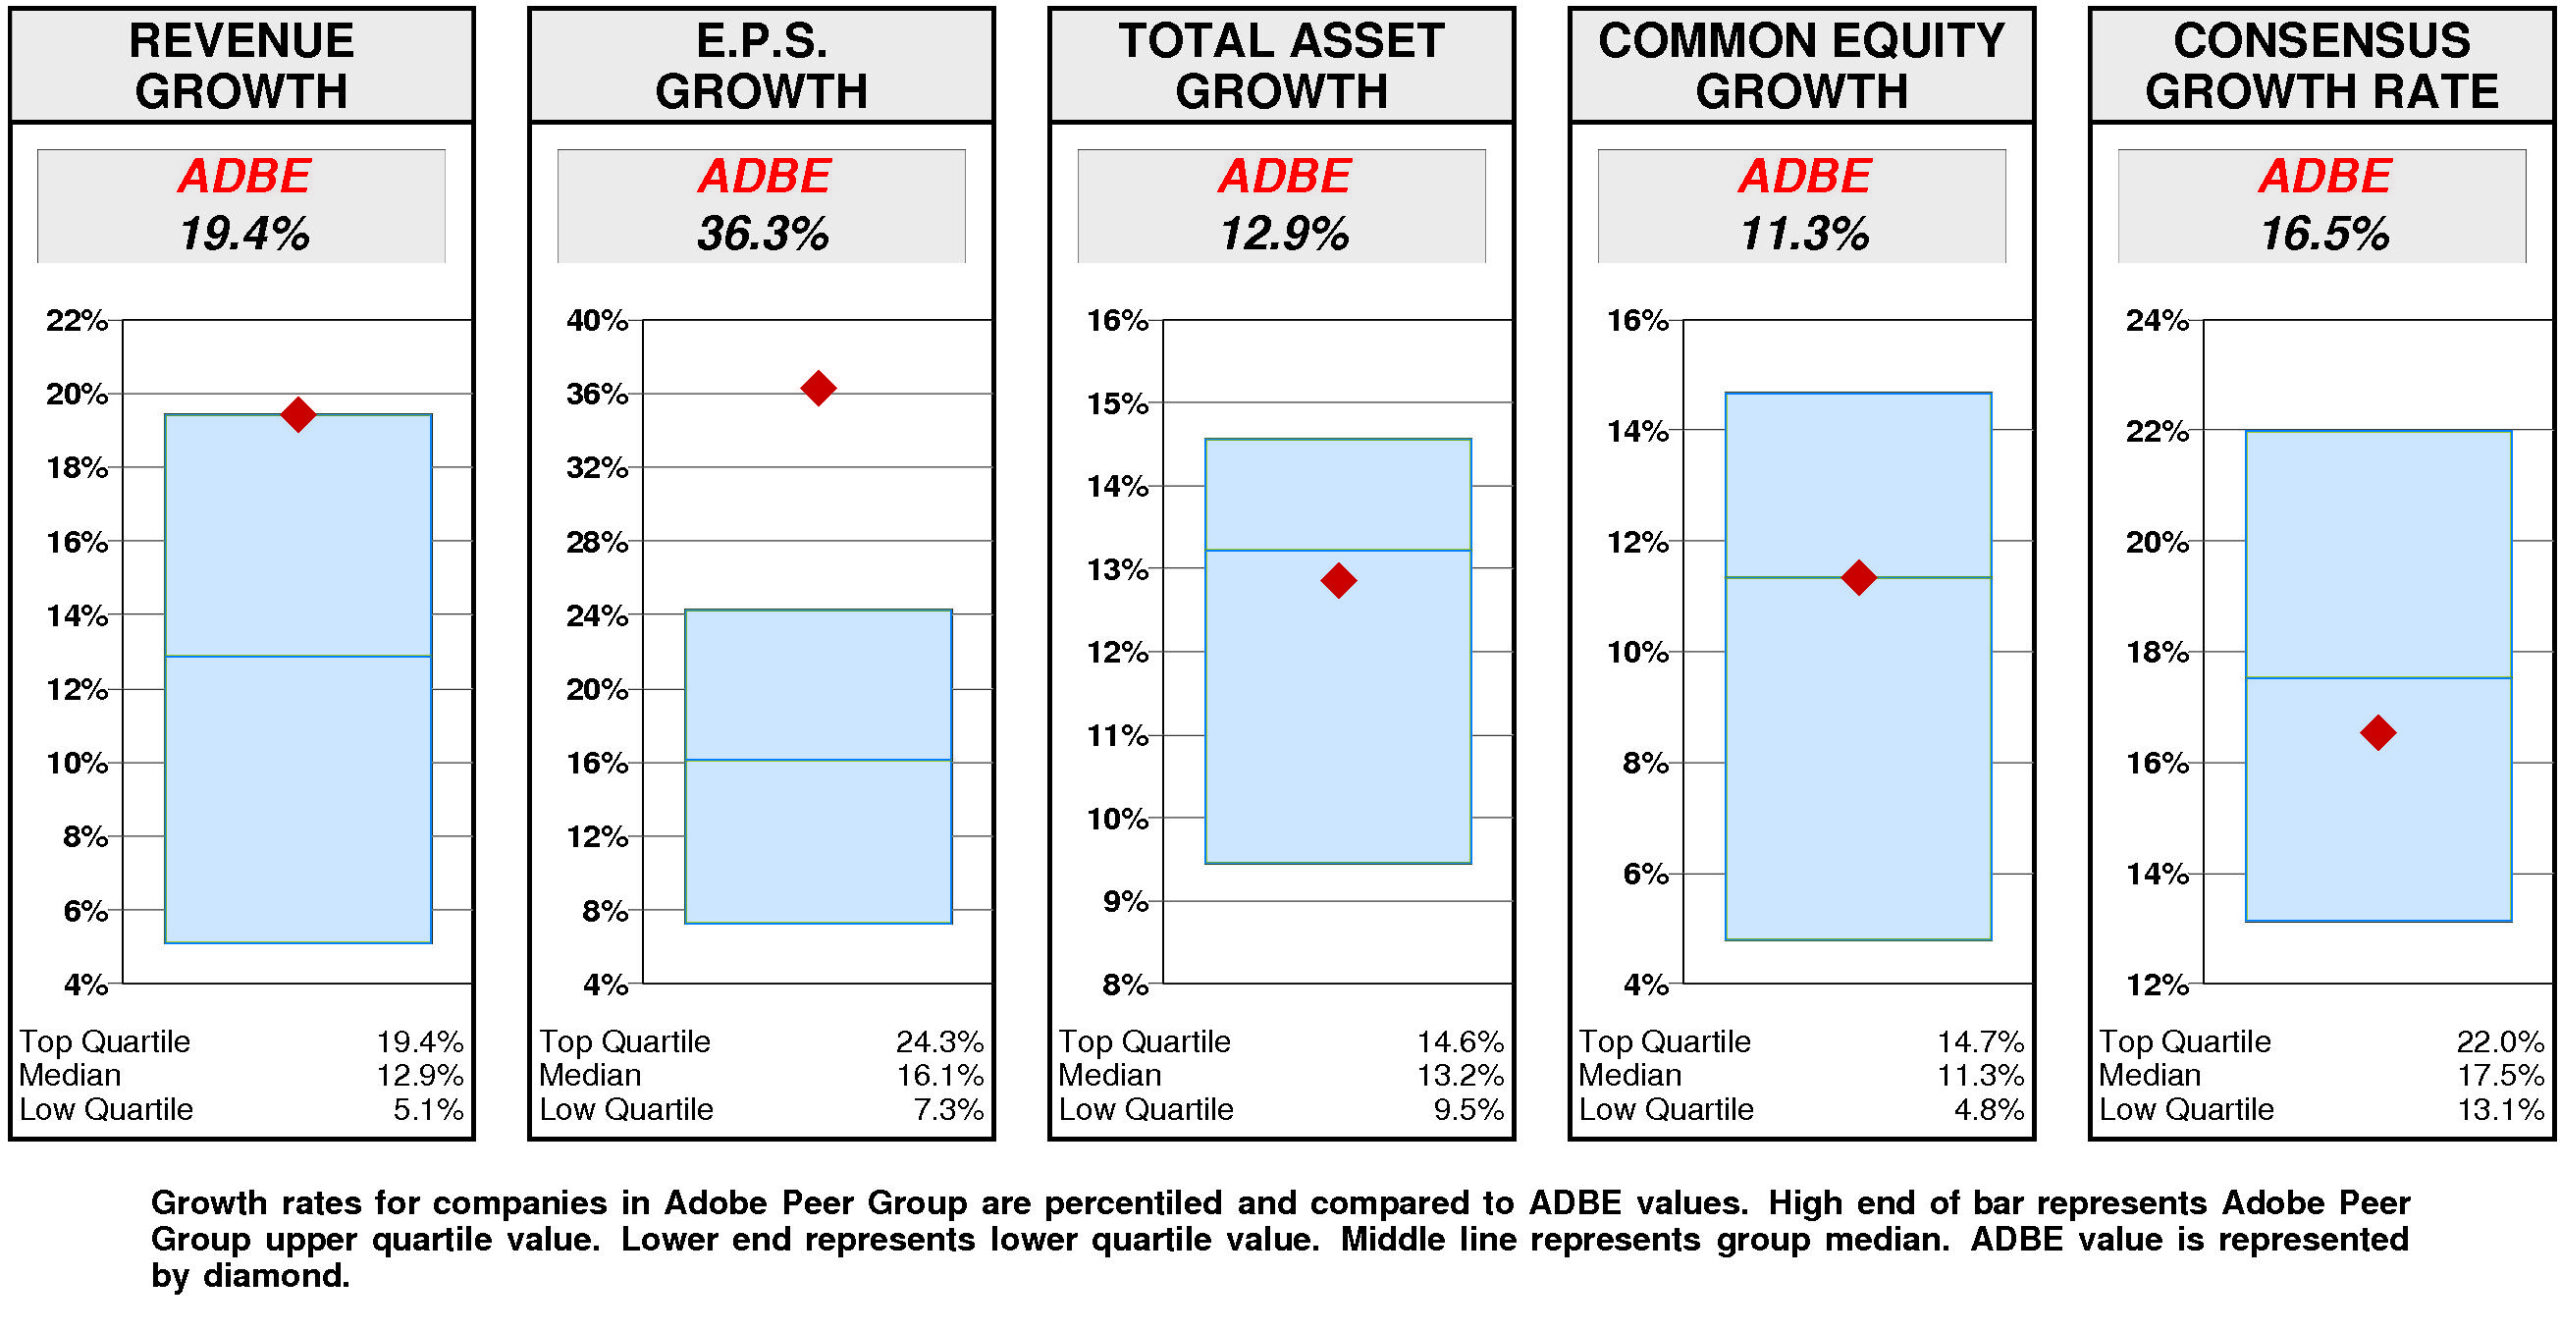
GROWTH RATES
There are no significant differences between Adobe’s longer term growth and growth in recent years.
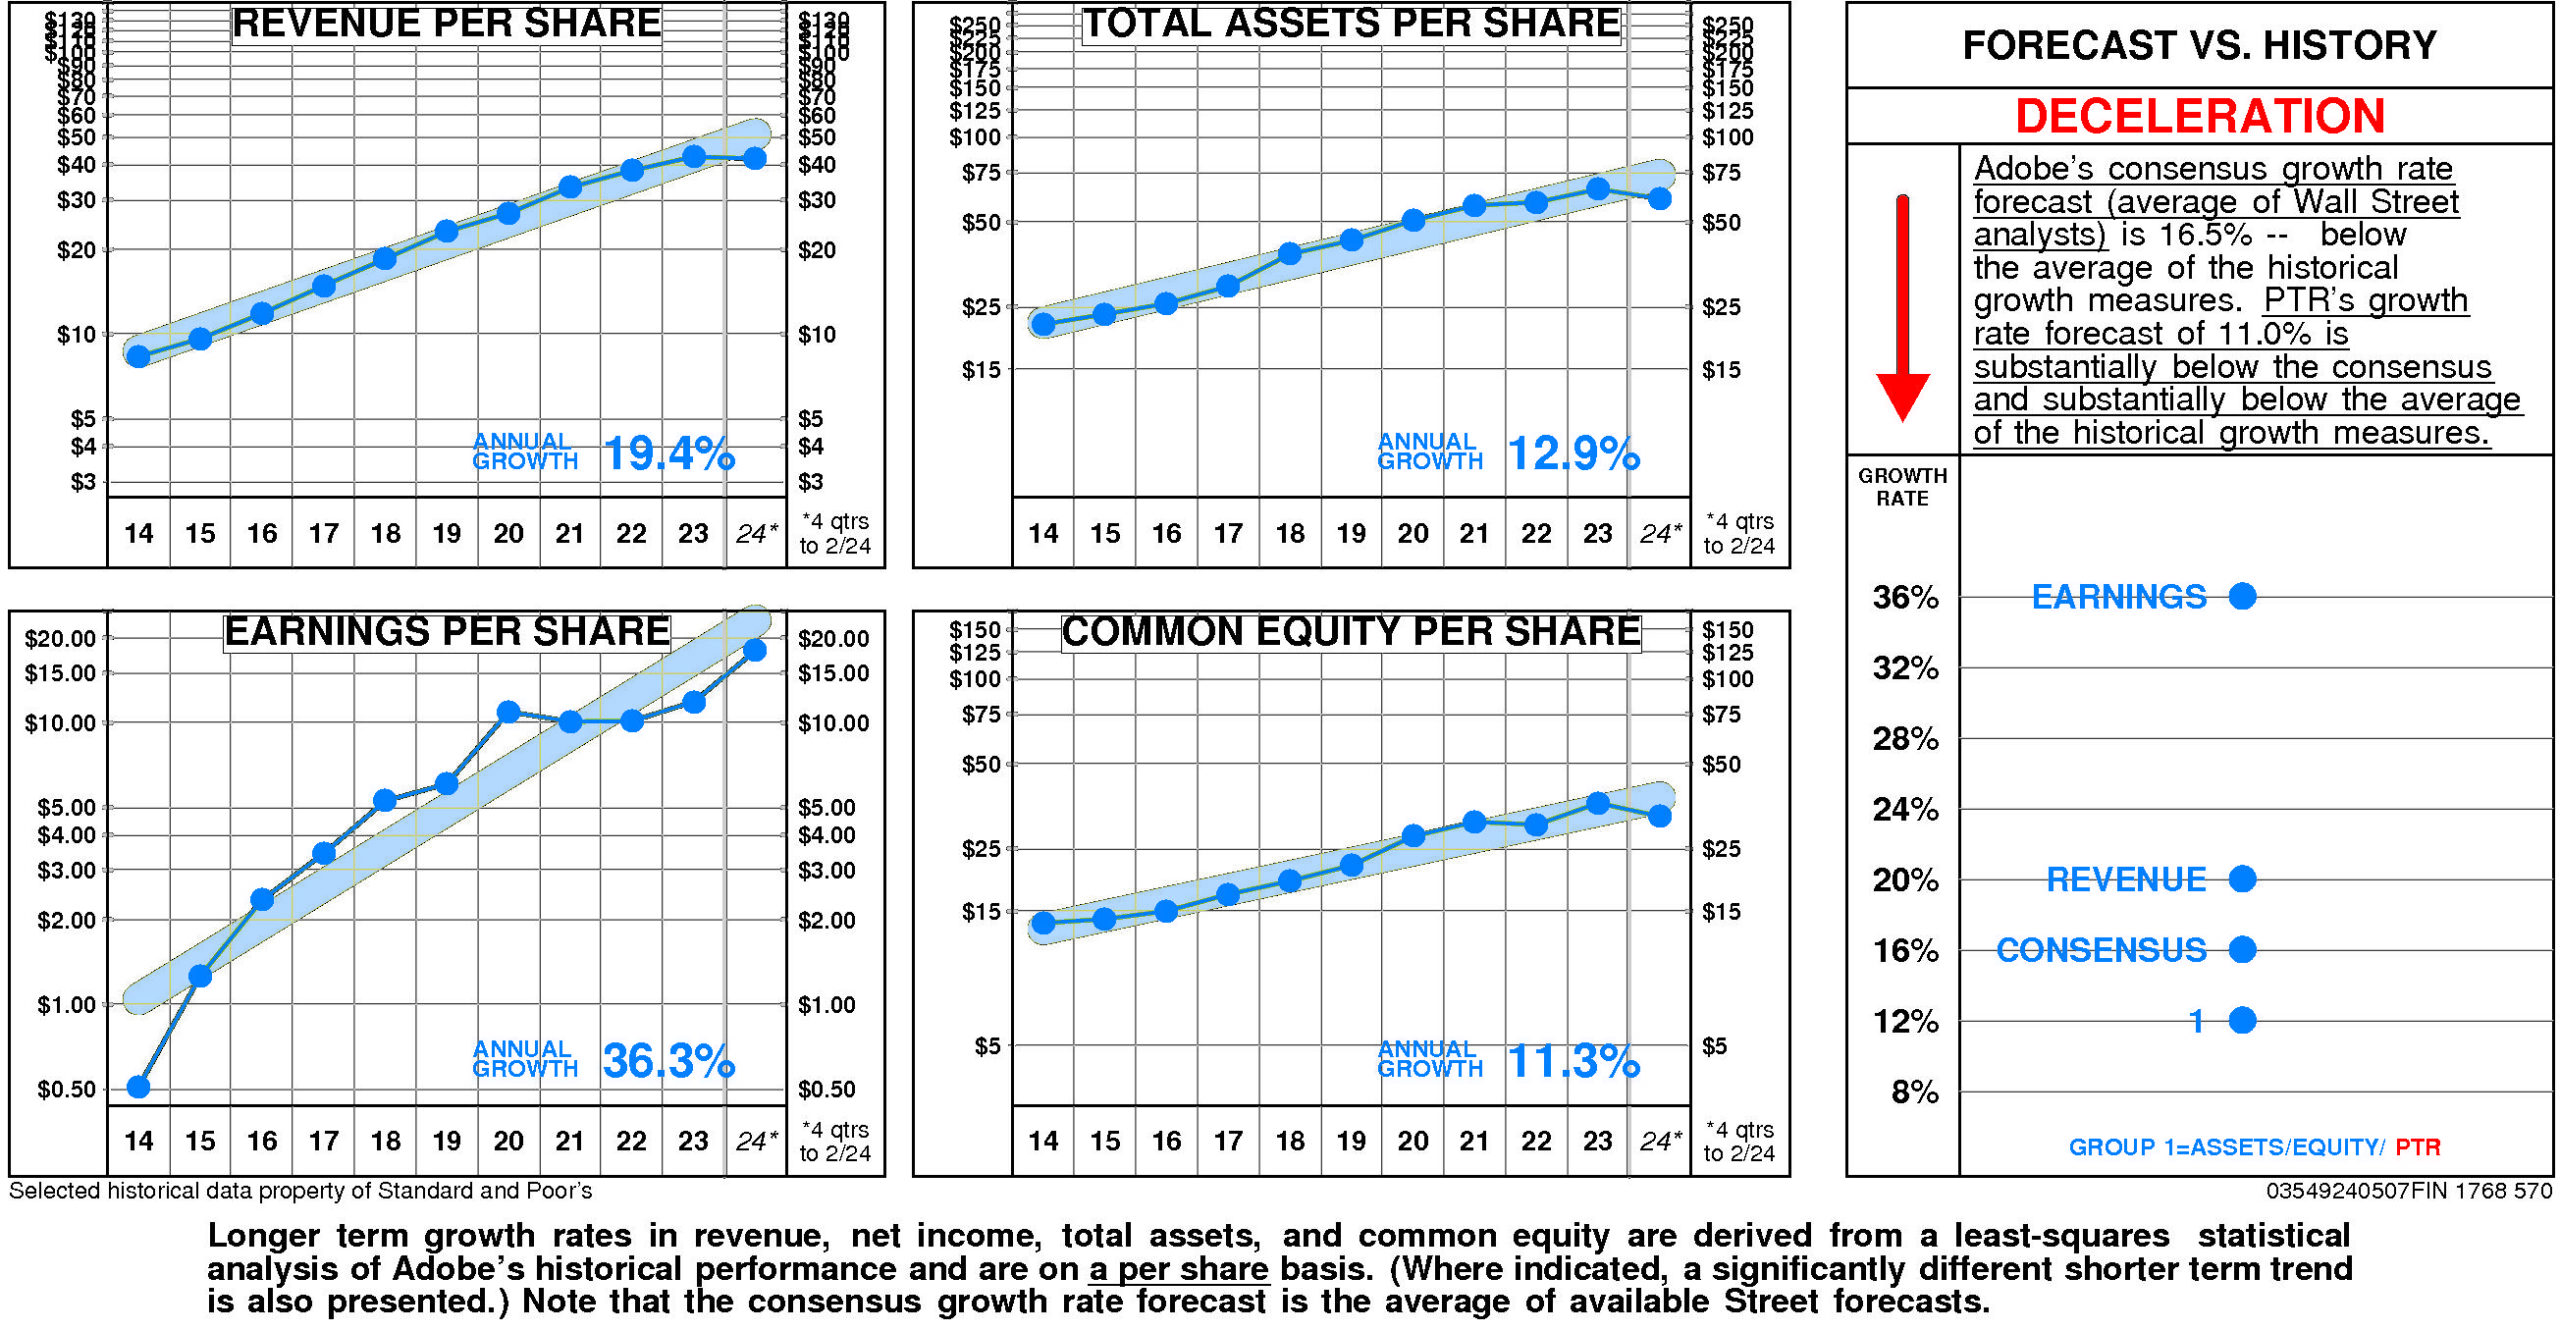
Adobe’s historical income statement growth has been higher than growth in the balance sheet. Revenue growth has exceeded asset growth; earnings growth has exceeded equity growth.
Annual revenue growth has been 19.4% per year.
Total asset growth has been 12.9% per year.
Annual E.P.S. growth has been 36.3% per year.
Equity growth has been 11.3% per year.
Adobe’s consensus growth rate forecast (average of Wall Street analysts) is 16.5% — below the average of the historical growth measures.
Relative to the Adobe Peer Group, Adobe’s historical growth measures are erratic. E.P.S. growth (36.3%) has been upper quartile. Revenue growth (19.4%) has been at the upper quartile. Equity growth (11.3%) has been at median. Total asset growth (12.9%) has been slightly below median.
Consensus growth forecast (16.5%) is slightly below median.
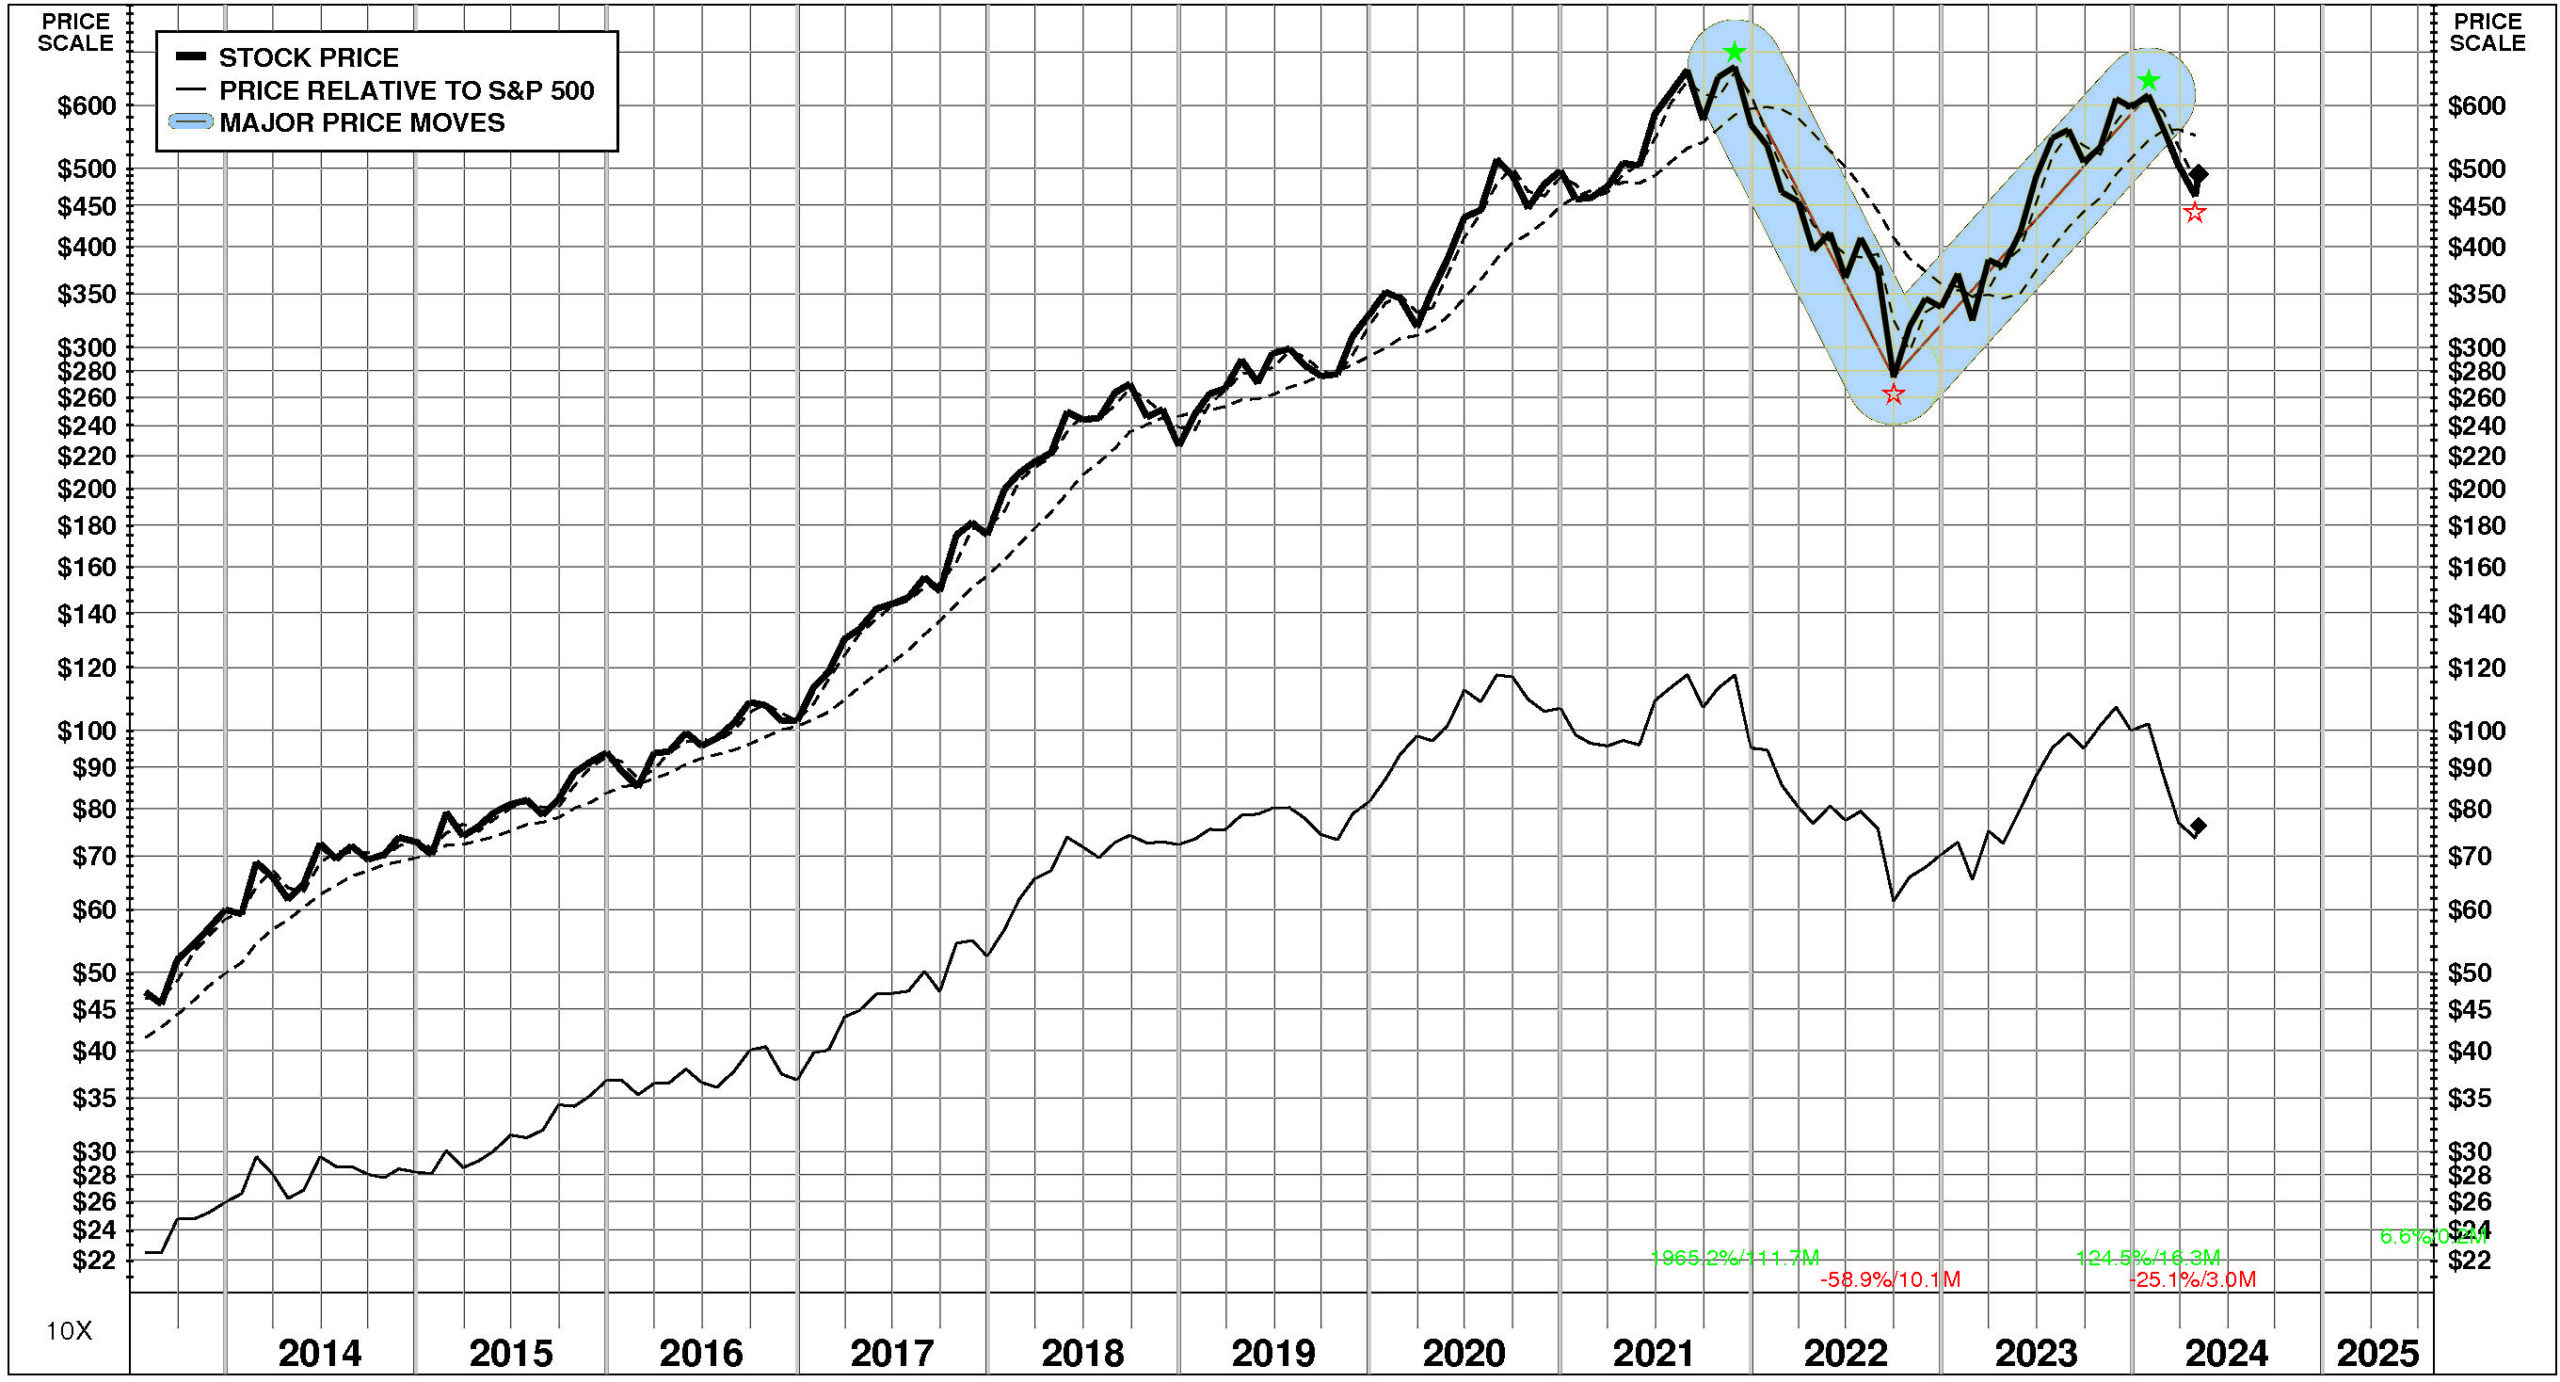
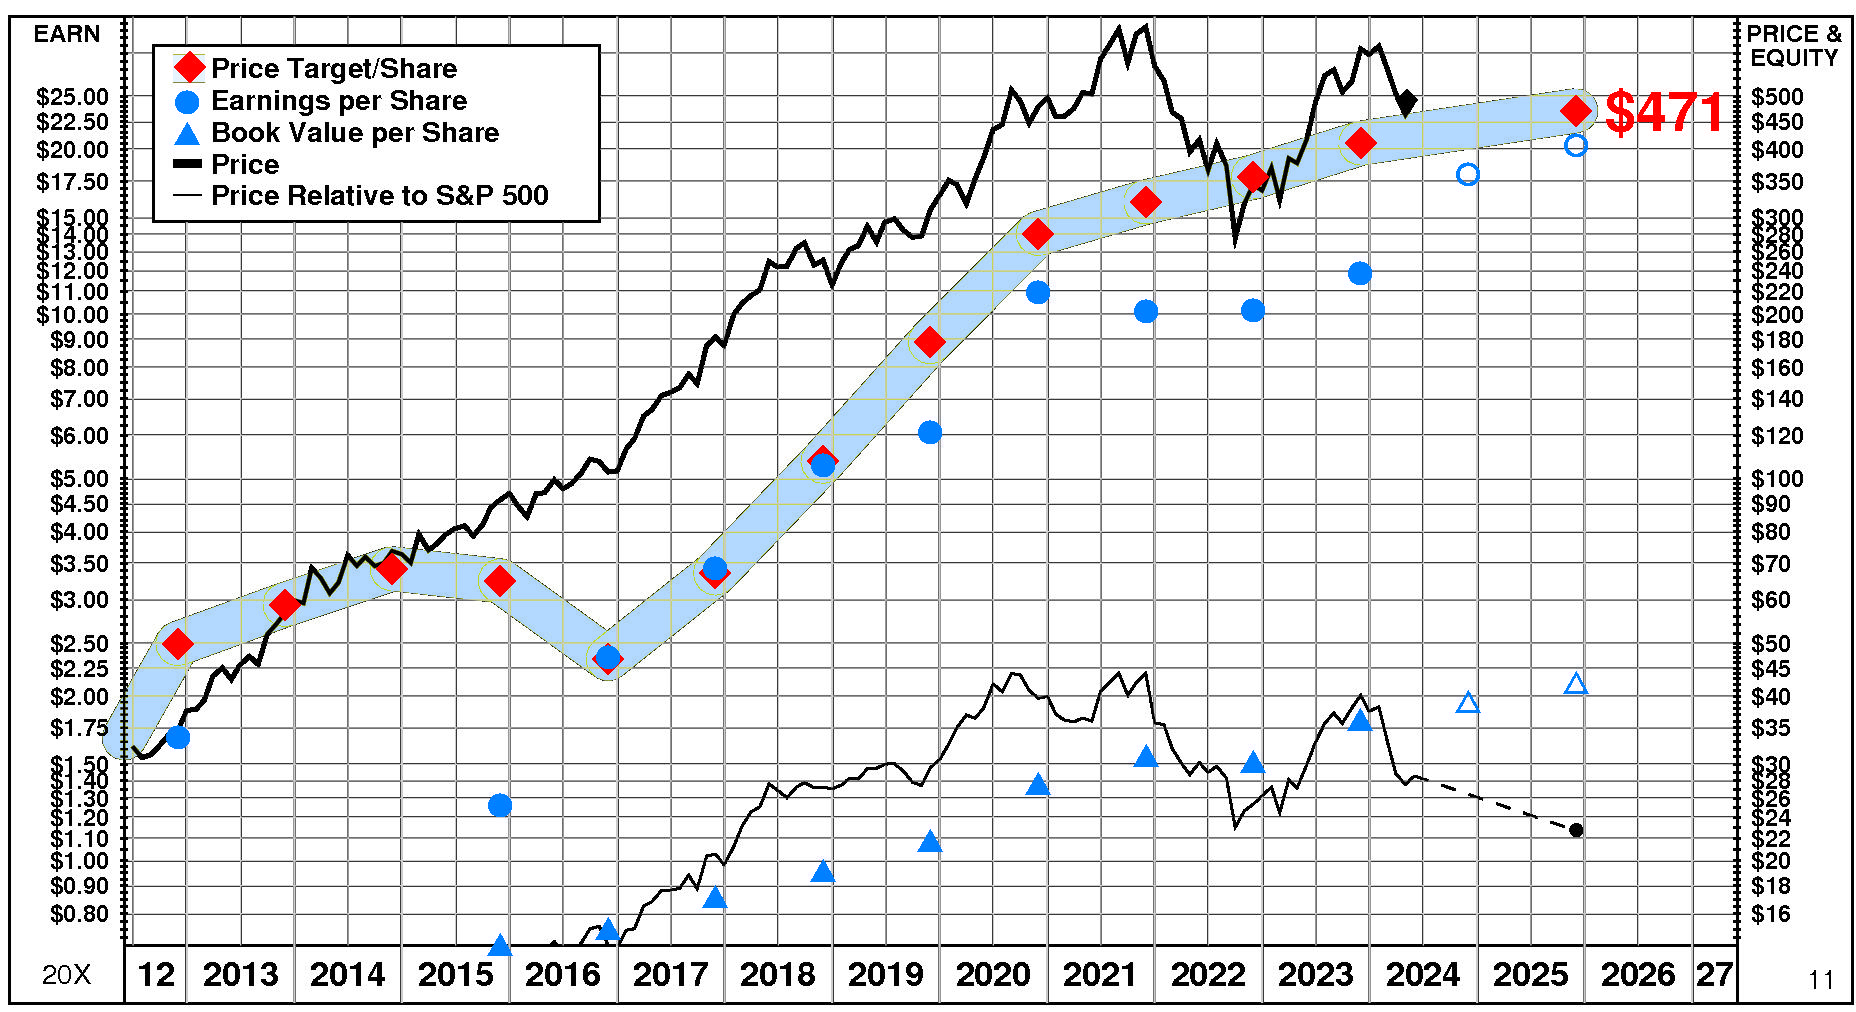
PRICE HISTORY
Over the full time period, Adobe’s stock price performance has been exceptional. Between July, 2013 and May, 2024, Adobe’s stock price rose +944%; relative to the market, this was a +240% gain. Significant price moves during the period: 1) September, 2022 – January, 2024: +124%; and 2) November, 2021 – September, 2022: -59%.
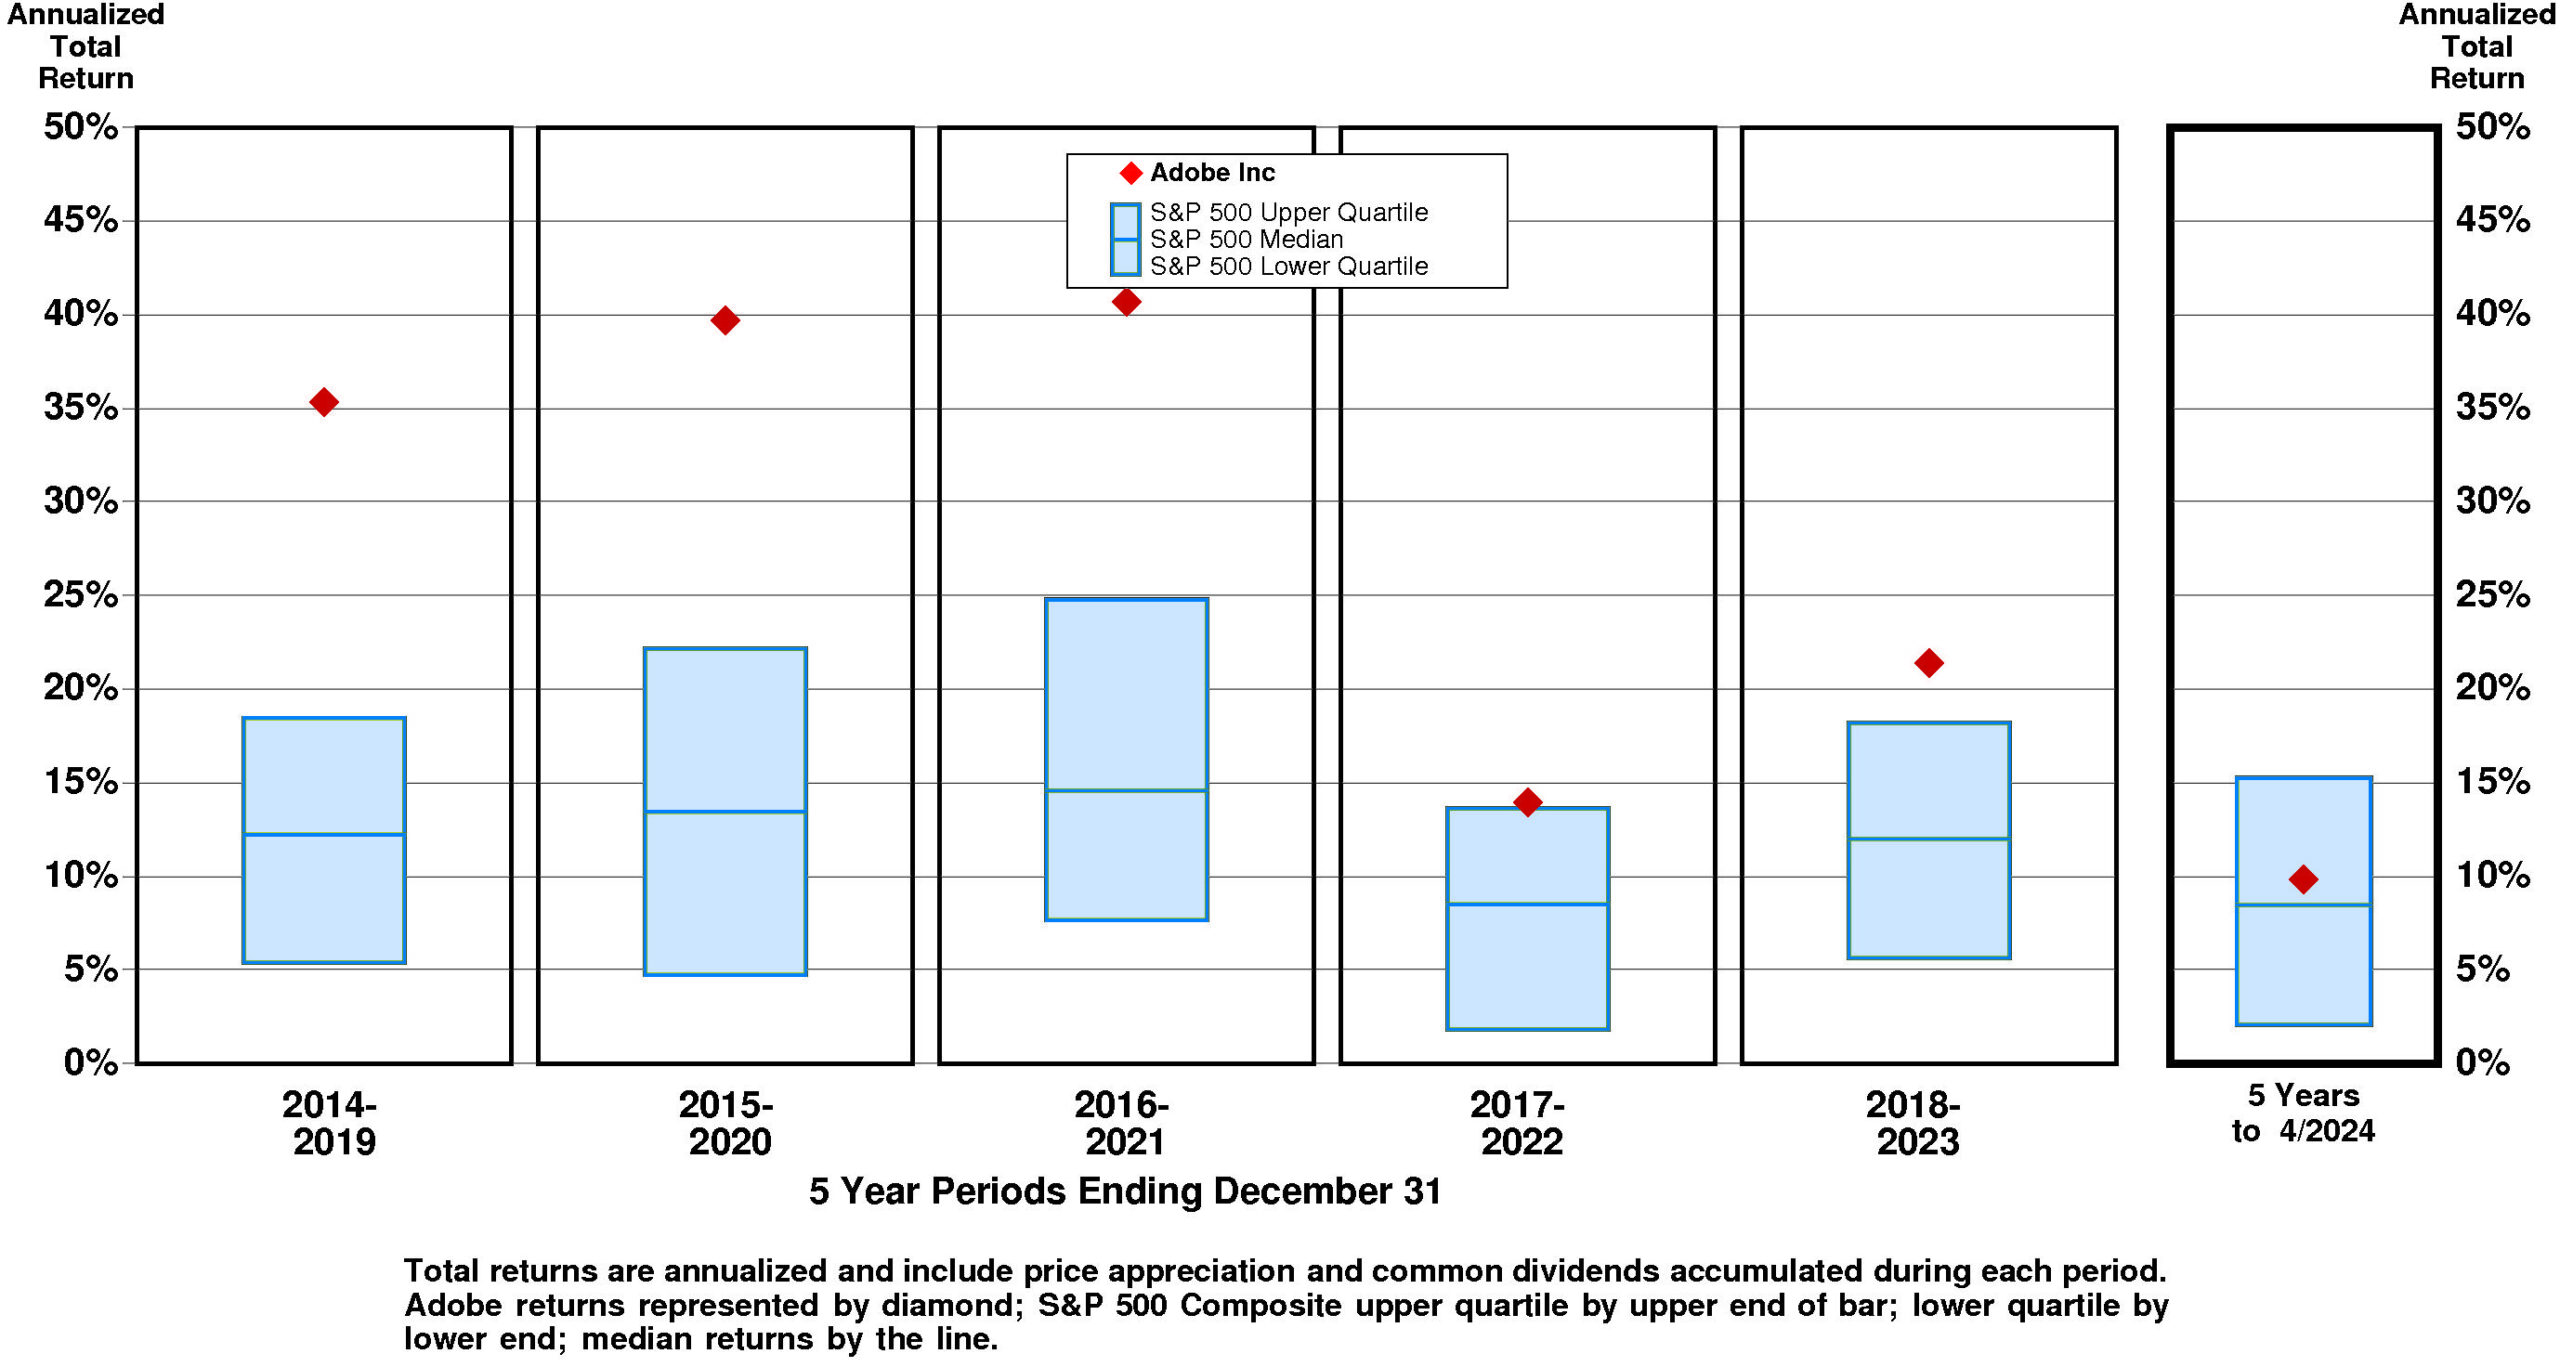
TOTAL INVESTMENT RETURNS
Current annual total return performance of 22.6% is above median relative to the S&P 500 Composite.
In addition to being above median relative to S&P 500 Composite, current annual total return performance through April, 2024 of 22.6% is slightly below median relative to Adobe Inc Peer Group.
Current 5-year total return performance of 9.9% is slightly above median relative to the S&P 500 Composite.
Through April, 2024, with slightly above median current 5-year total return of 9.9% relative to S&P 500 Composite, Adobe’s total return performance is below median relative to Adobe Inc Peer Group.
VALUATION BENCHMARKS
Relative to S&P 500 Composite, ADBE’s overall valuation is exceptionally high. All five factors are upper quartile. The highest factor is the ratio of enterprise value/assets, followed by the price/equity ratio, then by the ratio of enterprise value/revenue, then by the price/earnings ratio. The lowest factor is the ratio of enterprise value/earnings before interest and taxes.
Relative to Adobe Peer Group, ADBE’s overall valuation is high. The highest factor, the ratio of enterprise value/assets, is at the upper quartile. Price/equity ratio is at the upper quartile. Price/earnings ratio is above median. Ratio of enterprise value/earnings before interest and taxes is above median. The lowest factor, the ratio of enterprise value/revenue, is slightly above median.
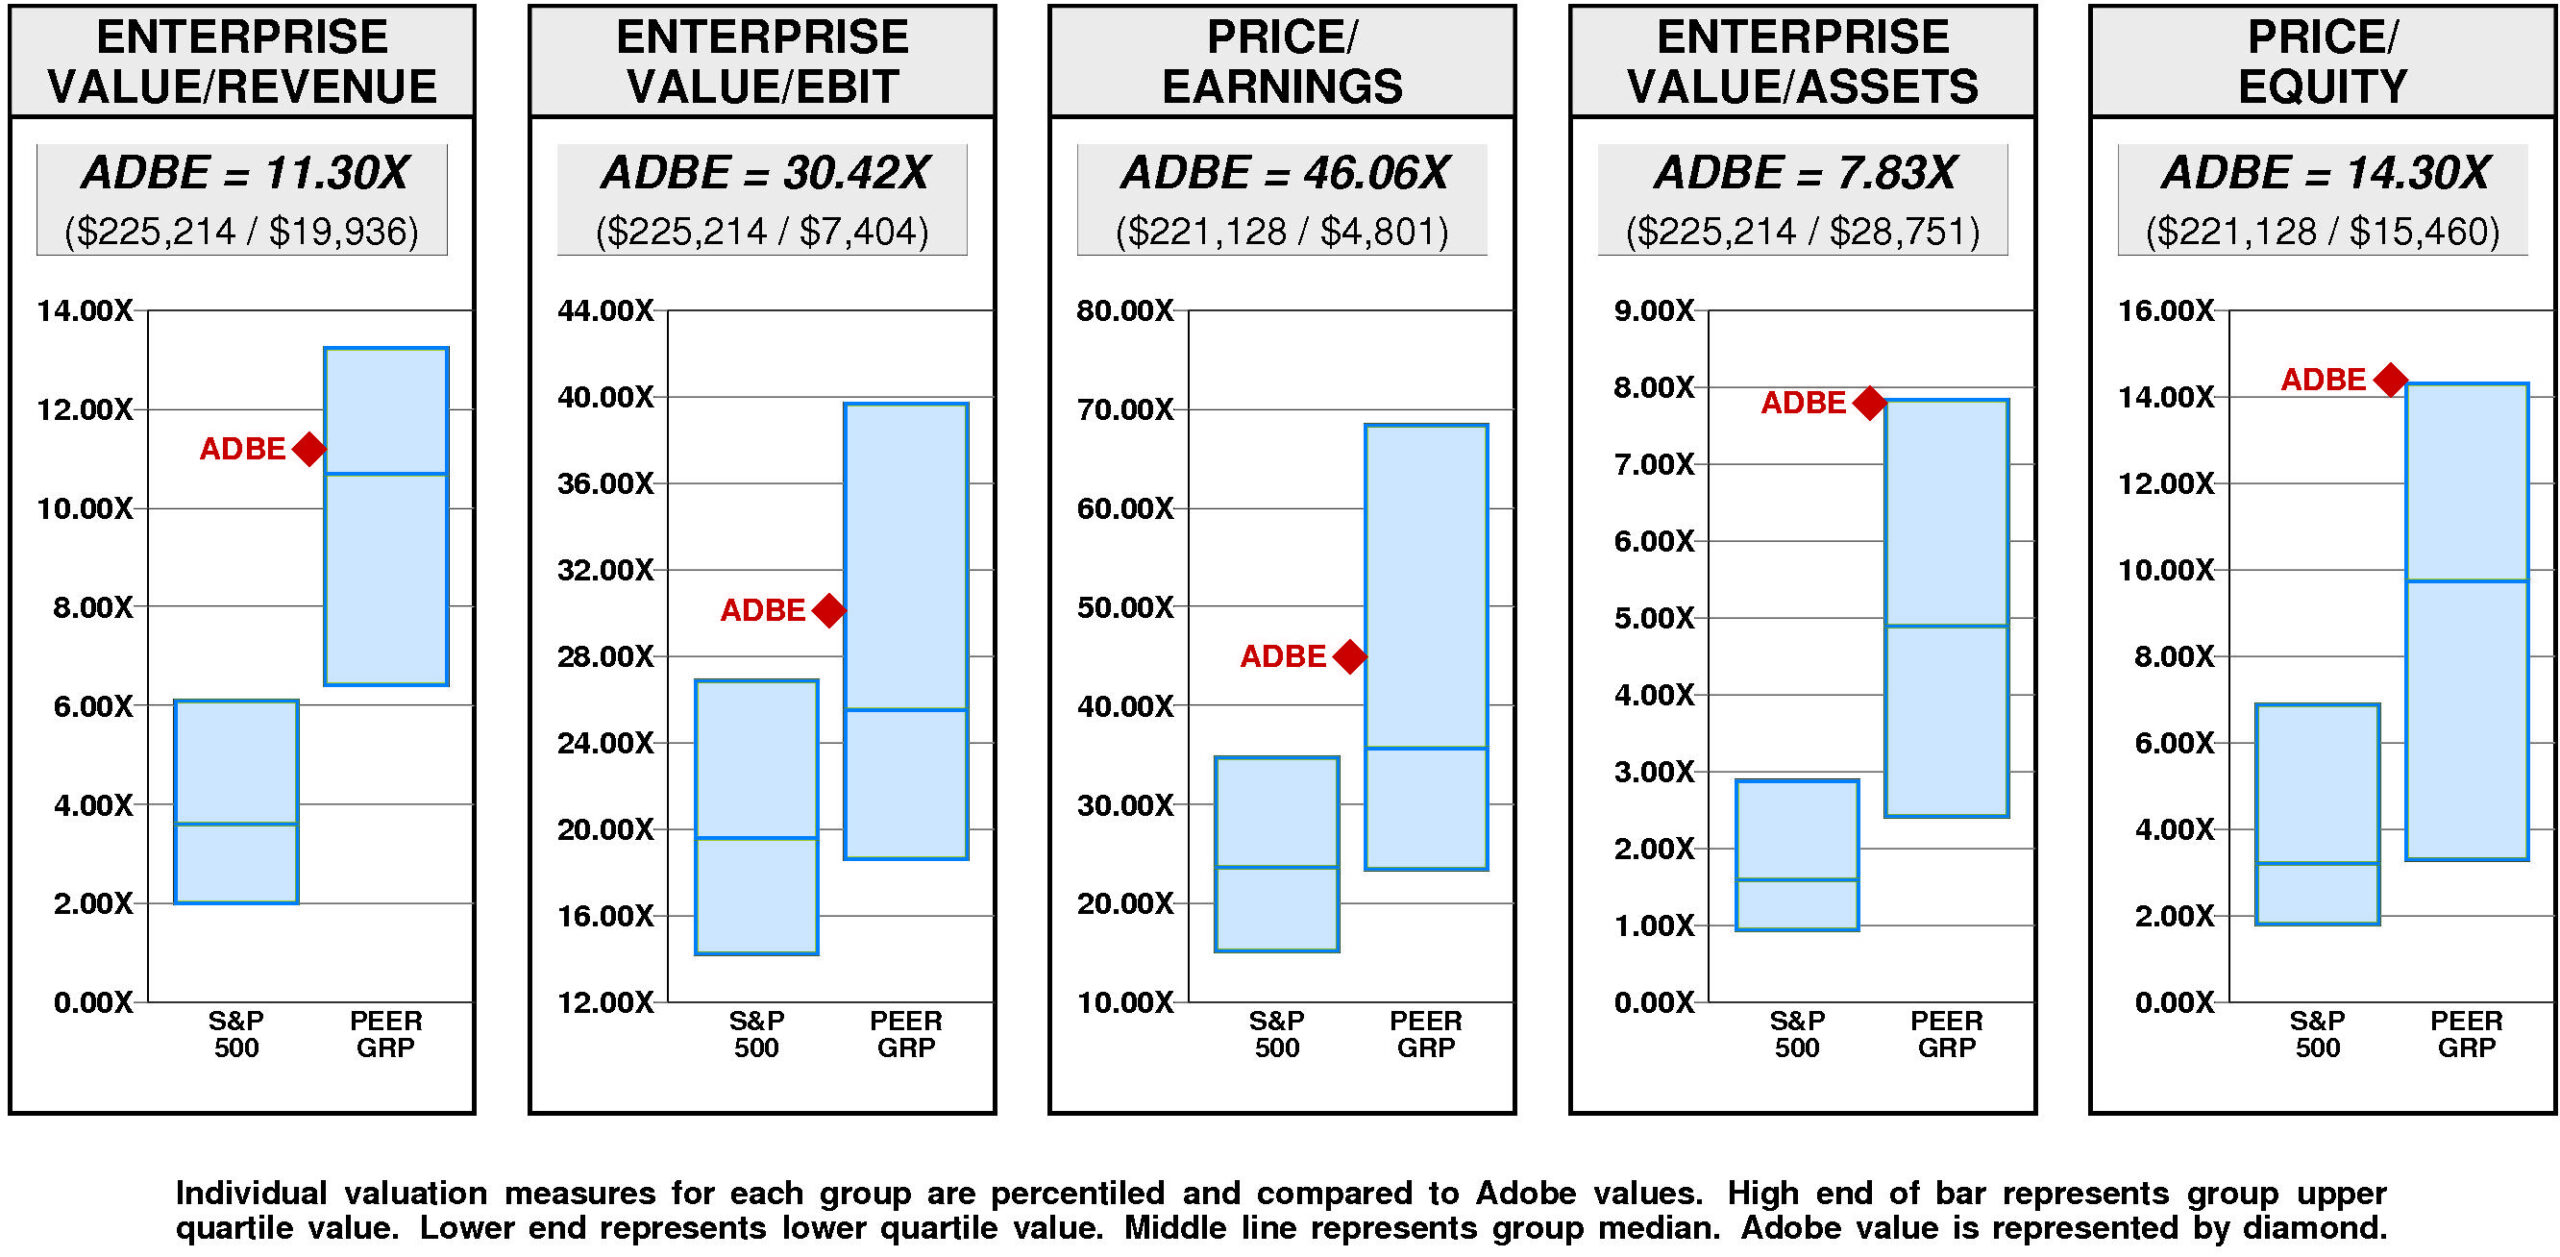
Adobe has a minor value gap compared to the median. For ADBE to achieve median valuation, its current ratio of enterprise value/revenue would have to fall from the current level of 11.30X to 10.69X. If ADBE’s ratio of enterprise value/revenue were to fall to 10.69X, its stock price would be lower by $-27 to $467.
For ADBE to achieve upper quartile valuation relative to the Adobe Peer Group, its current ratio of enterprise value/revenue would have to rise from the current level of 11.30X to 13.23X. If ADBE’s ratio of enterprise value/revenue were to rise to 13.23X, its stock price would increase by $86 from the current level of $494.
VALUE TARGETS
Reflecting future returns on capital that are forecasted to be above the cost of capital, ADBE is expected to continue to be a major Value Builder.
Adobe’s current Price Target of $470 is little changed from the current price of $462.83.
This moderately low appreciation potential results in an appreciation score of 32 (68% of the universe has greater appreciation potential.)
Reinforcing this moderately low Appreciation Score of 32, the moderately low Power Rating of 37 contributes to an Value Trend Rating of D.
Adobe’s current Price Target is $470 (+14% from the 2023 Target of $411 and +1% from the 04/30/24 price of $462.83). This slight rise in the Target is the result of a +20% increase in the equity base and a -5% decrease in the price/equity multiple. The forecasted increase in return on equity has a very large positive impact on the price/equity multiple and the forecasted decline in cost of equity has a slight positive impact as well. More than offsetting these Drivers, the forecasted decline in growth has a very large negative impact.

PTR’s return on equity forecast is 48.1% — above our recent forecasts. Forecasted return on equity enjoyed a dramatic, steady increase between 2015 and 2023. The current forecast is significantly above the 2015 low of 13%.
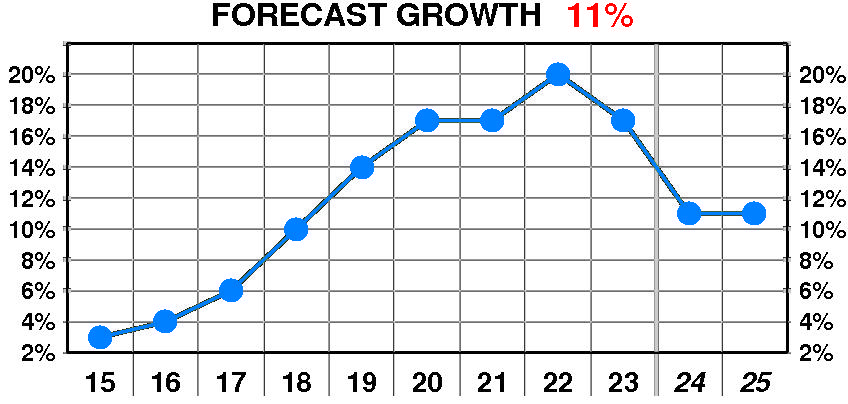
PTR’s growth forecast is 11.0% — below our recent forecasts. Forecasted growth enjoyed a dramatic, steady increase between 2015 and 2023. The current forecast is well above the 2015 low of 3%.
PTR’s cost of equity forecast is 12.4% — in line with recent levels. Forecasted cost of equity suffered a dramatic, erratic increase between 2015 and 2023. The current forecast is well above the 2015 low of 4.0%.
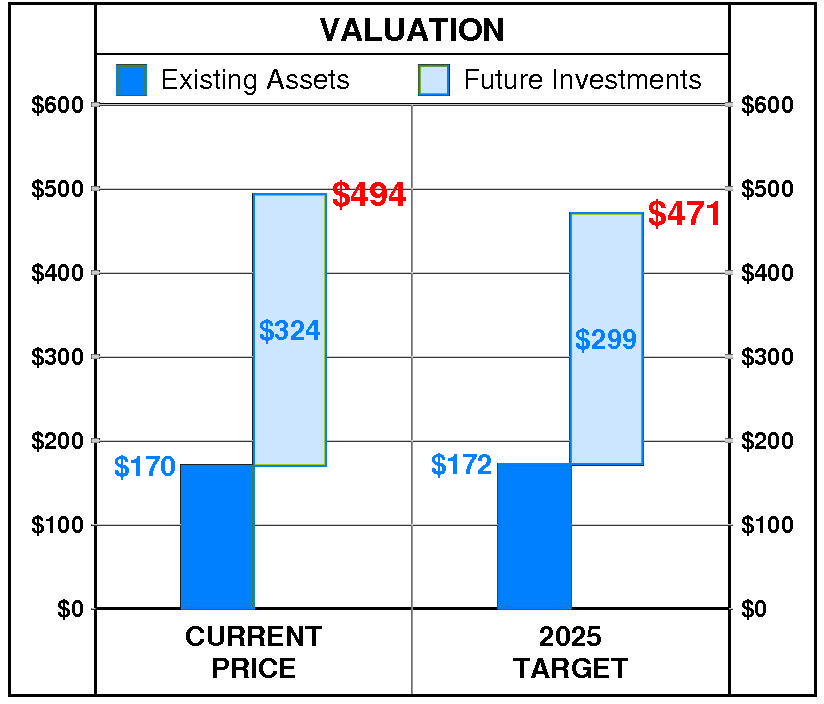
At Adobe’s current price of $462.83, investors are placing a positive value of $293 on its future investments. This view is consistent with the company’s most recent performance that reflected a growth rate of 17.0% per year, and a return on equity of 41.5% versus a cost of equity of 12.8%.
PTR’s 2025 Price Target of $470 is based on these forecasts and reflects an estimated value of existing assets of $186 and a value of future investments of $284.
Be the first to comment