![]()
BUSINESS
Harley-Davidson, Inc. manufactures and sells motorcycles. The company operates in two segments, Motorcycles and Related Products and Financial Services. The Motorcycles and Related Products segment designs, manufactures, and sells Harley-Davidson motorcycles, including cruiser, touring, standard, sportbike, and dual models, as well as motorcycle parts, accessories, apparel, and related services. This segment sells its products to retail customers through a network of independent dealers, as well as e-commerce channels in the United States, Canada, Latin America, Europe, the Middle East, Africa, and the Asia-Pacific.
INVESTMENT RATING
HOG is expected to continue to be an important Value Builder reflecting capital returns that are forecasted to be above the cost of capital.
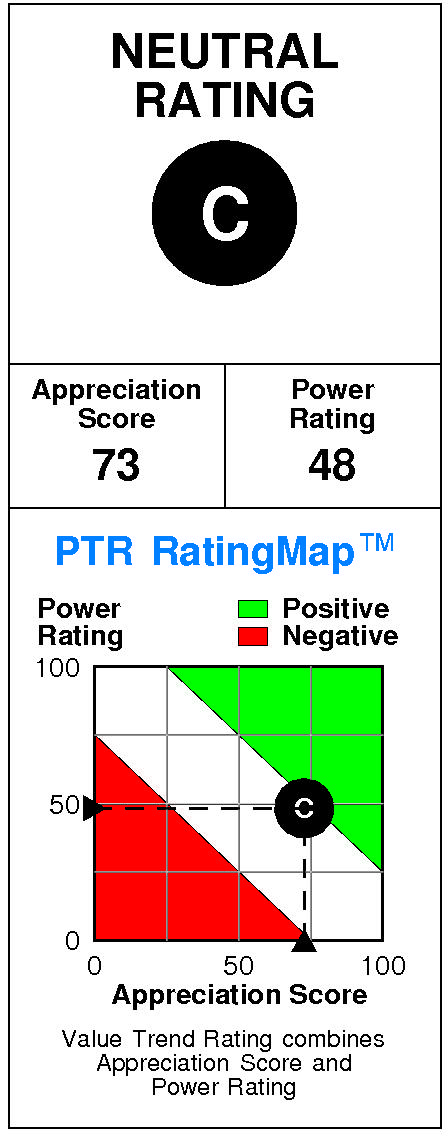
Harley-Davidson has a current Value Trend Rating of C (High Neutral).
With this rating, PTR’s two proprietary measures of a stock’s current attractiveness are providing inconsistent signals. Harley-Davidson has a good Appreciation Score of 73 but a neutral Power Rating of 48, leading to the High Neutral Value Trend Rating.
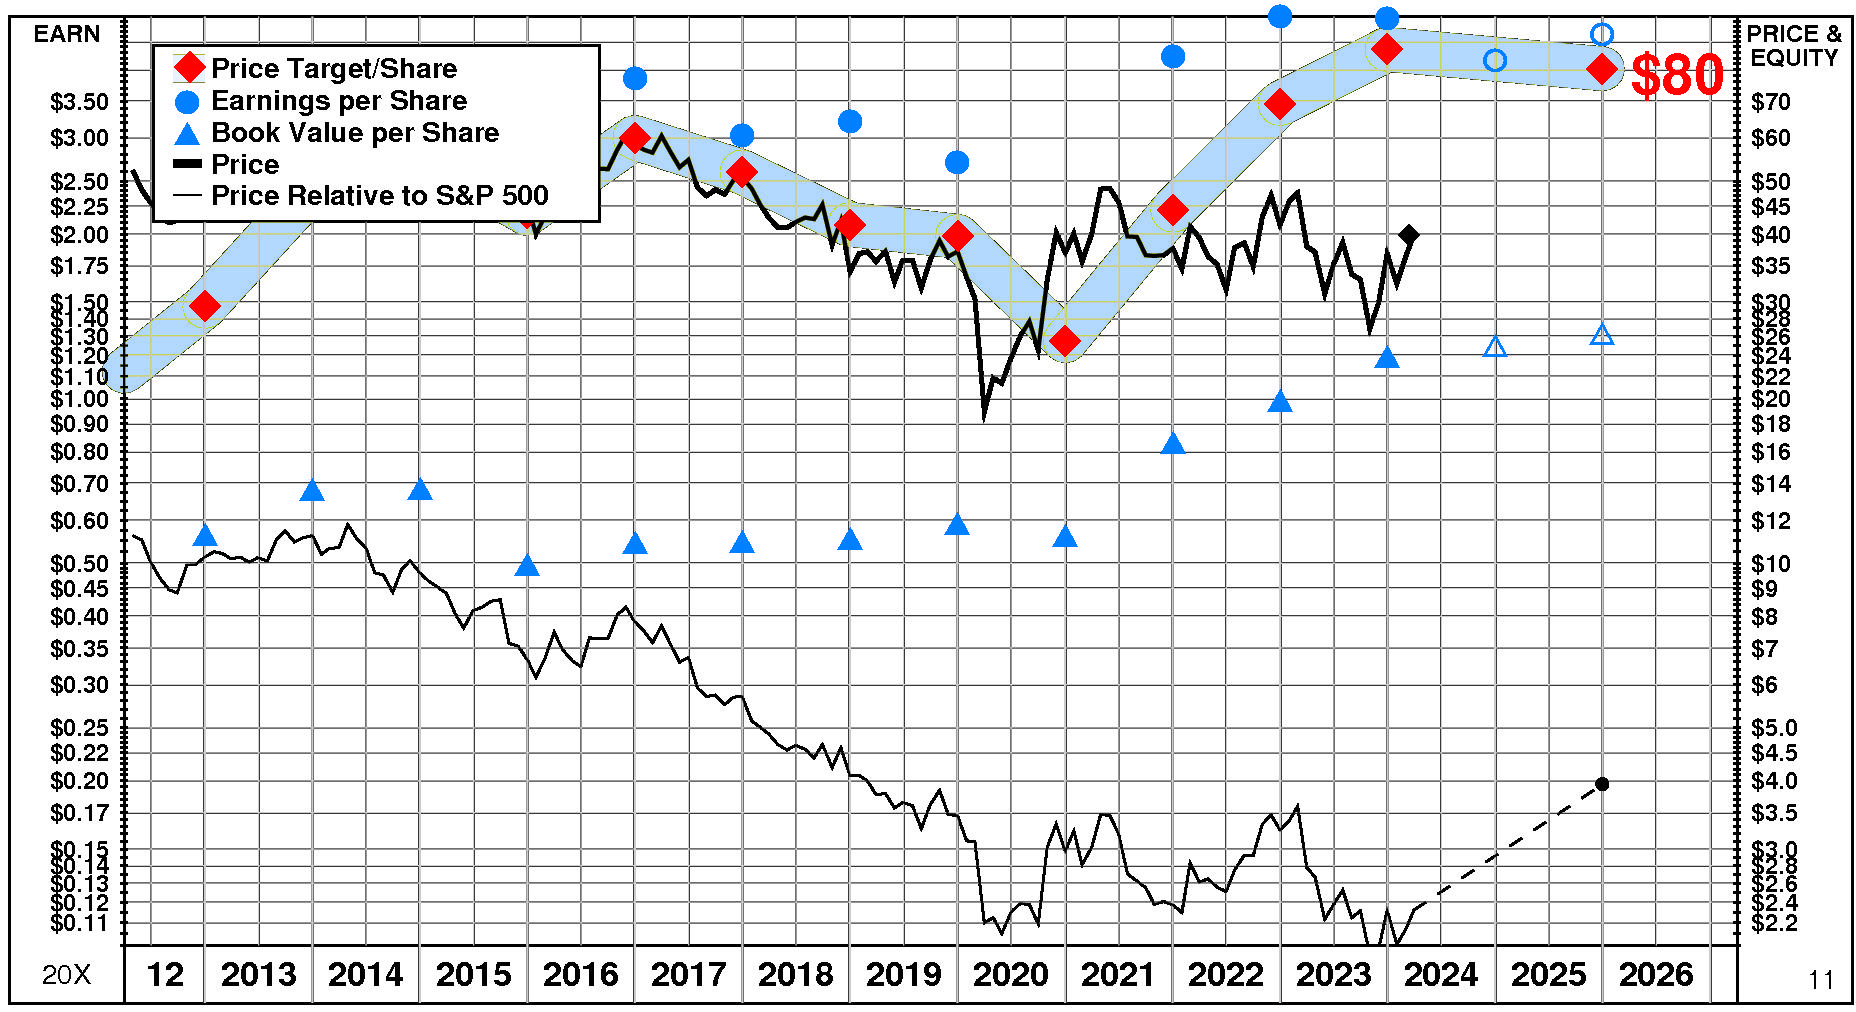
Harley-Davidson’s stock is selling well below targeted value. The current stock price of $39.98 compares to targeted value 12 months forward of $79.
Harley-Davidson’s high appreciation potential results in an appreciation score of 73 (only 27% of the universe has greater appreciation potential.)
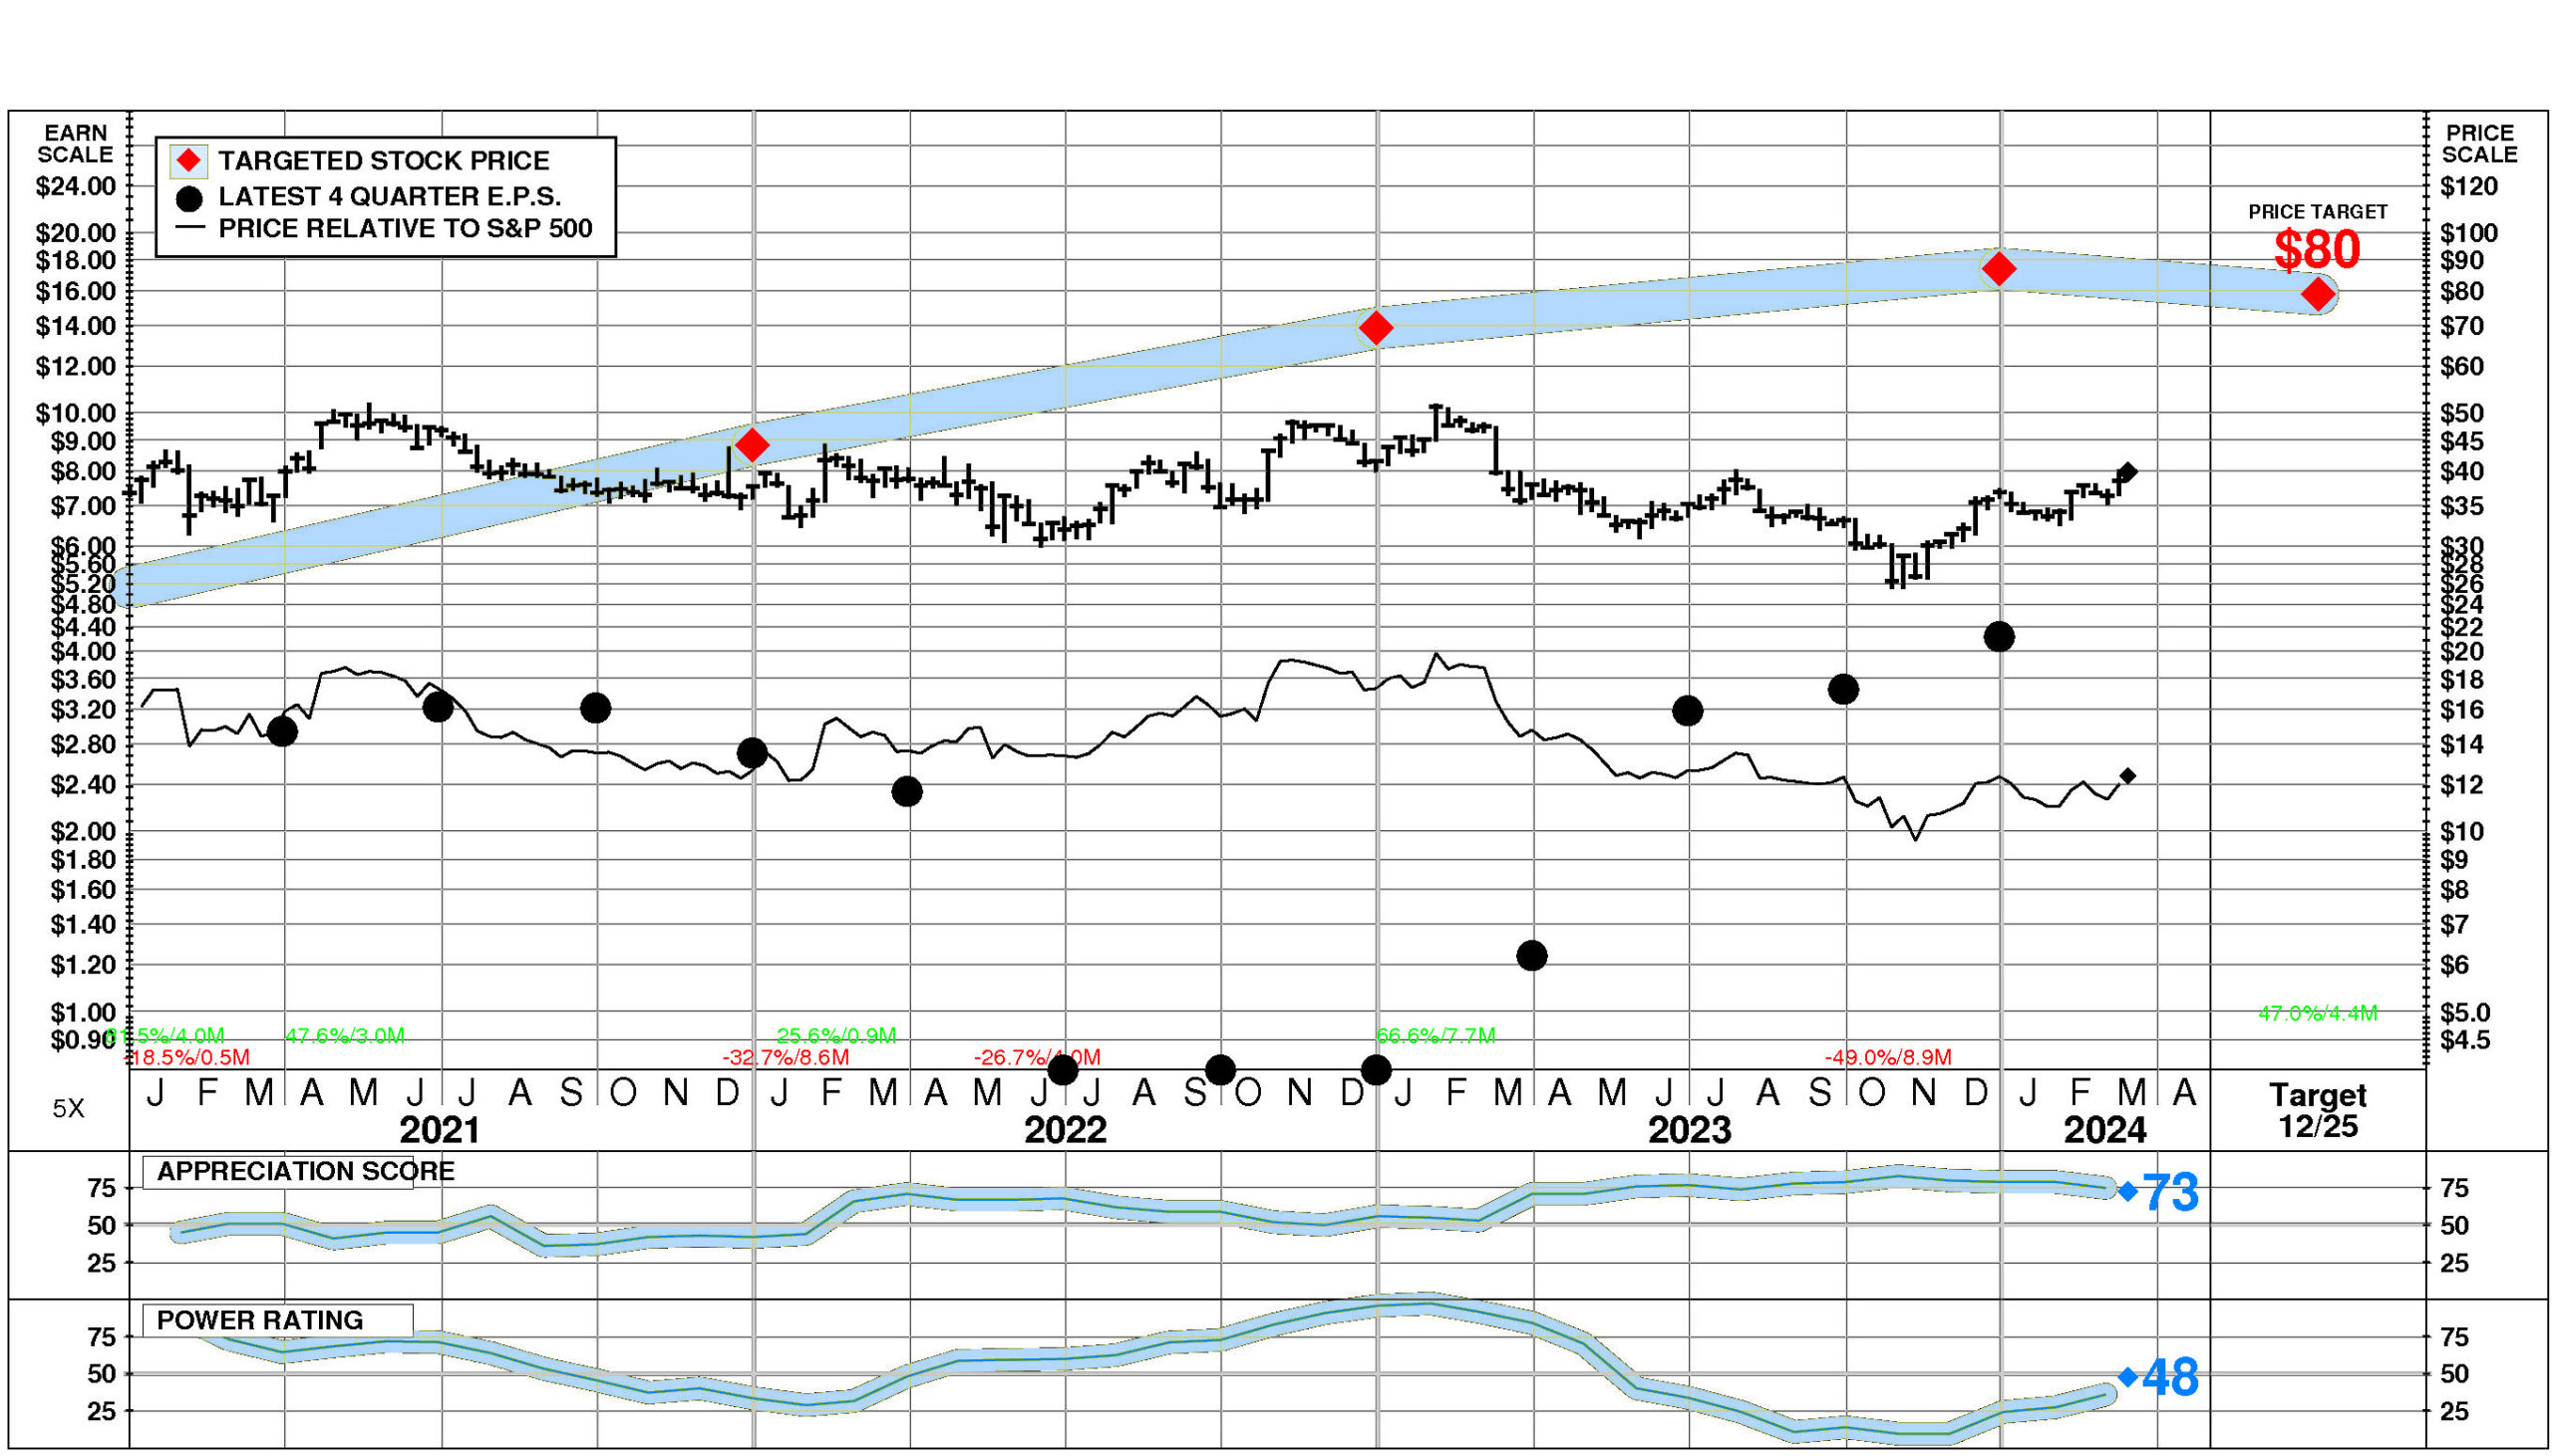
Harley-Davidson has a Power Rating of 48. (This neutral Power Rating indicates that HOG’s chances of enjoying attractive investment performance over the near to intermediate term are only average.)
Contributing to this neutral Power Rating: the Motorcycles, Bicycles & Parts comparison group is in an extremely unfavorable position currently. Offsetting factors are recent price action has been neutral; and the recent trend in HOG’s earnings estimates has been favorable.
INVESTMENT PROFILE
HOG’s financial strength is average. Financial strength rating is 58.
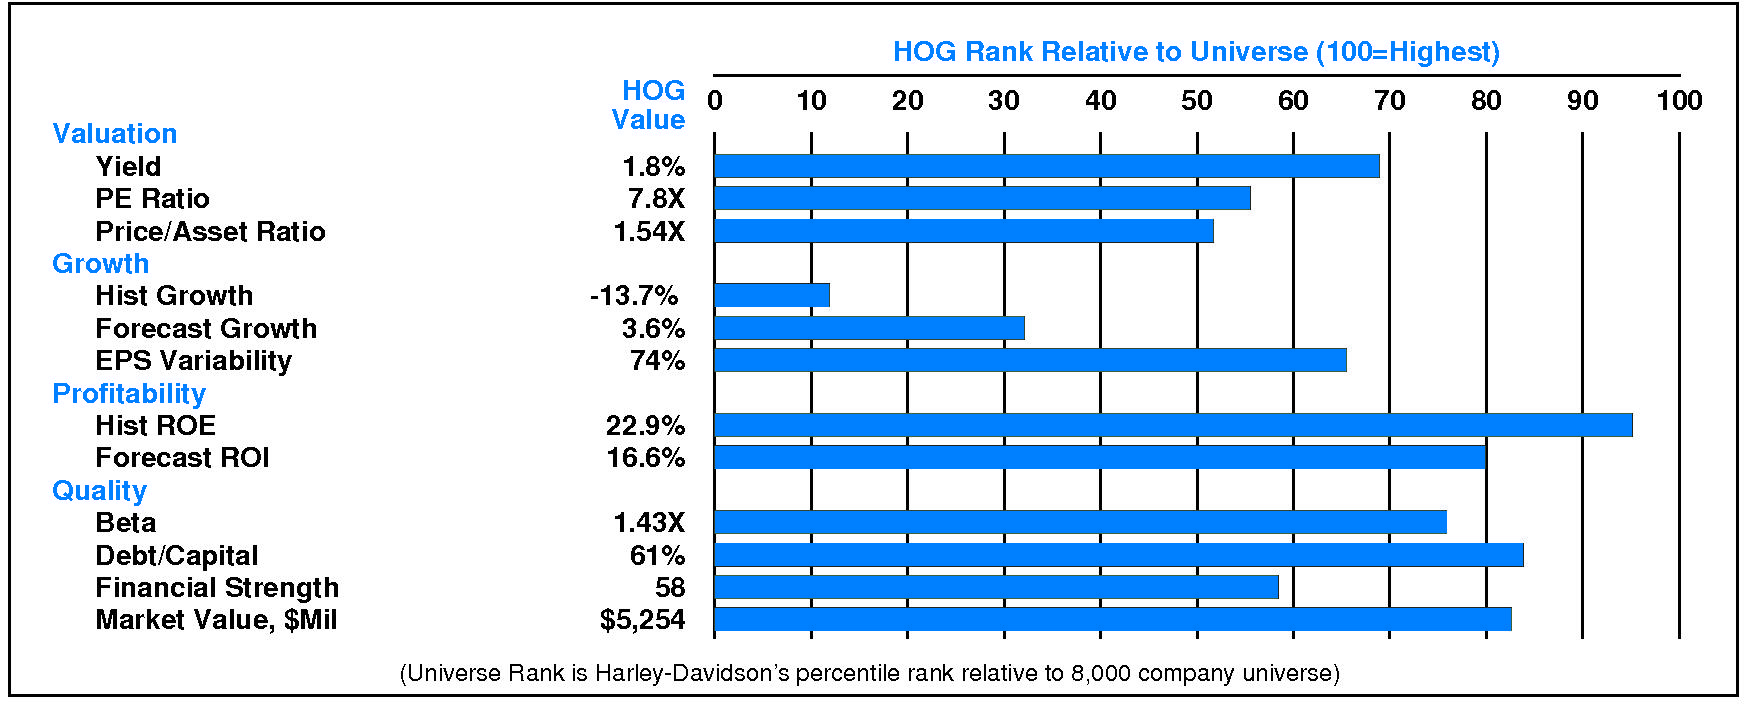
Relative to the S&P 500 Composite, Harley-Davidson Inc. has moderate Value characteristics; its appeal is likely to be to Income-oriented investors; the perception is that HOG is higher risk. High historical profitability is a positive for HOG. Relative weaknesses include: high stock price volatility, high financial leverage, low expected growth, low historical growth, and high earnings variability. HOG’s valuation is low: moderate dividend yield, low P/E ratio, and low price/book ratio. HOG has unusually low market capitalization.
CURRENT SIGNALS
Harley-Davidson’s current operations are eroding. Return on equity is falling, reflecting: falling asset utilization; declining pretax margin; and falling leverage.
Harley-Davidson’s current technical position is very strong. The stock price is in a 4.4 month up move. The stock has appreciated 47.0% from its prior low. The stock price is above its 200 day moving average which is in an uptrend.
ALERTS
Harley-Davidson Inc. (NYSE: HOG) has recently enjoyed slight positive changes in fundamentals: significant quarterly earnings acceleration occurred.
The stock is currently rated C.
Harley-Davidson Inc. (NYSE: HOG) stock declined slightly by -0.2% on 3/13/24. The stock closed at $39.98. Moreover, trading volume in this decline was above average at 122% of normal. The stock has performed in line with the market over the last nine months and has risen 1.7% during the last week.
CASH FLOW
In 2023, Harley-Davidson generated an increase in cash of +$70 million (+4%). Sources of cash were very slightly larger than uses. Cash generated from 2023 EBITDA totaled +$1,270 million. Non-operating sources contributed +$130 million (+10% of EBITDA). Cash taxes consumed -$168 million (-13% of EBITDA). Re-investment in the business amounted to -$682 million (-54% of EBITDA). On a net basis, debt investors removed -$122 million (-10% of EBITDA) while equity investors received -$357 million (-28% of EBITDA).
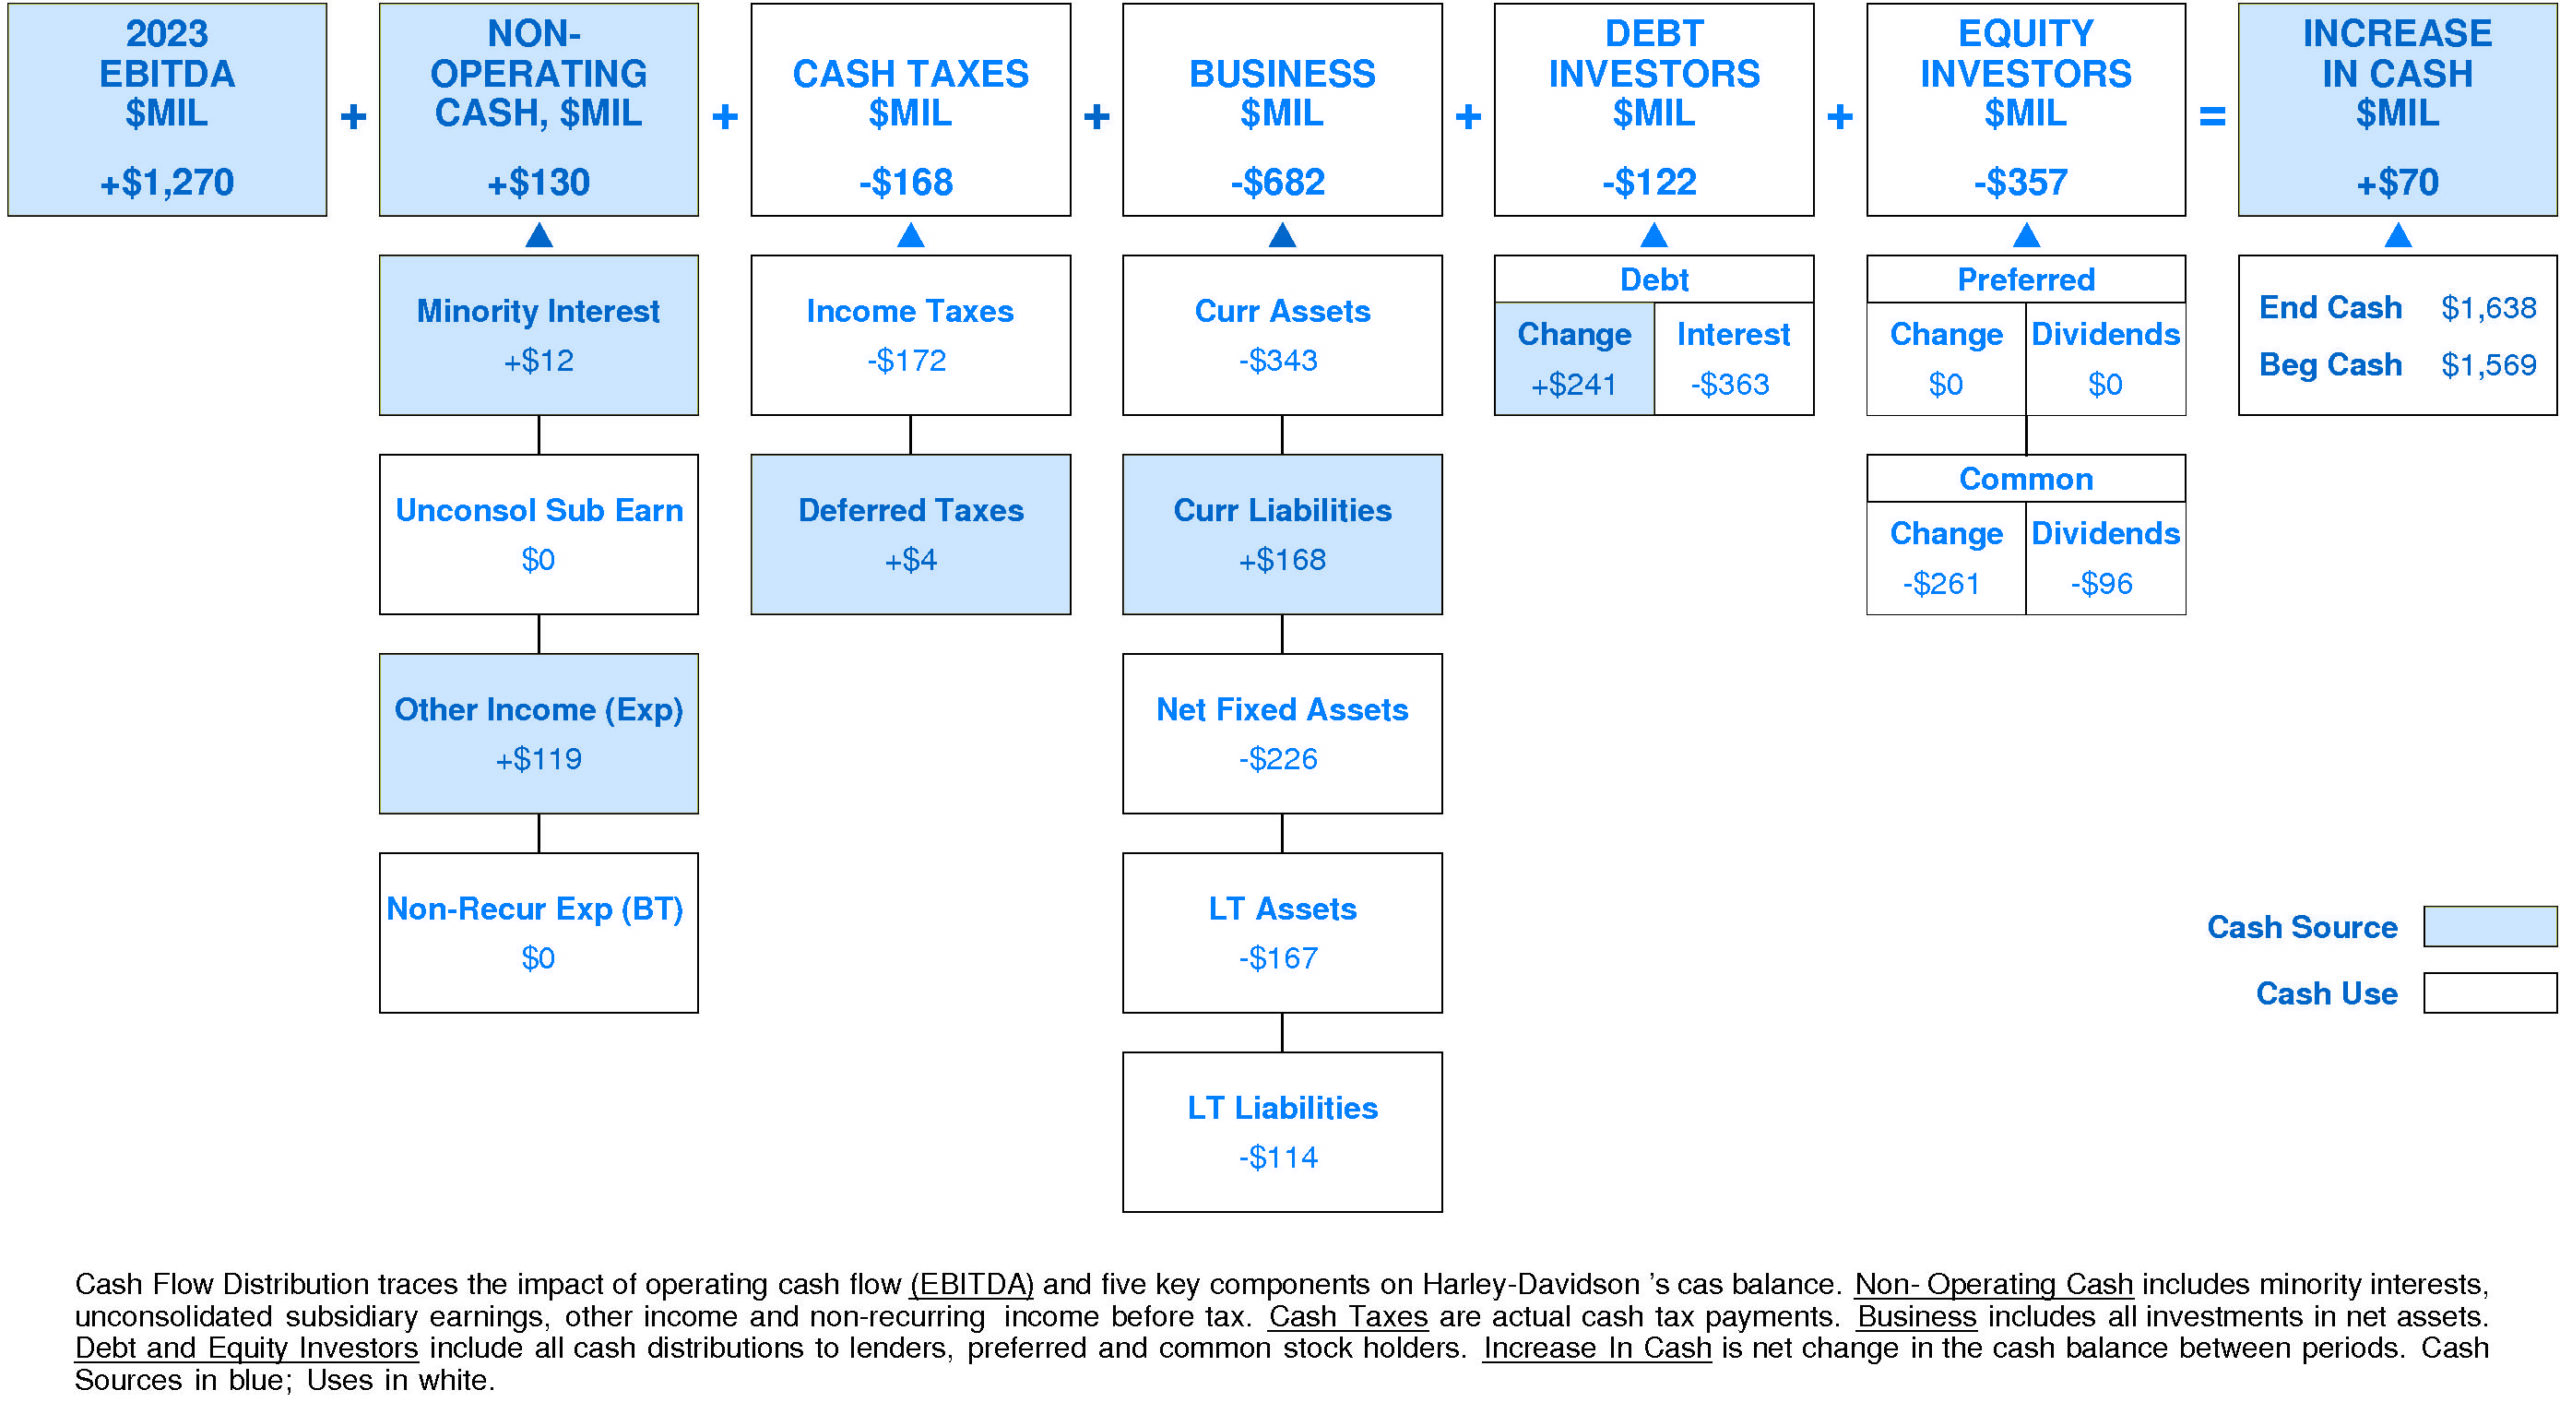
Harley-Davidson’s Non-operating Income, %EBITDA has exhibited little to no overall change over the period. This stability was accompanied by stability for the Harley-Davidson Peer Group as well. (Since 2020 Non-operating Income, %EBITDA has experienced very sharp improvement.) In most years, Harley-Davidson was in the top quartile and second quartile. Currently, Harley-Davidson is at the upper quartile at +10% of EBITDA (+$130 million).
Harley-Davidson’s Cash Taxes, %EBITDA has exhibited a minor overall uptrend over the period. This improvement was accompanied by a similar trend for the Harley-Davidson Peer Group. In most years, Harley-Davidson was in the third quartile and second quartile. Currently, Harley-Davidson is above median at -13% of EBITDA (-$168 million).
Harley-Davidson’s Business Re-investment, %EBITDA has exhibited a volatile overall uptrend over the period. This improvement was accompanied by a similar trend for the Harley-Davidson Peer Group. In most years, Harley-Davidson was in the second quartile and third quartile. Currently, Harley-Davidson is lower quartile at -54% of EBITDA (-$682 million).
Harley-Davidson’s Debt Investors, %EBITDA has experienced a volatile overall downtrend over the period. This downtrend was accompanied by a similar trend for the Harley-Davidson Peer Group. (Since 2021 Debt Investors, %EBITDA has experienced a very sharp recovery.) In most years, Harley-Davidson was in the top quartile and second quartile. Currently, Harley-Davidson is slightly below median at -10% of EBITDA (-$122 million).
Harley-Davidson’s Equity Investors, %EBITDA has enjoyed a very strong overall uptrend over the period. This improvement was accompanied by a similar trend for the Harley-Davidson Peer Group. In most years, Harley-Davidson was in the second quartile and lower quartile. Currently, Harley-Davidson is slightly below median at -28% of EBITDA (-$357 million).
Harley-Davidson’s Change in Cash, %EBITDA has experienced a volatile overall uptrend over the period. This improvement was accompanied by stability for the Harley-Davidson Peer Group. (Since 2021 Change in Cash, %EBITDA has accelerated very sharply.) In most years, Harley-Davidson was in the top quartile and lower quartile. Currently, Harley-Davidson is at the upper quartile at +6% of EBITDA (+$70 million).
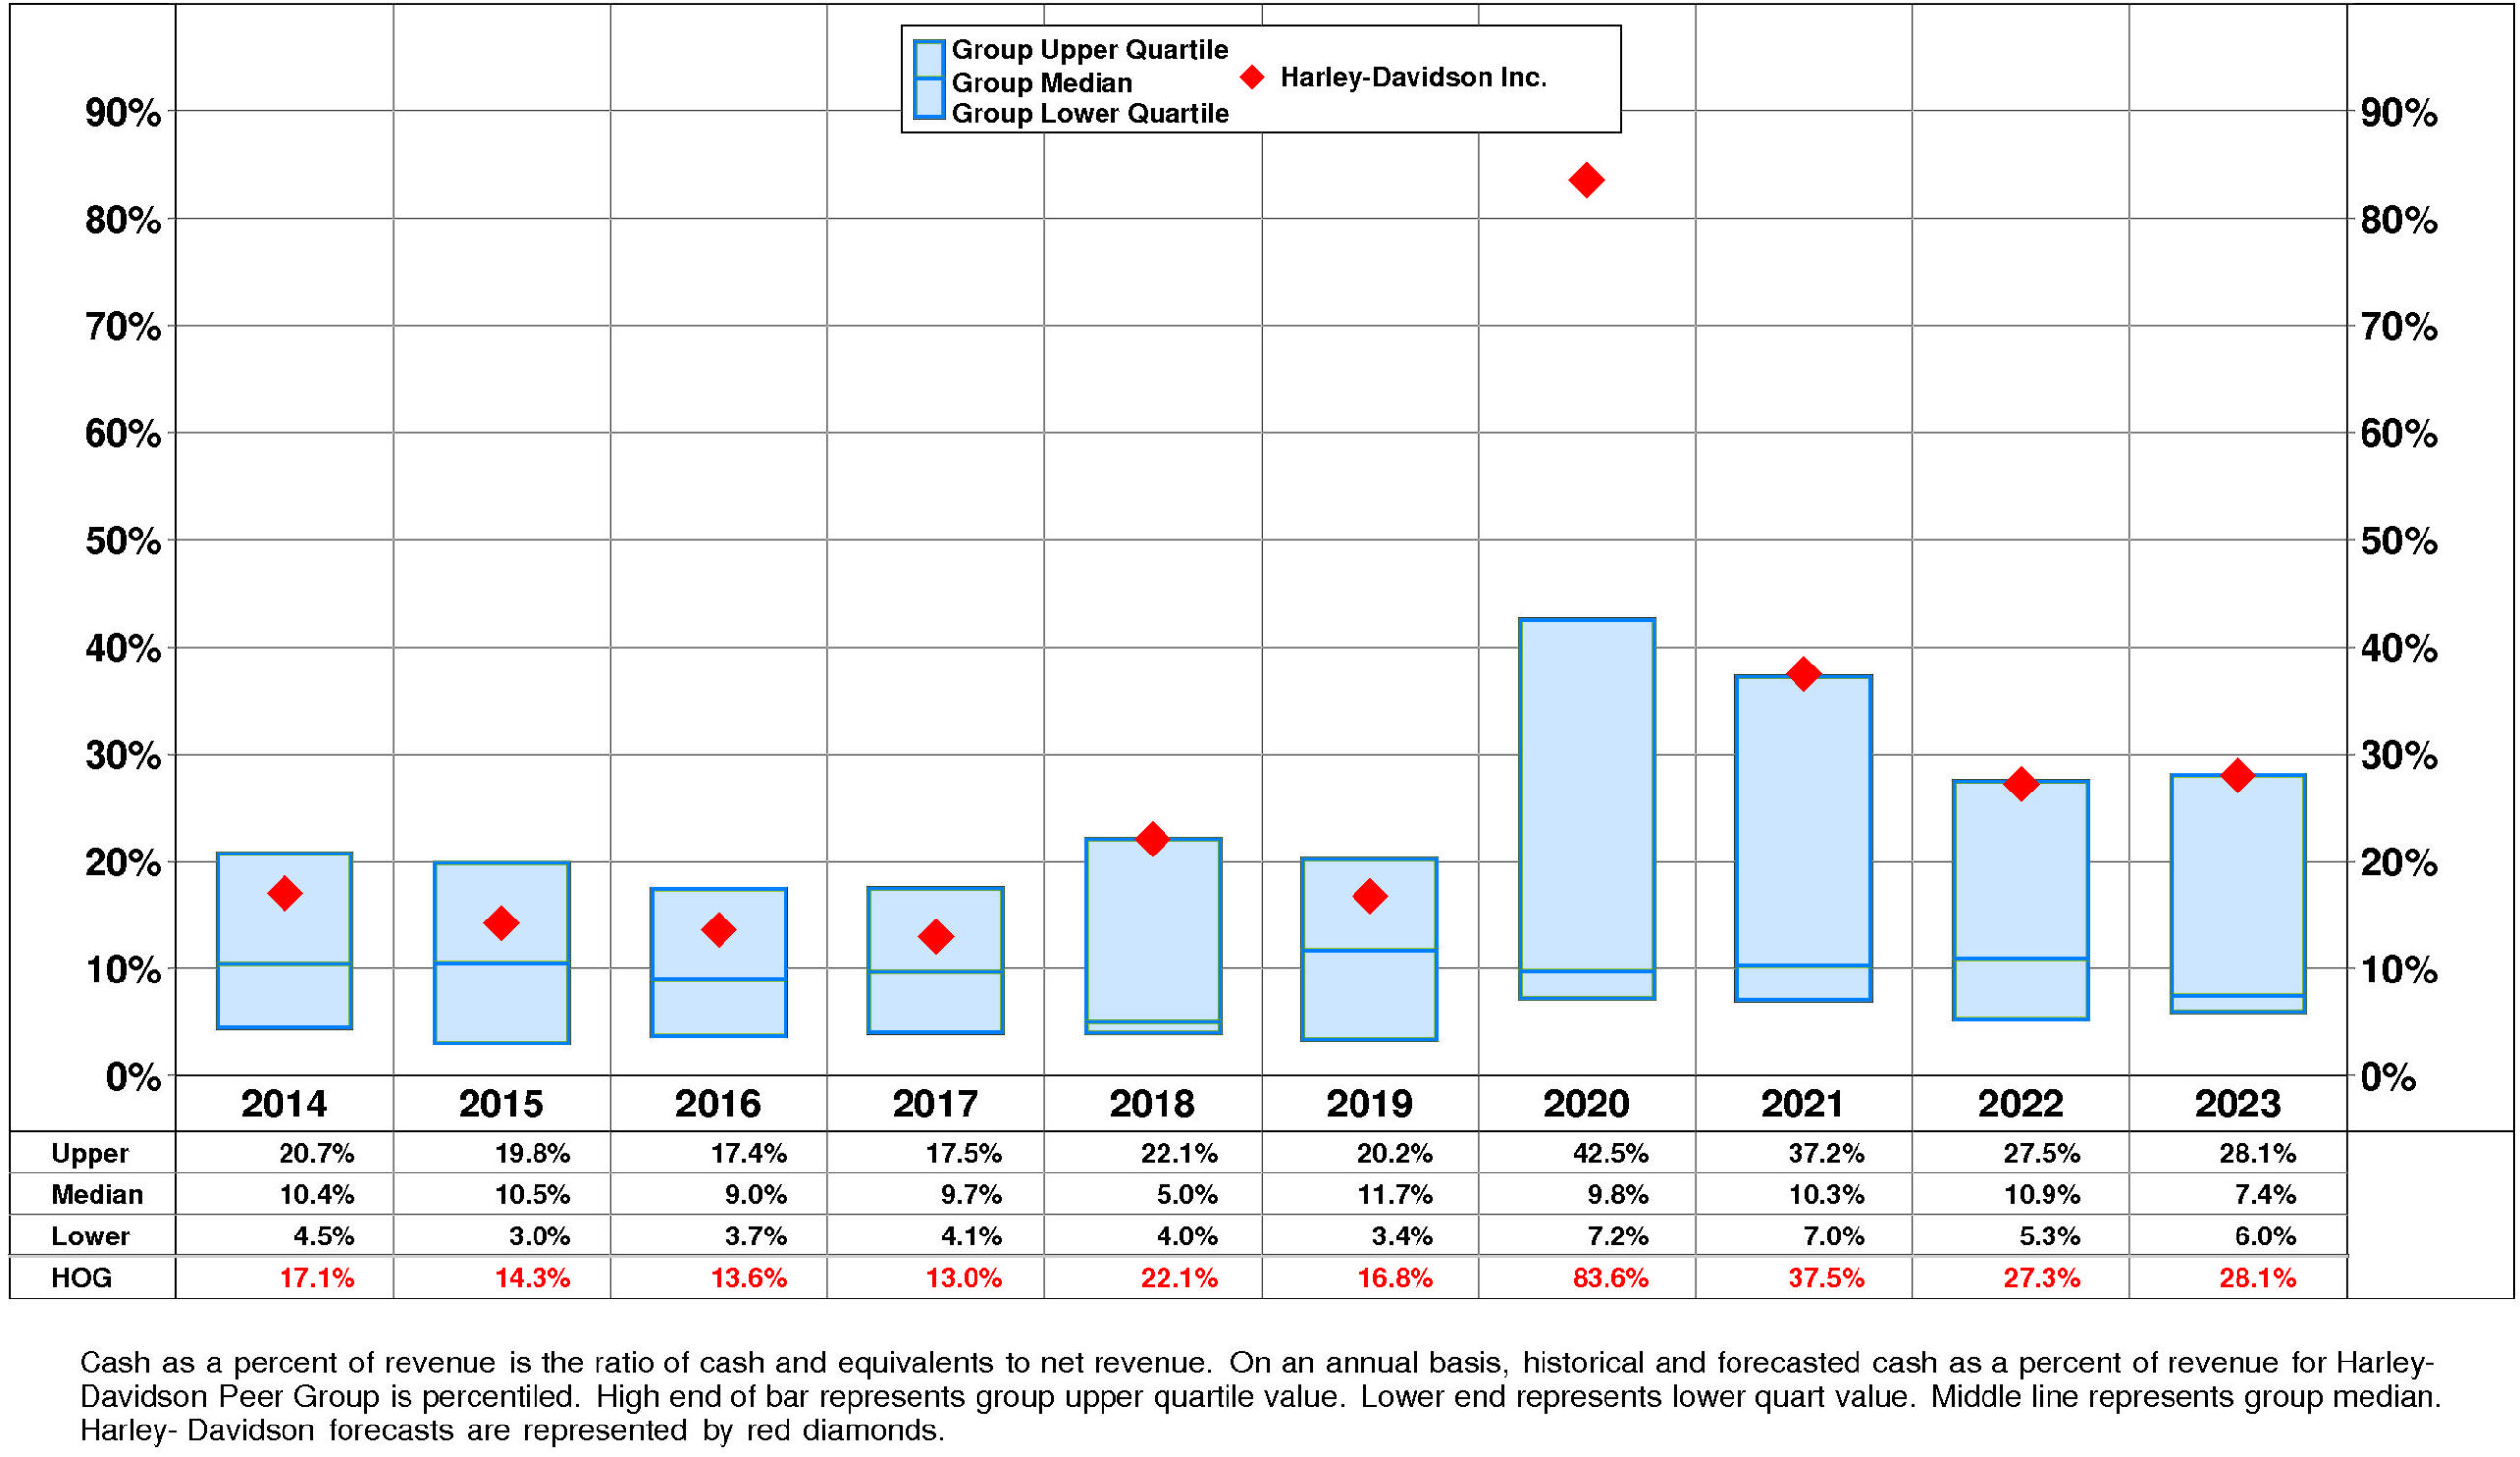
Harley-Davidson’s Cash, %Revenue has enjoyed a volatile overall uptrend over the period. This improvement was accompanied by stability for the Harley-Davidson Peer Group. (Since 2020 Cash, %Revenue has experienced a very sharp decline.) In most years, Harley-Davidson was in the second quartile and top quartile. Currently, Harley-Davidson is at the upper quartile at +28%.
PROFITABILITY
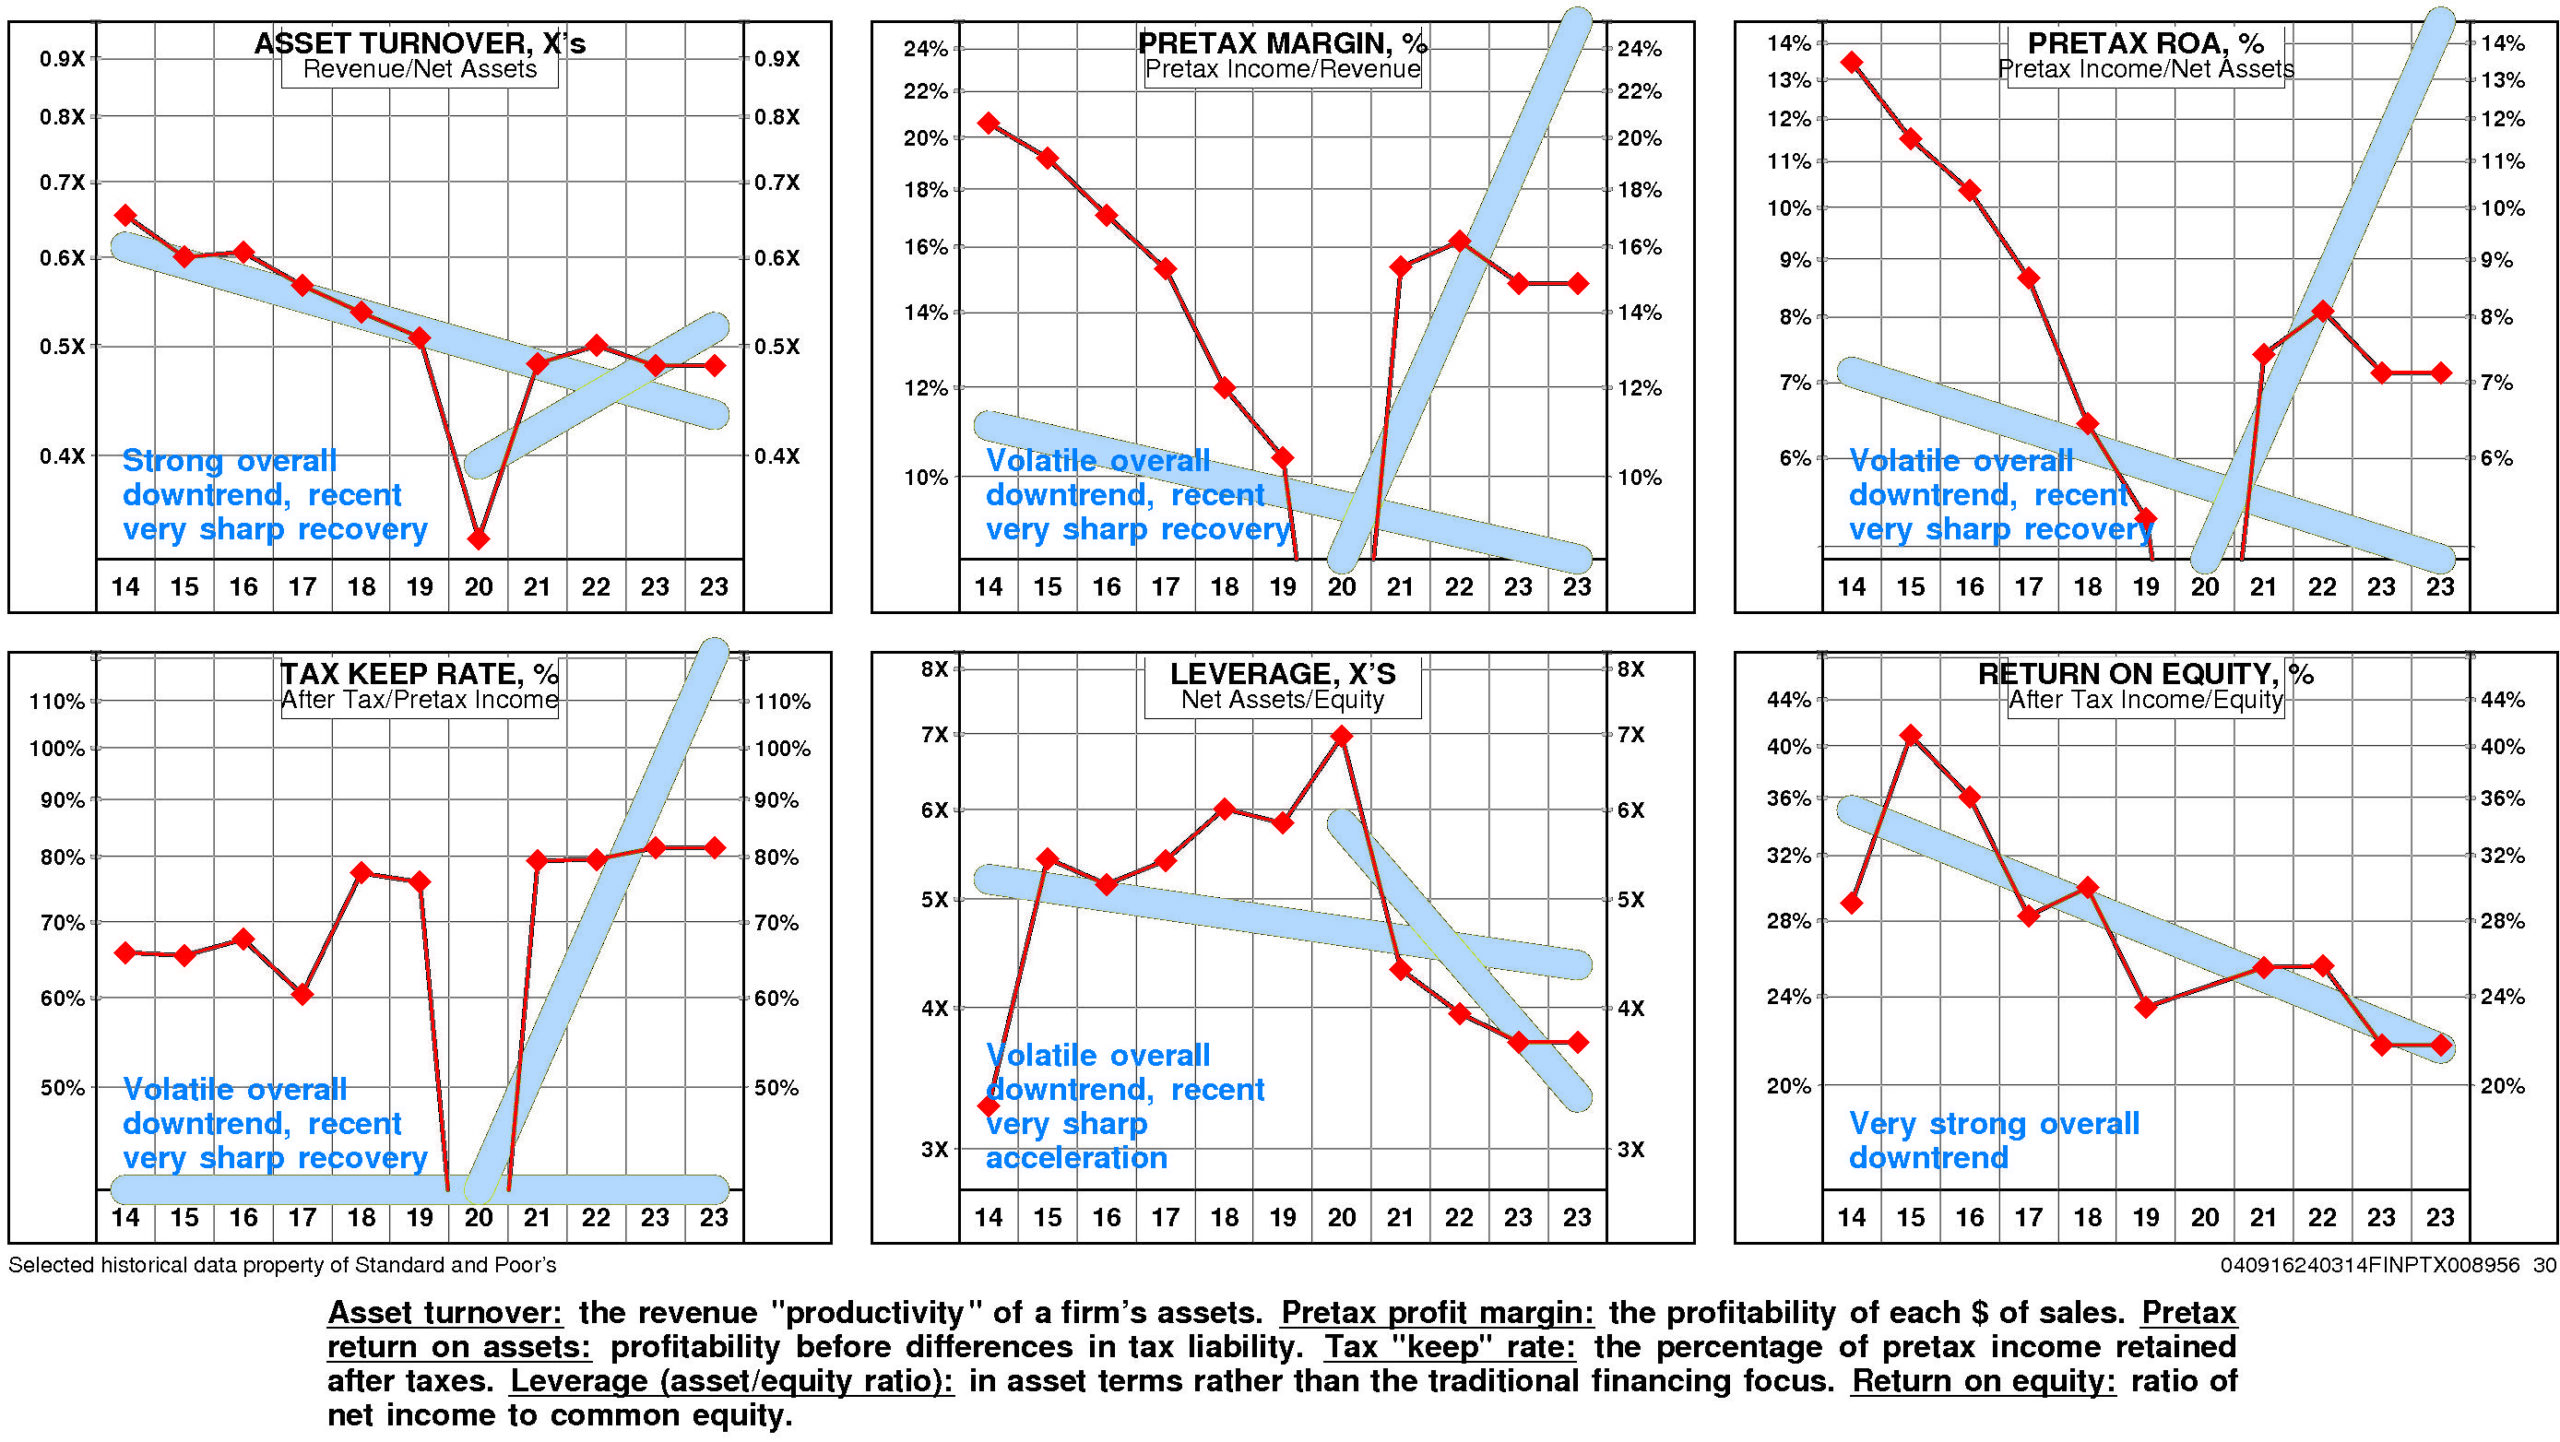
Harley-Davidson’s return on equity has eroded very significantly since 2014. The current level of 21.7% is at the low for the period and is -25.2% from the high.
Harley-Davidson’s very strong negative trend in pretax operating return significantly offset by a very strong positive trend in non-operating factors is a significant analytical factor.
The productivity of Harley-Davidson’s assets declined over the full period 2014-2023: asset turnover has suffered a strong overall downtrend but it experienced a very sharp recovery after the 2020 low.
Reinforcing this trend, pretax margin experienced a strong overall downtrend although it experienced a very sharp recovery after the 2020 low.
Non-operating factors (income taxes and financial leverage) had a very significant positive influence on return on equity.
Harley-Davidson’s return on equity is at median (21.7%) for the four quarters ended December, 2023.
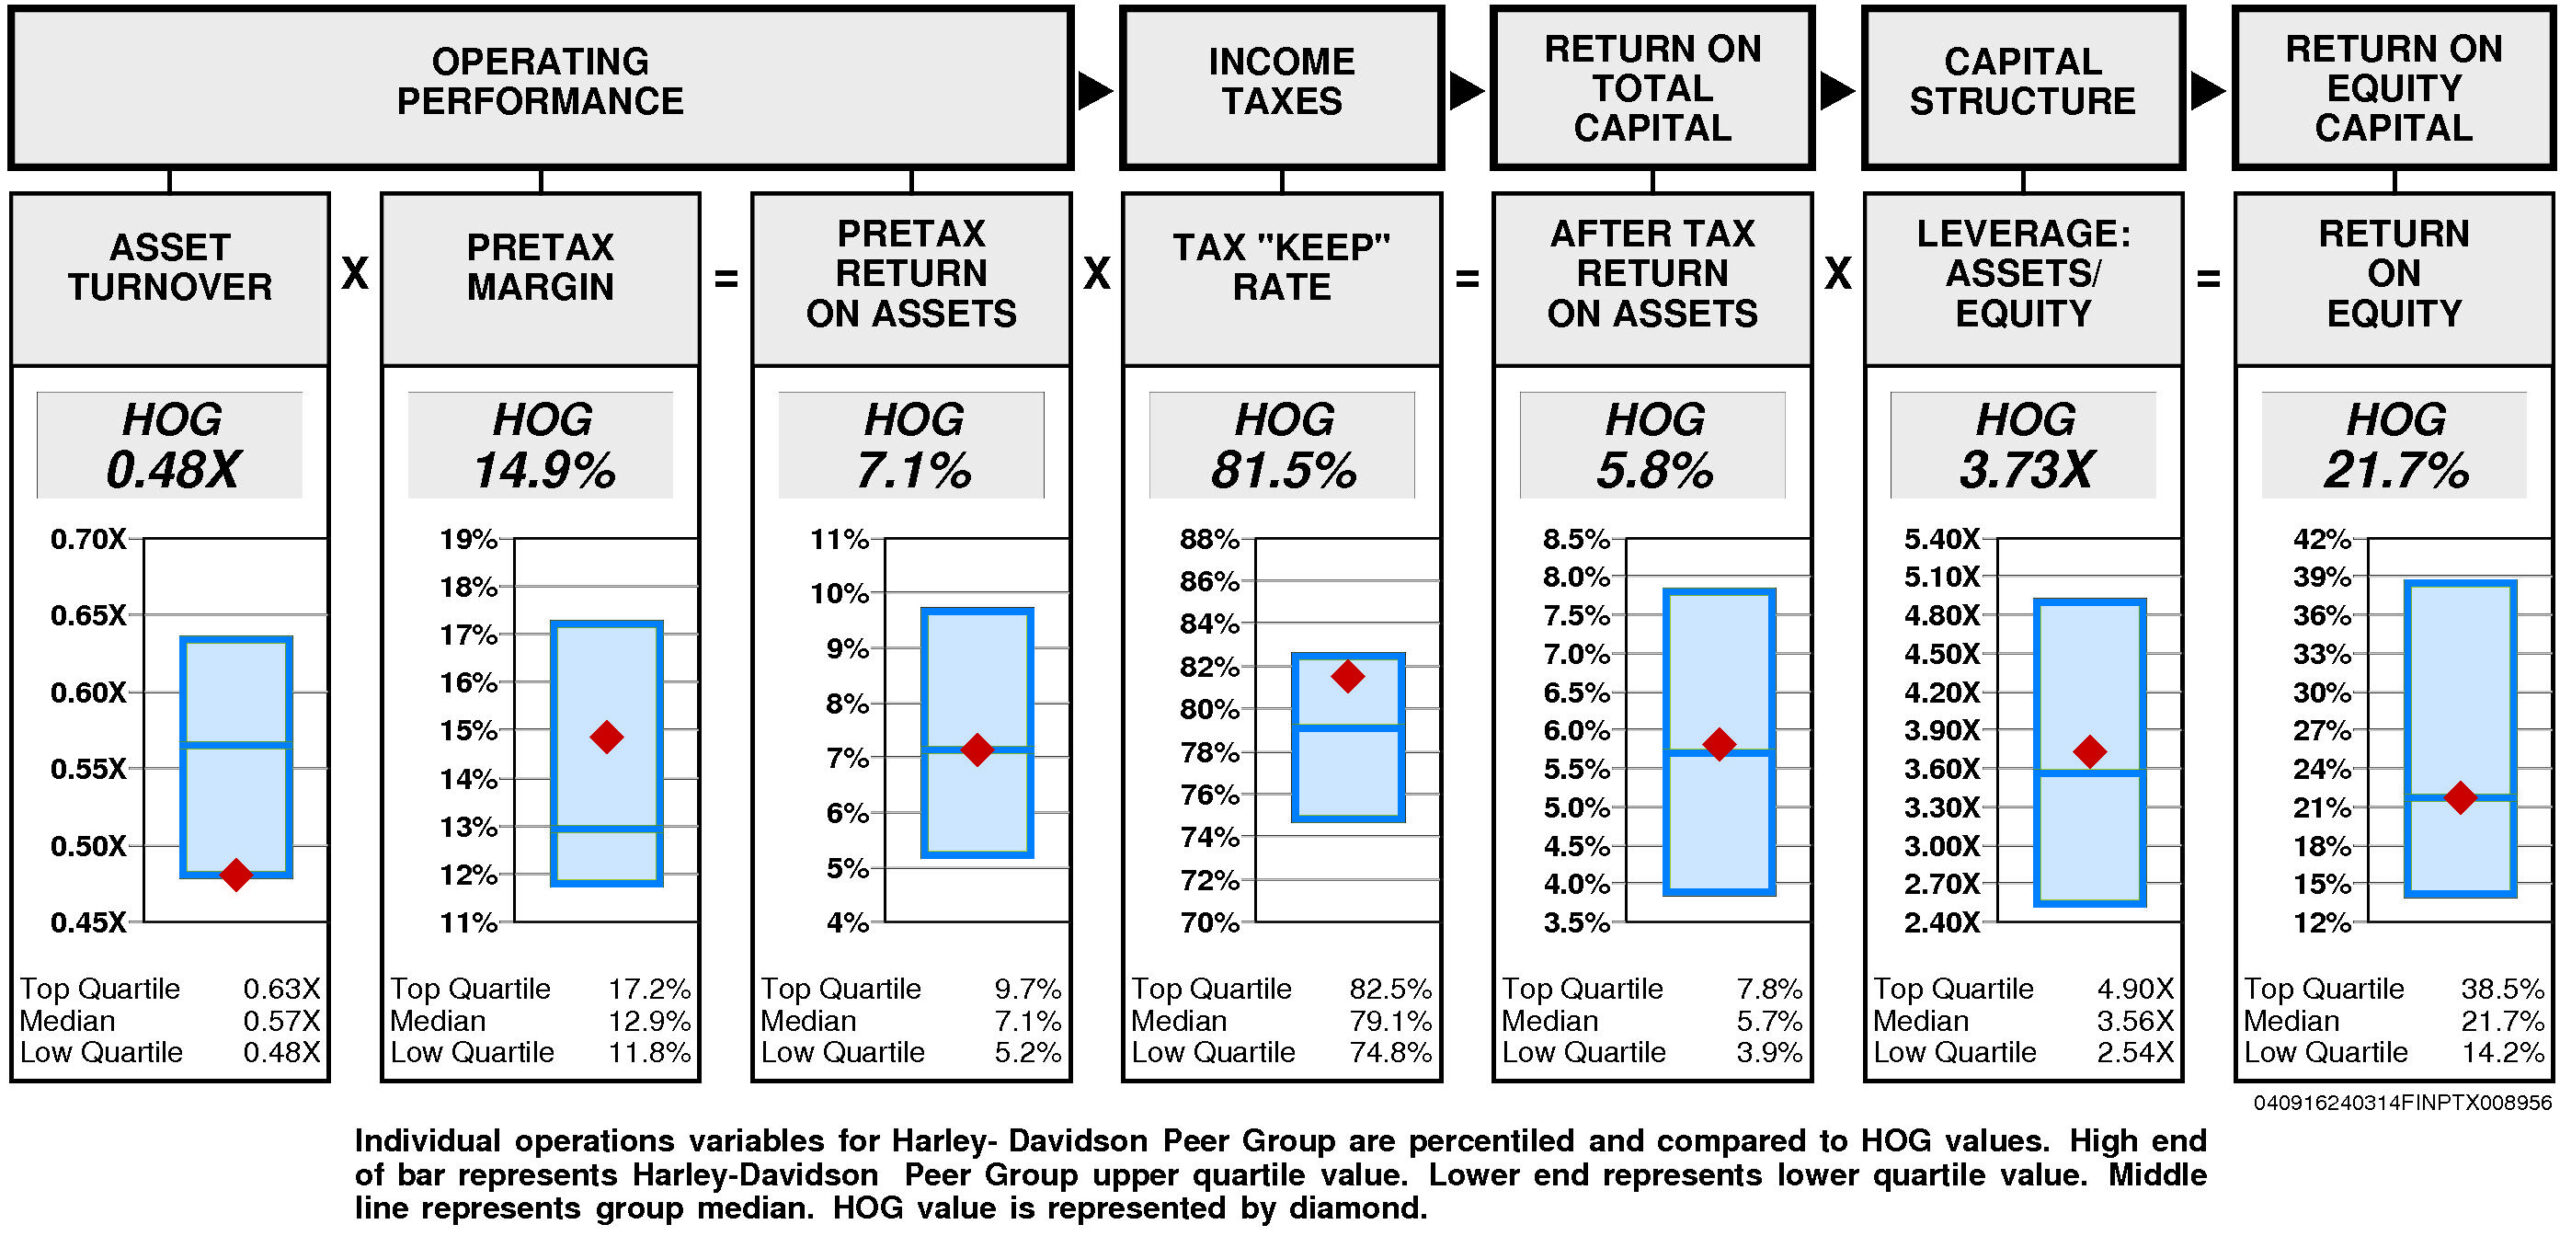
Operating performance (pretax return on assets) is at median (7.1%) reflecting asset turnover that is at the lower quartile (0.48X) and above median pretax margin (14.9%).
Tax “keep” rate (income tax management) is at the upper quartile (81.5%) resulting in after tax return on assets that is slightly above median.
Financial leverage (leverage) is slightly above median (3.73X).
GROWTH RATES
There are no significant differences between Harley-Davidson’s longer term growth and growth in recent years.
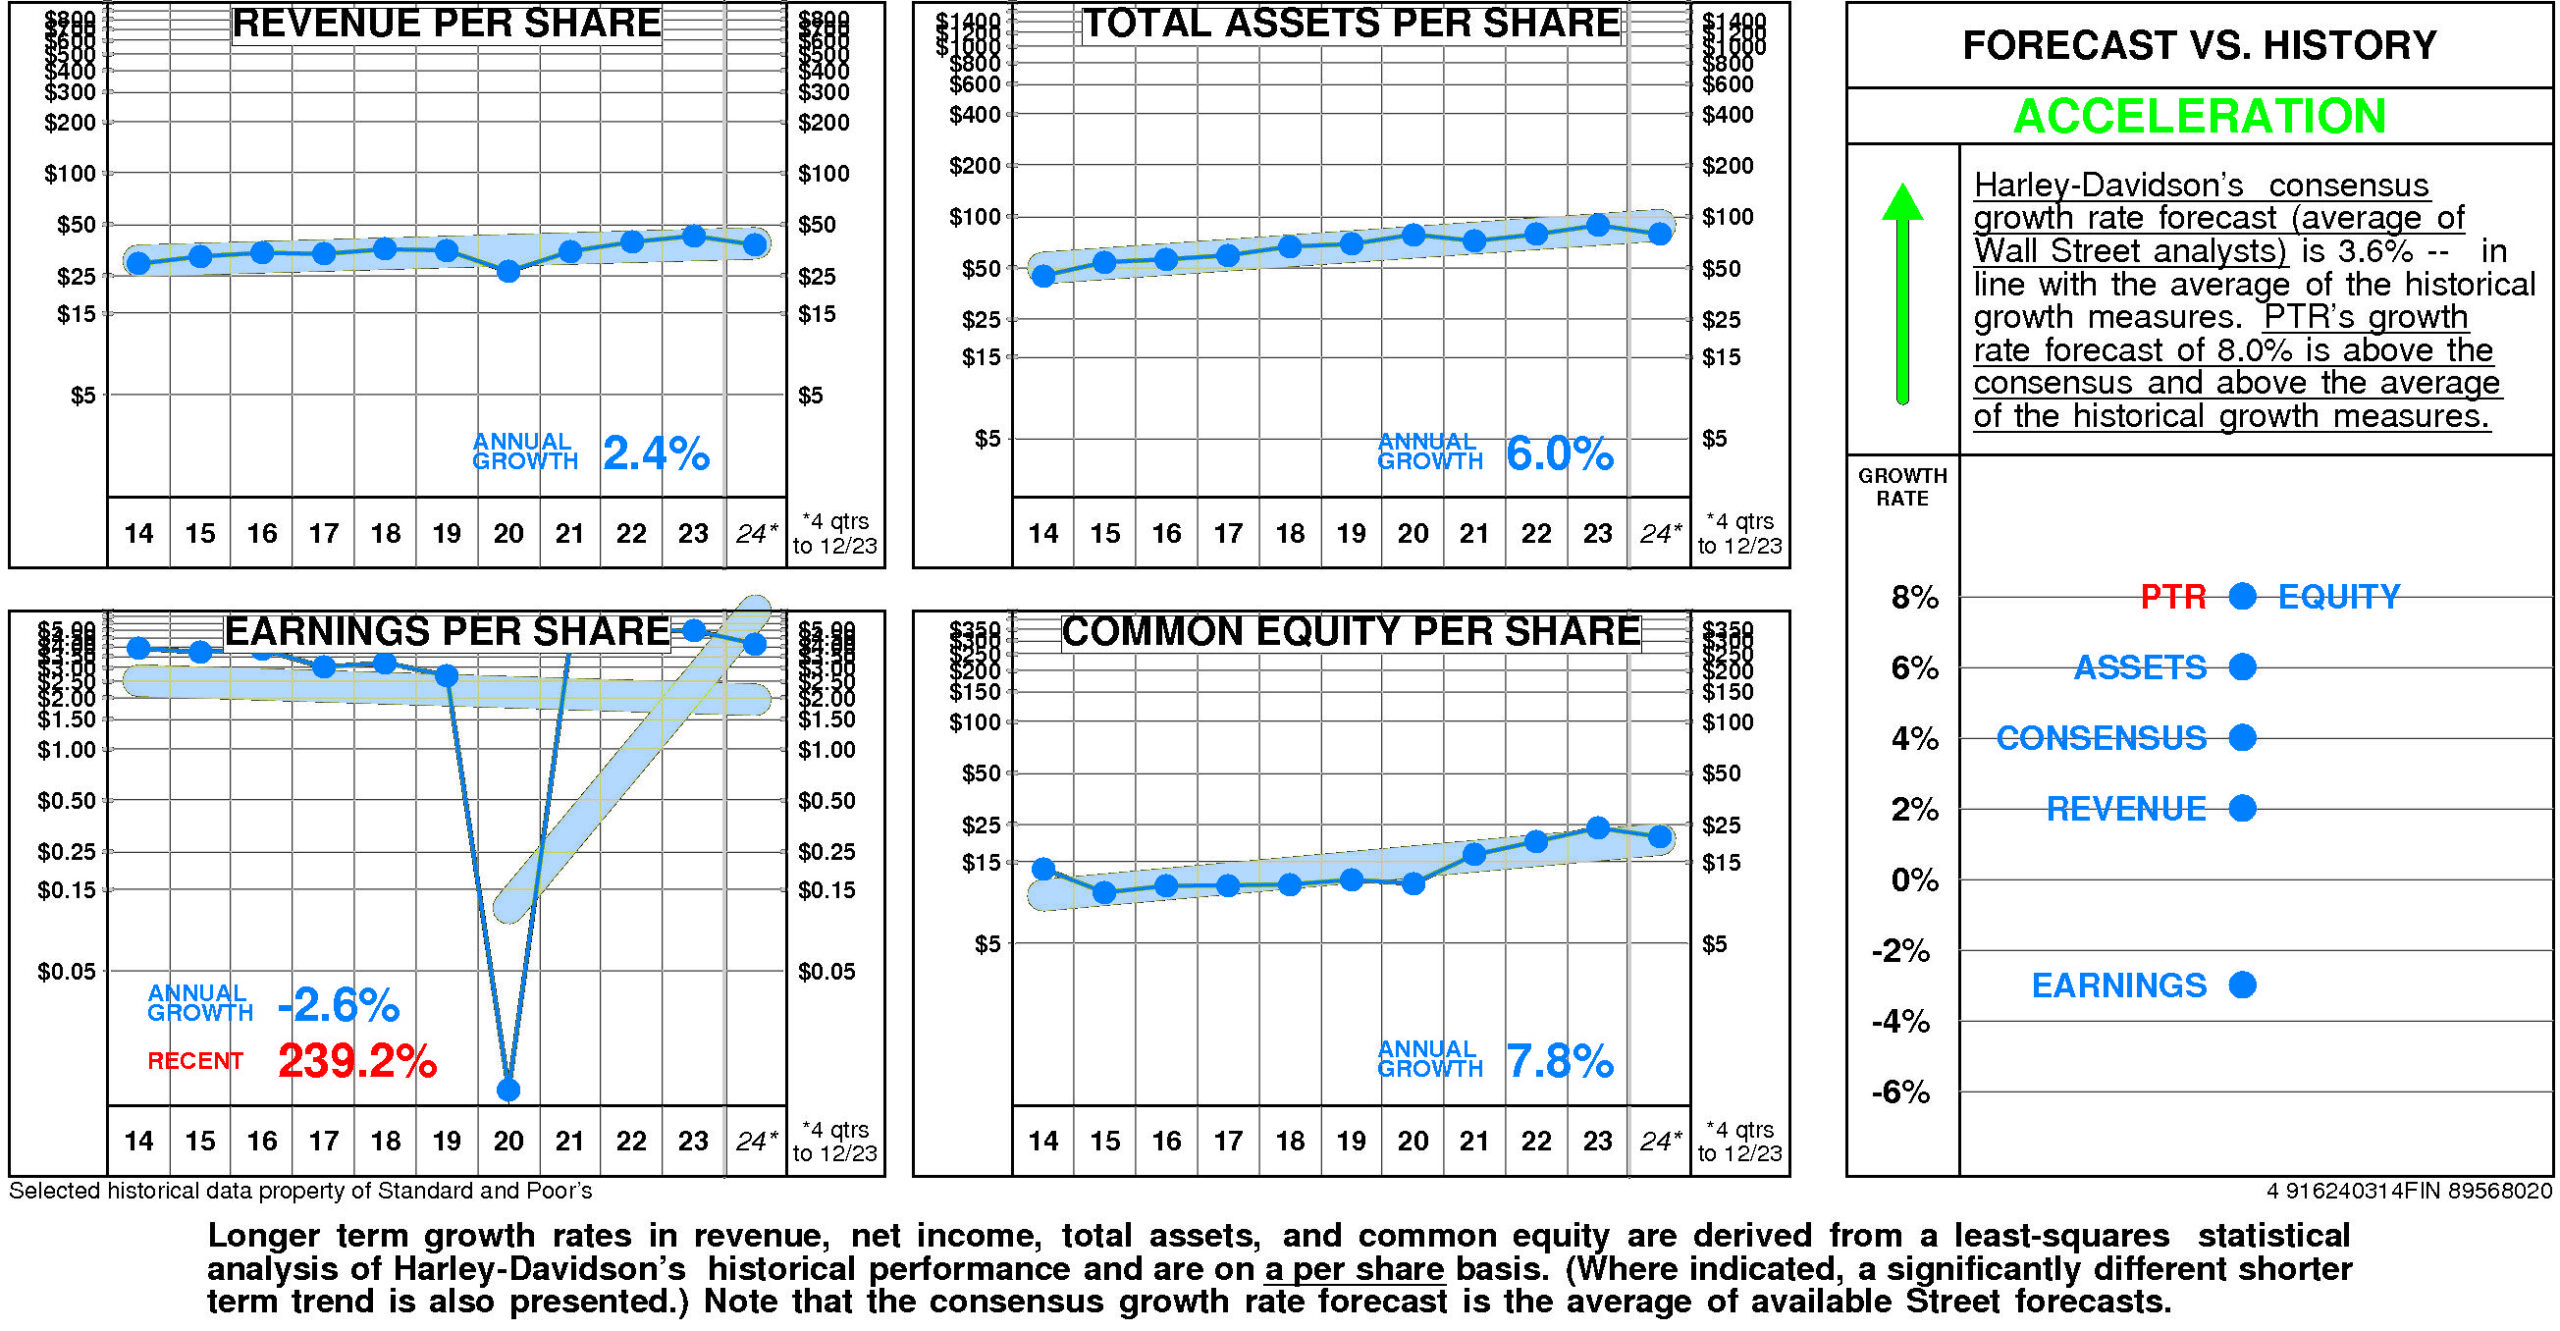
Harley-Davidson’s historical income statement growth and balance sheet growth have diverged. Revenue growth has paralleled asset growth; earnings growth has fallen short of equity growth.
Annual revenue growth has been 2.4% per year.
Total asset growth has been 6.0% per year.
Annual E.P.S. growth has been -2.6% per year. (More recently it has been 239.2%.)
Equity growth has been 7.8% per year.
Harley-Davidson’s consensus growth rate forecast (average of Wall Street analysts) is 3.6% — in line with the average of the historical growth measures.
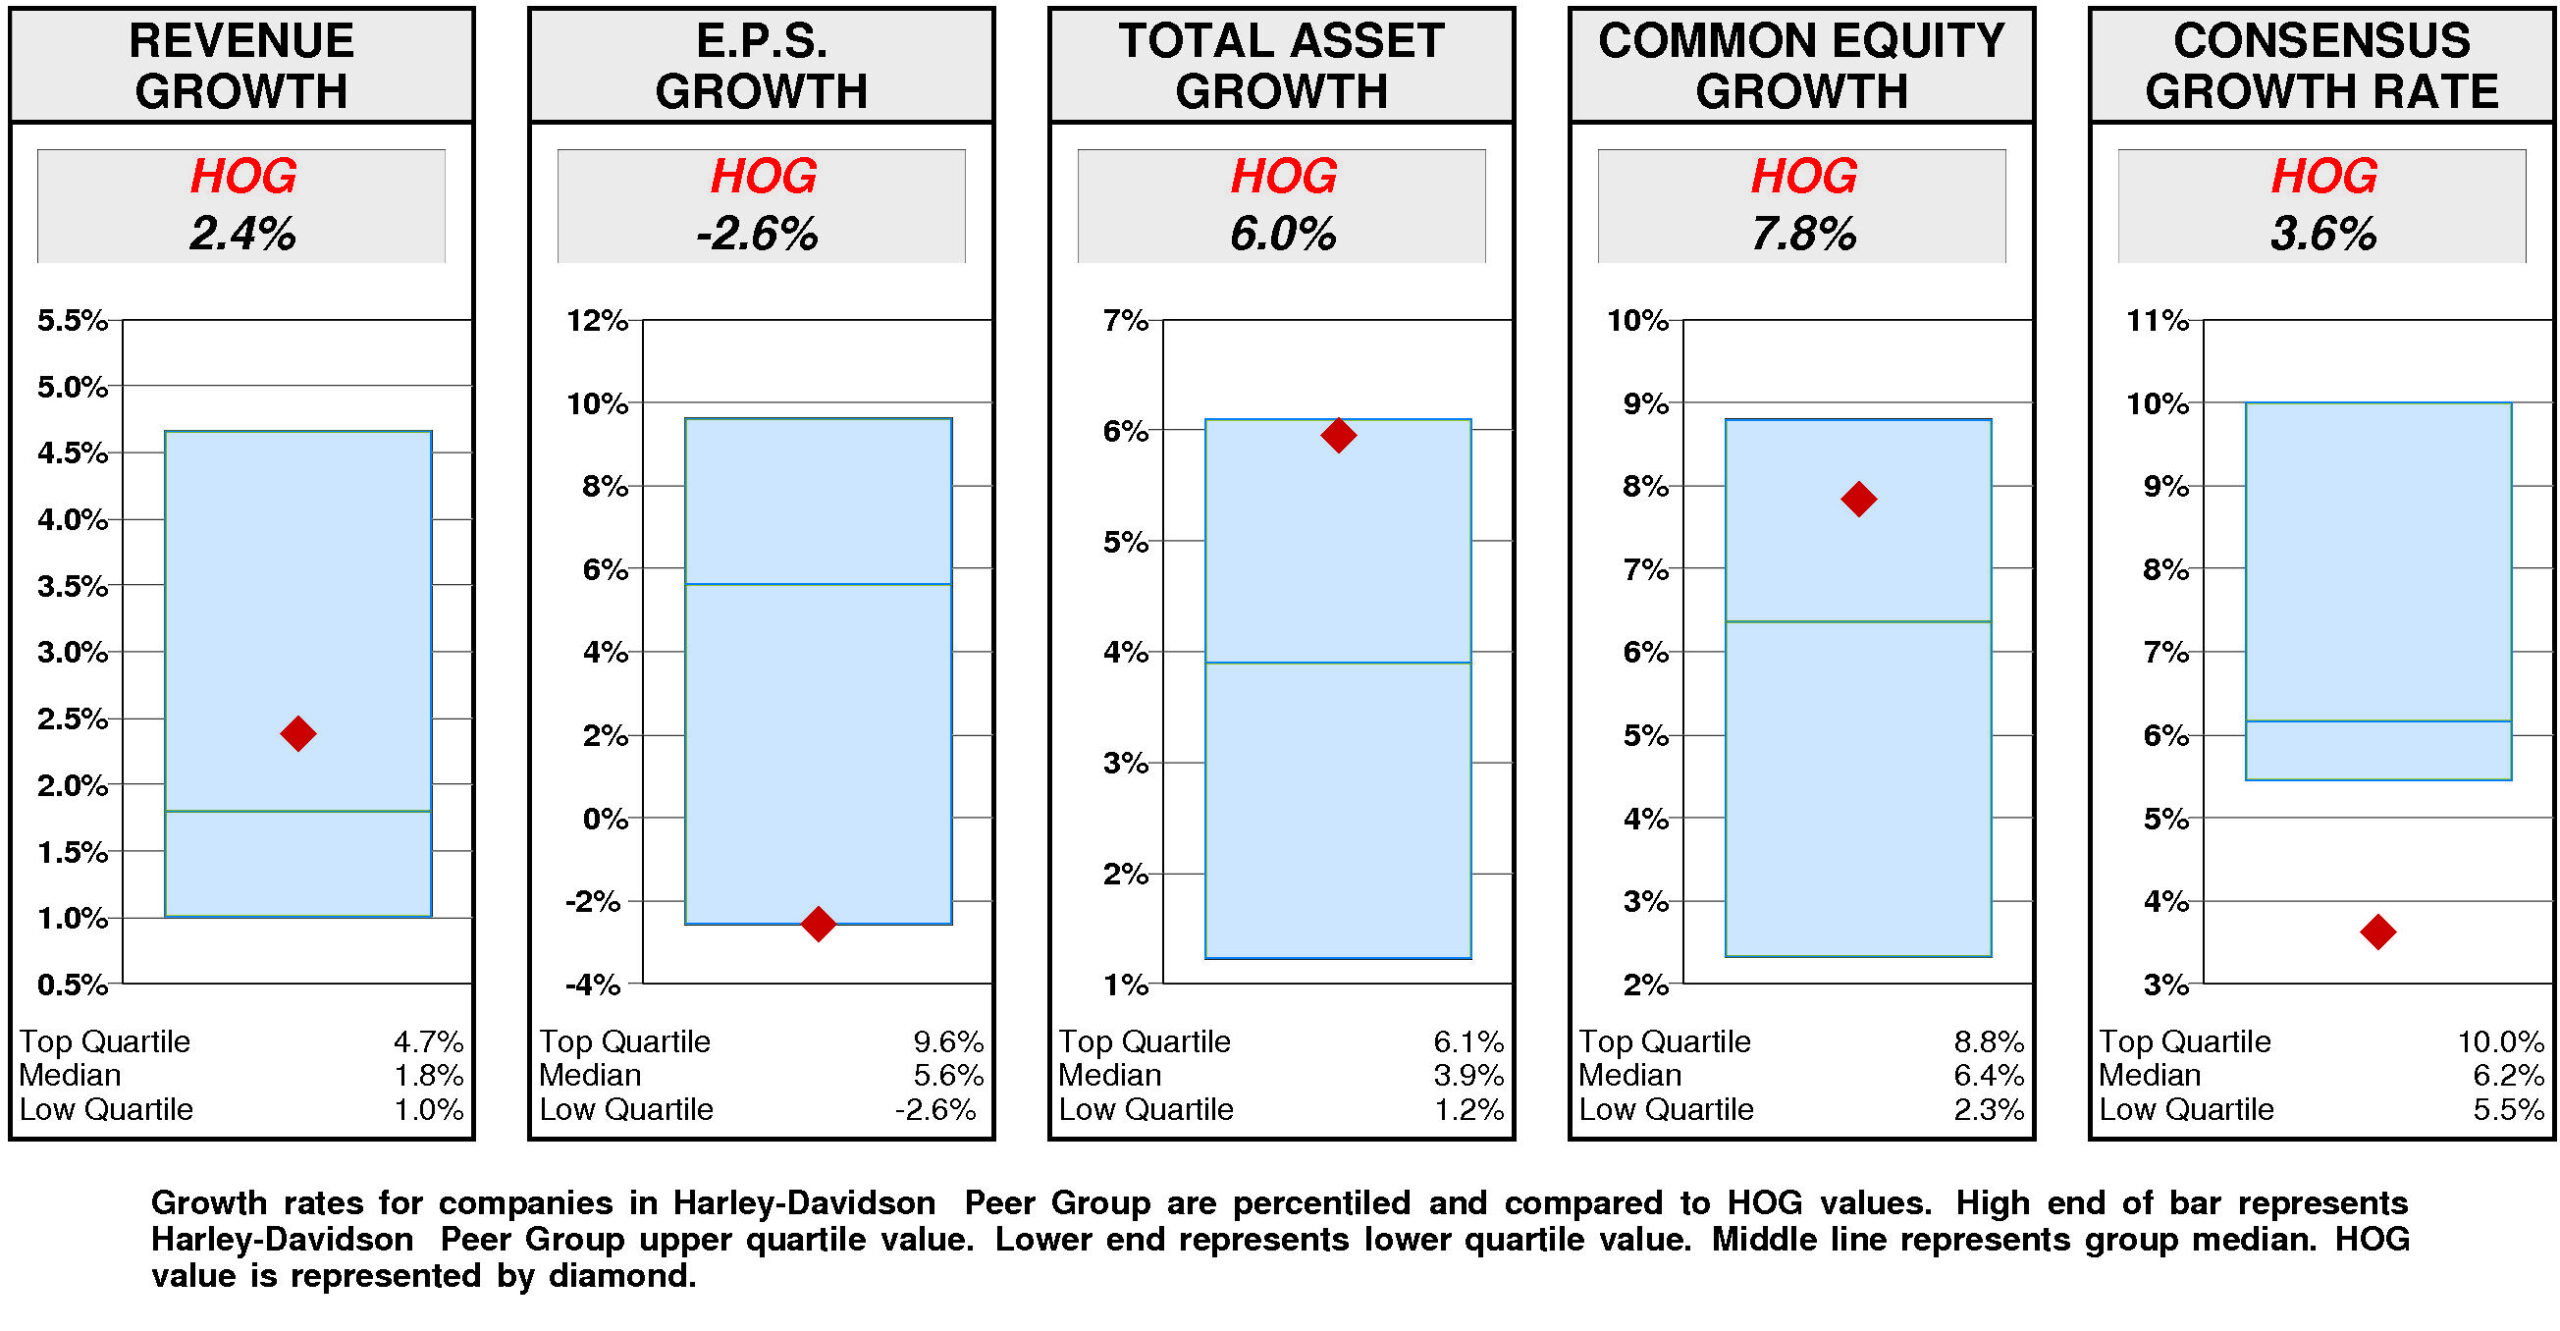
Relative to the Harley-Davidson Peer Group, Harley-Davidson’s historical growth measures are generally second quartile. Revenue growth (2.4%) has been slightly above median. Total asset growth (6.0%) has been substantially above median. Equity growth (7.8%) has been above median. E.P.S. growth (-2.6%) has been substantially below median.
In contrast, consensus growth forecast (3.6%) is lower quartile.
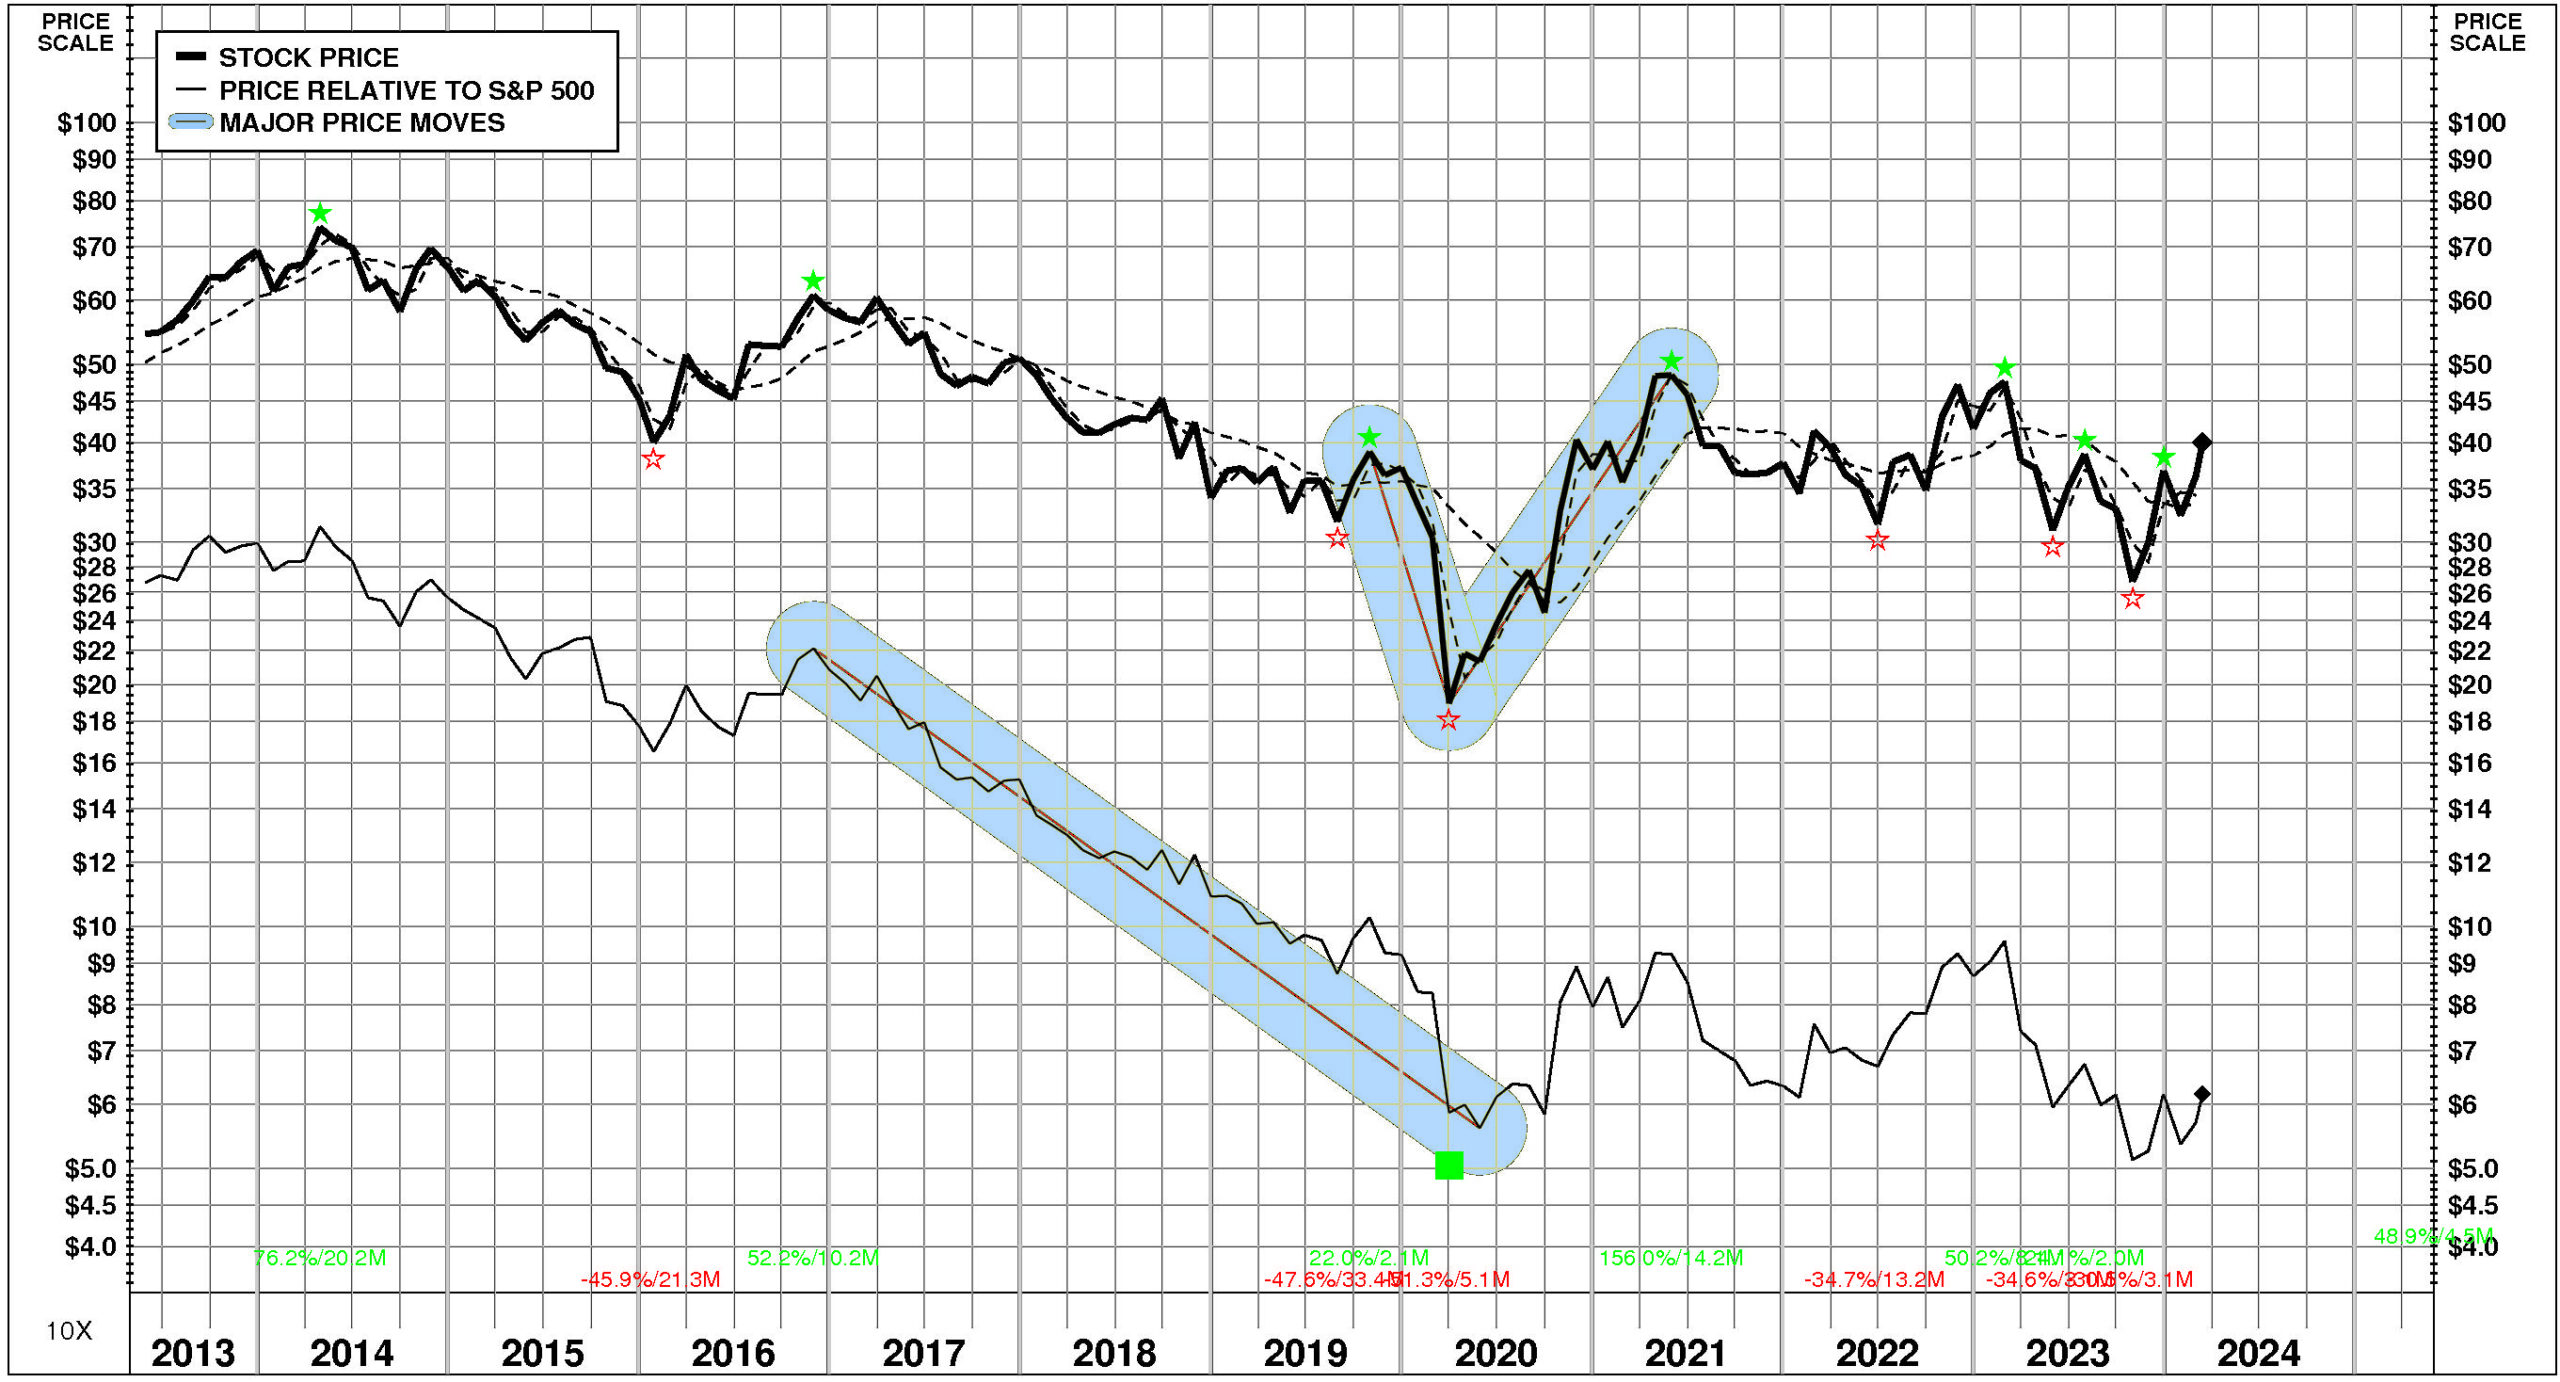
PRICE HISTORY
Over the full time period, Harley-Davidson’s stock price performance has been variable and significantly below market. Between May, 2013 and March, 2024, Harley-Davidson’s stock price fell -27%; relative to the market, this was a -77% loss. Significant price moves during the period: 1) March, 2020 – May, 2021: +156%; and 2) October, 2019 – March, 2020: -51%.
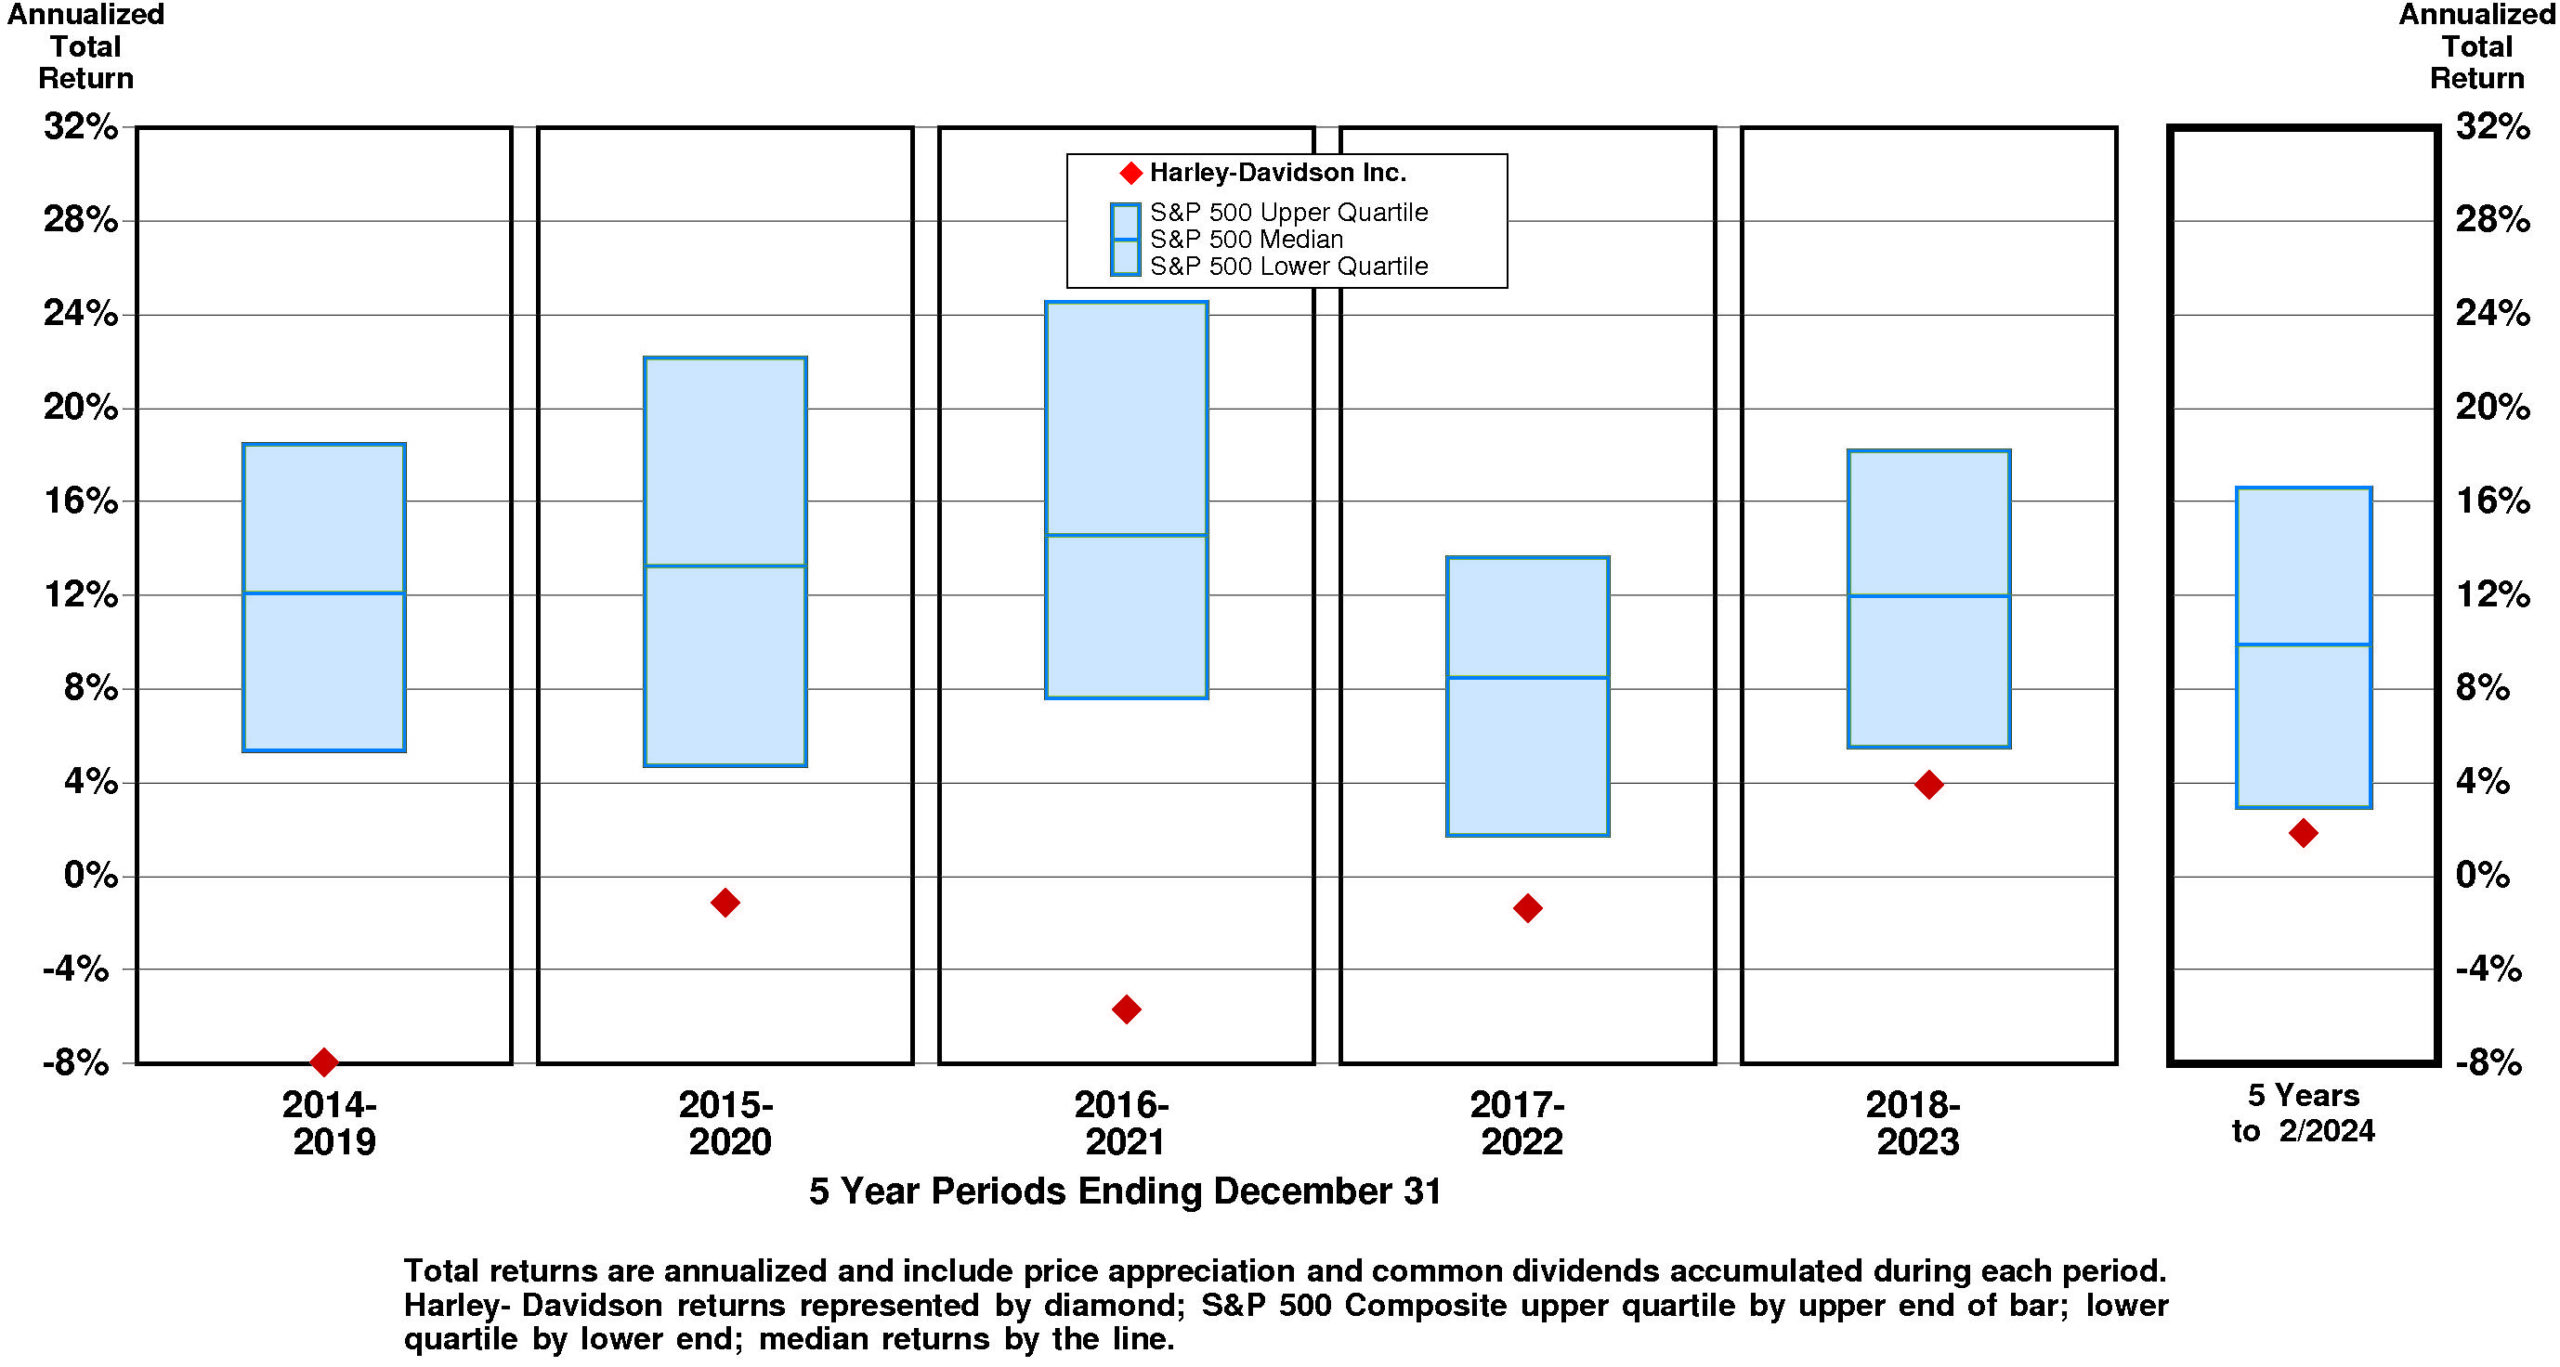
TOTAL INVESTMENT RETURNS
Current annual total return performance of -22.3% is lower quartile relative to the S&P 500 Composite.
In addition to being lower quartile relative to S&P 500 Composite, current annual total return performance through February, 2024 of -22.3% is lower quartile relative to Harley-Davidson Inc. Peer Group.
Current 5-year total return performance of 1.9% is lower quartile relative to the S&P 500 Composite.
Through February, 2024, with lower quartile current 5-year total return of 1.9% relative to S&P 500 Composite, Harley-Davidson’s total return performance is below median relative to Harley-Davidson Inc. Peer Group.
VALUATION BENCHMARKS
Relative to S&P 500 Composite, HOG’s overall valuation is quite low. The highest factor, the ratio of enterprise value/assets, is near the lower quartile. Ratio of enterprise value/revenue is near the lower quartile. Price/equity ratio is lower quartile. Ratio of enterprise value/earnings before interest and taxes is lower quartile. The lowest factor, the price/earnings ratio, is lower quartile.
Relative to Harley-Davidson Peer Group, HOG’s overall valuation is low. The highest factor, the ratio of enterprise value/revenue, is at median. Ratio of enterprise value/assets is at median. Ratio of enterprise value/earnings before interest and taxes is lower quartile. Price/equity ratio is at the lower quartile. The lowest factor, the price/earnings ratio, is lower quartile.
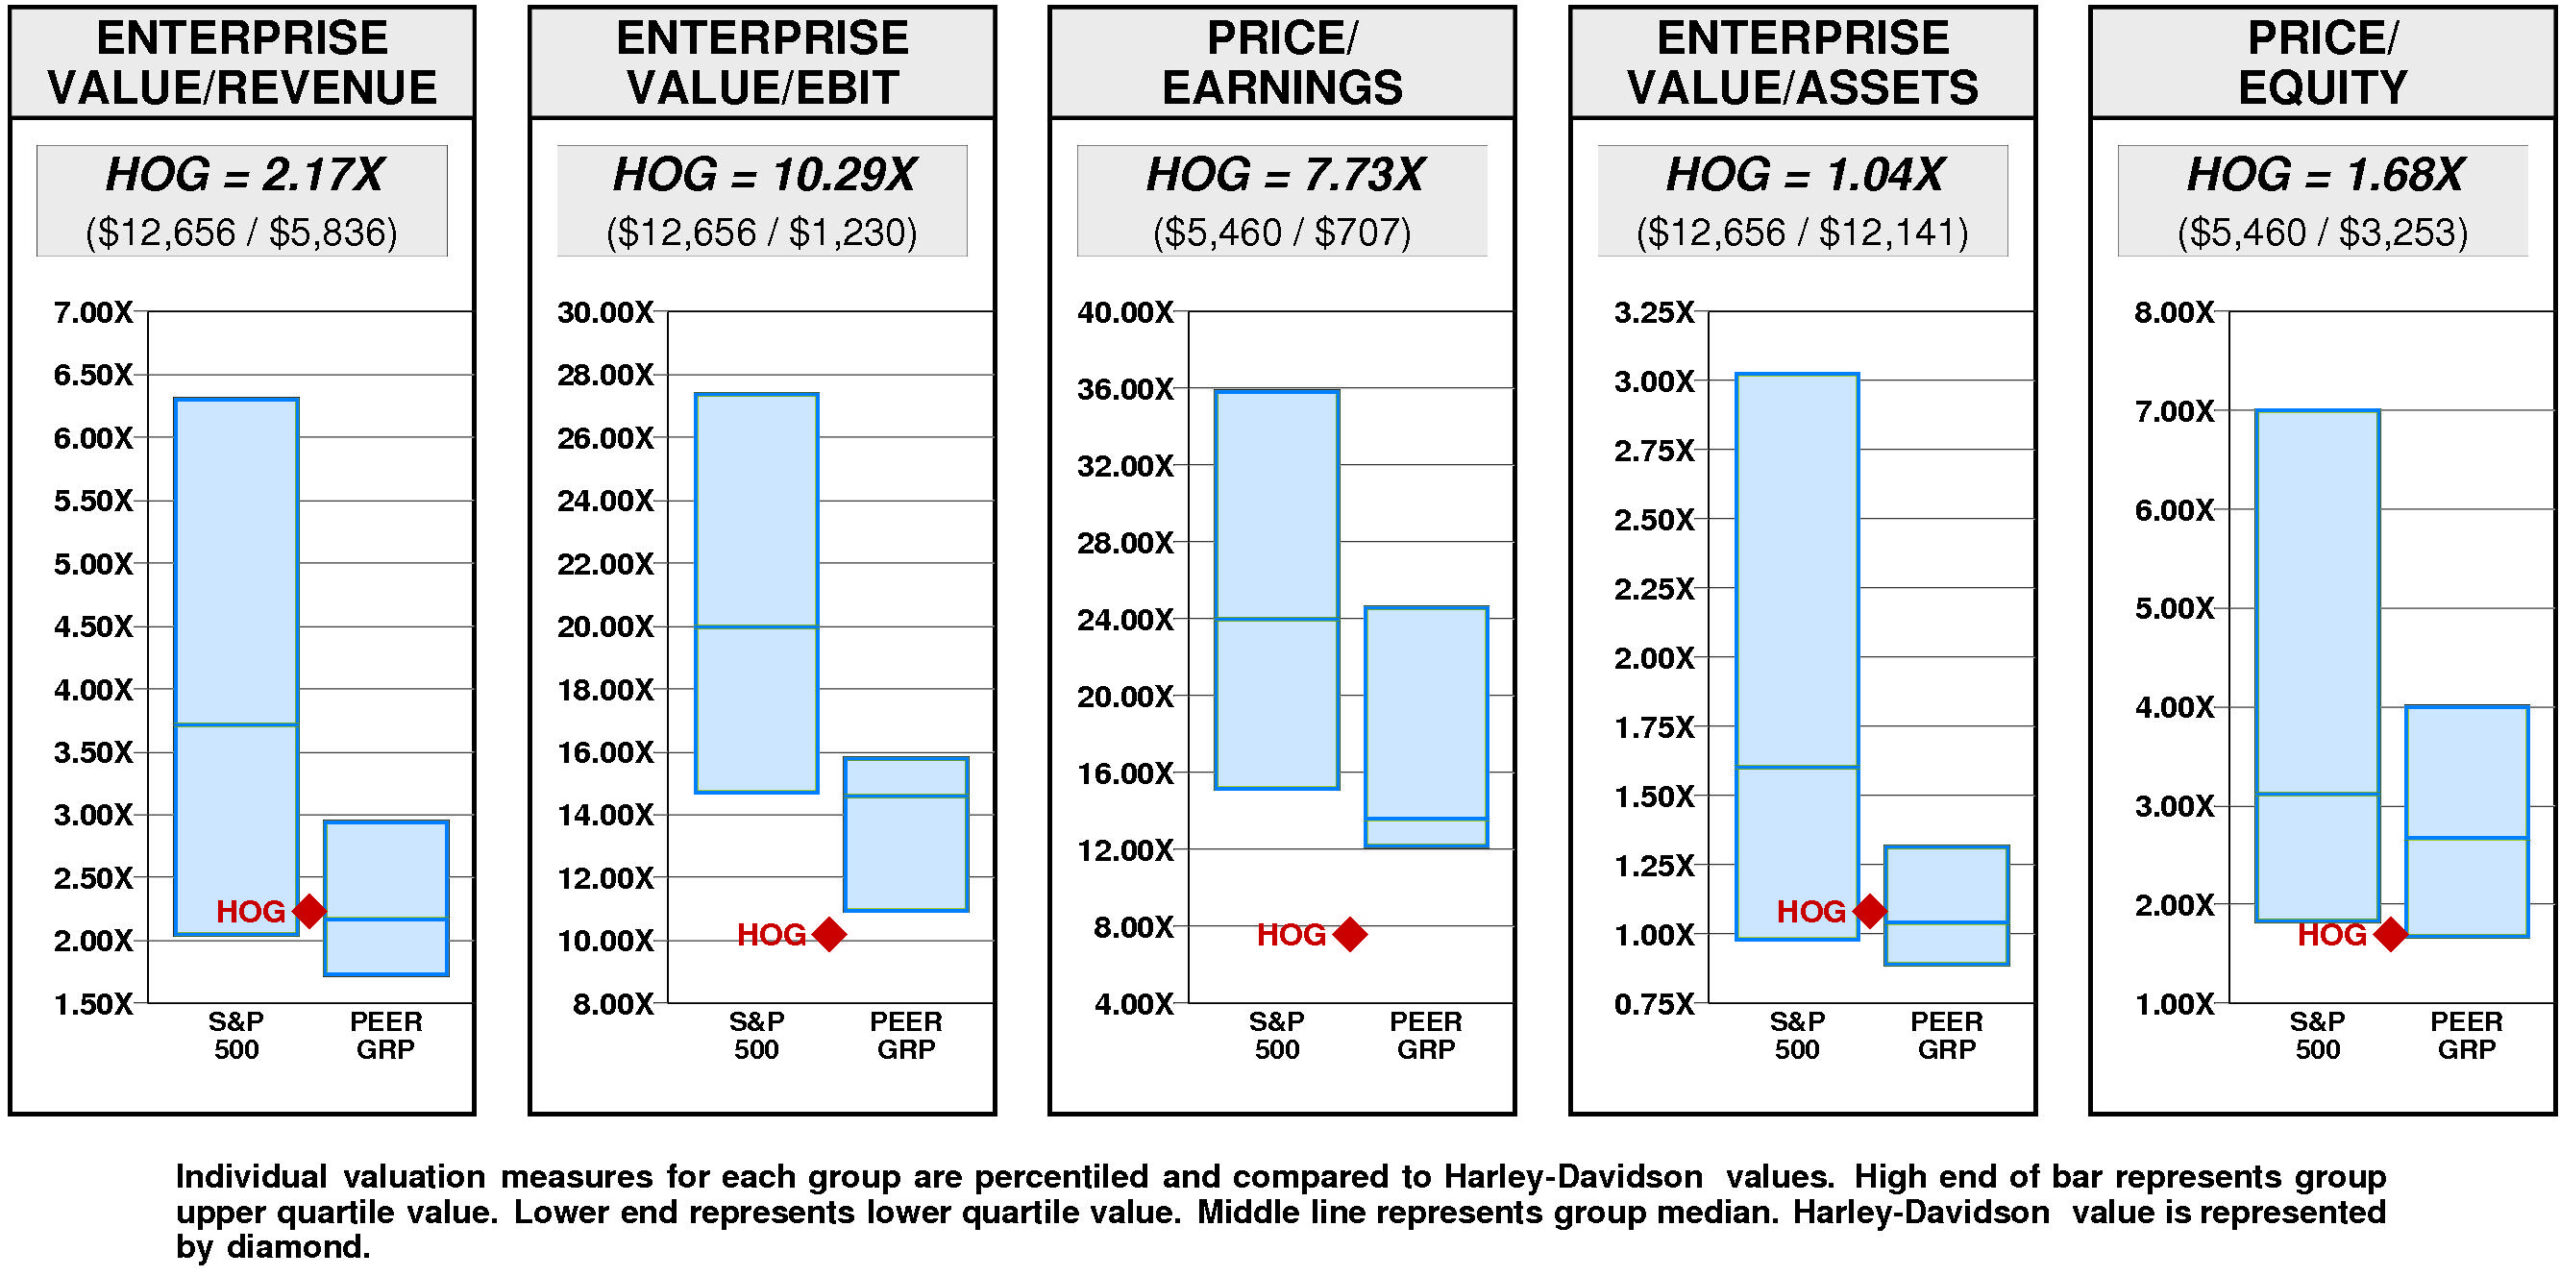
Harley-Davidson has a major value gap compared to median valuation. For HOG to fall to lower quartile valuation, its current ratio of enterprise value/revenue would have to decline from the current level of 2.17X to 1.73X. If HOG’s ratio of enterprise value/revenue were to decline to 1.73X, its stock price would be lower by $-19 to $21.
For HOG to achieve upper quartile valuation relative to the Harley-Davidson Peer Group, its current ratio of enterprise value/revenue would have to rise from the current level of 2.17X to 2.94X. If HOG’s ratio of enterprise value/revenue were to rise to 2.94X, its stock price would increase by $33 from the current level of $40.
VALUE TARGETS
HOG is expected to continue to be an important Value Builder reflecting capital returns that are forecasted to be above the cost of capital.
Harley-Davidson’s current Price Target of $80 represents a +101% change from the current price of $39.98.
This high appreciation potential results in an appreciation score of 73 (only 27% of the universe has greater appreciation potential.)
With this high Appreciation Score of 73, the neutral Power Rating of 48 results in an Value Trend Rating of C.
Harley-Davidson’s current Price Target is $80 (-8% from the 2023 Target of $87 but +101% from the 03/13/24 price of $39.98). This slight fall in the Target is the result of a +6% increase in the equity base and a -13% decrease in the price/equity multiple. The forecasted decline in growth has a large negative impact on the price/equity multiple and the forecasted decline in return on equity has a slight negative impact as well. Partially offsetting these Drivers, the forecasted decline in cost of equity has a large positive impact.
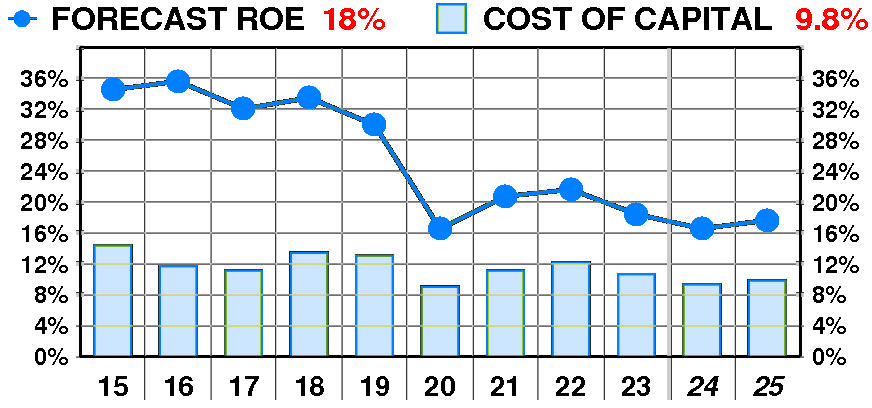
PTR’s return on equity forecast is 17.6% — slightly below our recent forecasts. Forecasted return on equity suffered a dramatic, variable decline between 2015 and 2023. The current forecast is significantly below the 2016 peak of 36%.
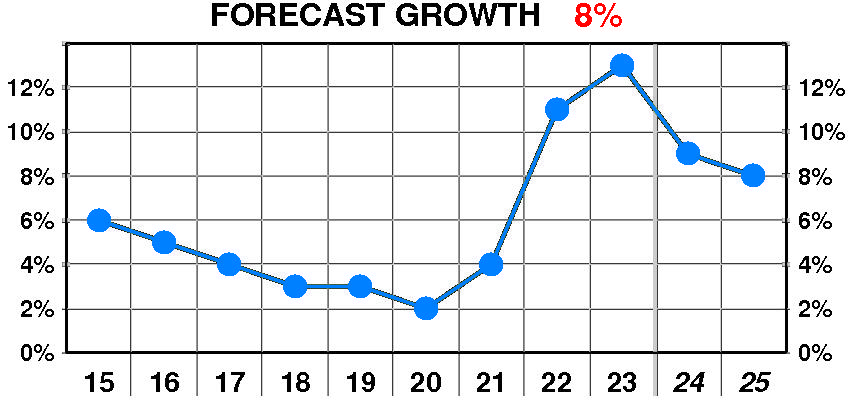
PTR’s growth forecast is 8.0% — below our recent forecasts. Forecasted growth enjoyed a dramatic, erratic increase between 2015 and 2023. The current forecast is well above the 2020 low of 2%.
PTR’s cost of equity forecast is 9.8% — slightly below recent levels. Forecasted cost of equity enjoyed a dramatic, erratic decline between 2015 and 2023. The current forecast is below the 2015 peak of 14.4%.
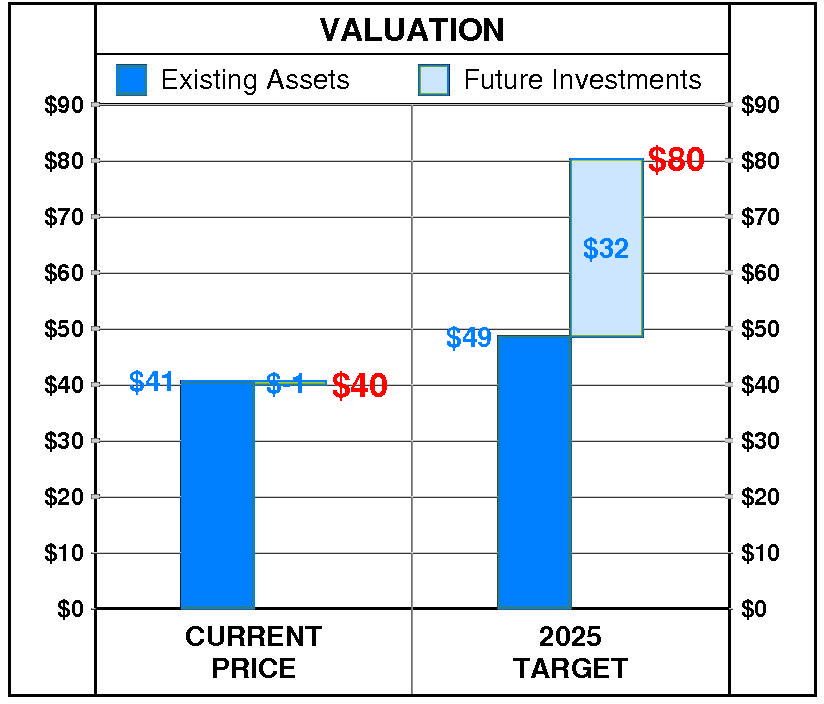
At Harley-Davidson’s current price of $39.98, investors are placing a negative value of $-1 on its future investments. This view is not supported by the company’s most recent performance that reflected a growth rate of 13.0% per year, and a return on equity of 18.4% versus a cost of equity of 10.7%.
PTR’s 2025 Price Target of $80 is based on these forecasts and reflects an estimated value of existing assets of $49 and a value of future investments of $32.
Be the first to comment