![]()
BUSINESS
HEICO Corporation, through its subsidiaries, designs, manufactures, and sells aerospace, defense, and electronic related products and services in the United States and internationally. The company’s Flight Support Group segment provides jet engine and aircraft component replacement parts; thermal insulation blankets and parts; renewable/reusable insulation systems; and specialty components. This segment also distributes hydraulic, pneumatic, structural, interconnect, mechanical, and electro-mechanical components for the commercial, regional, and general aviation markets; and offers repair and overhaul services for jet engine and aircraft component parts, avionics, instruments, composites, and flight surfaces of commercial aircraft, as well as for avionics and navigation systems, subcomponents, and other instruments utilized on military aircraft.
INVESTMENT RATING
With future capital returns forecasted to be above the cost of capital, HEI is expected to continue to be an important Value Builder.
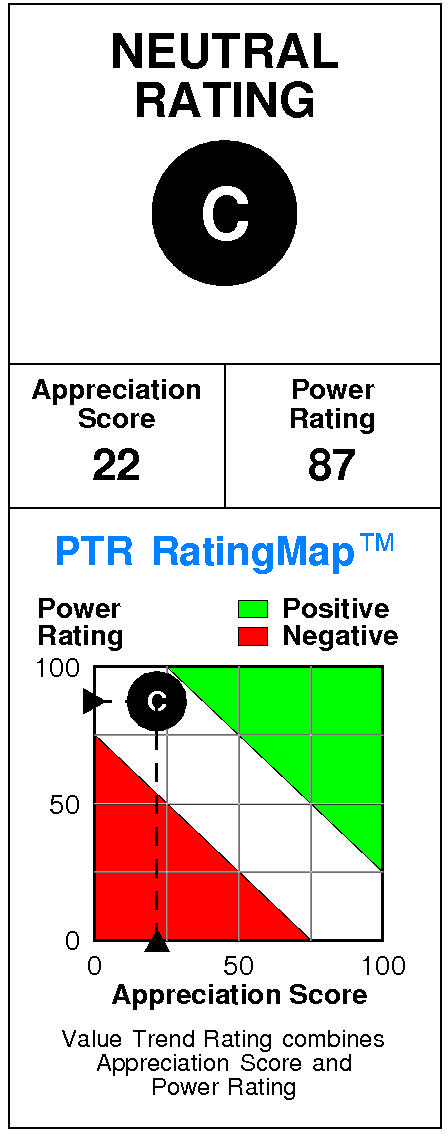
HEICO has a current Value Trend Rating of C (Neutral).
With this rating, PTR’s two proprietary measures of a stock’s current attractiveness are providing very contradictory signals. HEICO has a poor Appreciation Score of 22 but a very high Power Rating of 87, and the Neutral Value Trend Rating results.
HEICO’s stock is selling significantly above targeted value. The current stock price of $187.79 compares to targeted value 12 months forward of $120.
HEICO’s low appreciation potential results in an appreciation score of 22 (78% of the universe has greater appreciation potential.)
HEICO has a Power Rating of 87. (HEICO’s very high Power Rating indicates that it has a higher likelihood of achieving favorable investment performance over the near to intermediate term than all but 13% of companies in the universe.)
Factors contributing to this very high Power Rating include: the recent trend in HEICO’s earnings estimates has been extremely favorable; the Aircraft Engine, Engine Parts comparison group is in an extremely strong phase currently; and recent price action has been favorable.
INVESTMENT PROFILE
HEICO’s financial strength is exceptional. Financial strength rating is 97.
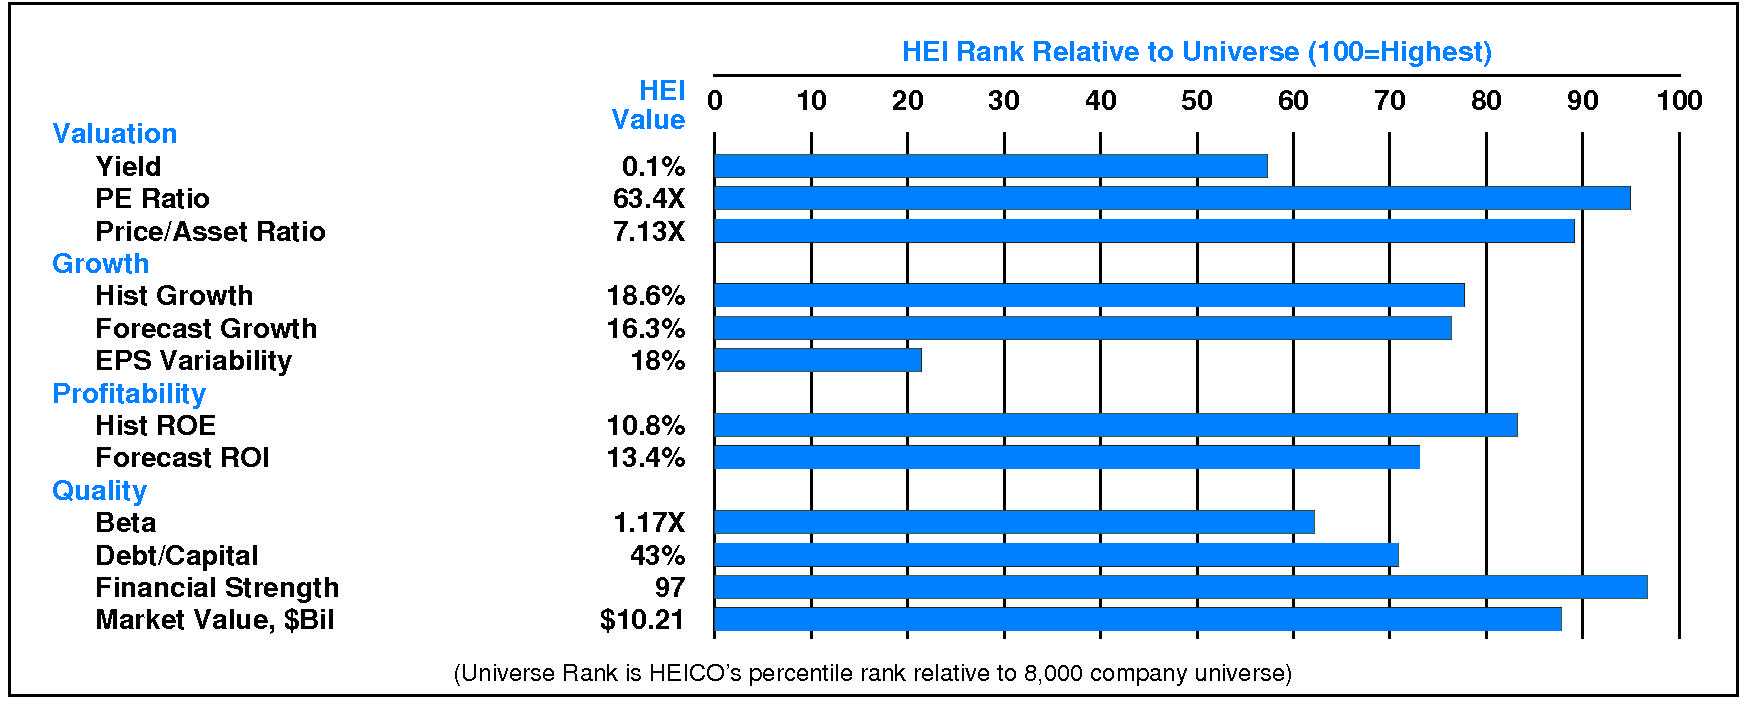
Relative to the S&P 500 Composite, HEICO Corp has moderate Growth characteristics; its appeal is likely to be to Capital Gain-oriented investors; the perception is that HEI is lower risk. All factors are relative strengths. HEICO’s valuation is high: low dividend yield, high P/E ratio, and high price/book ratio. HEI has unusually low market capitalization.
CURRENT SIGNALS
HEICO’s current operations are eroding. Return on equity is falling, reflecting: falling asset utilization; declining pretax margin; and falling leverage.
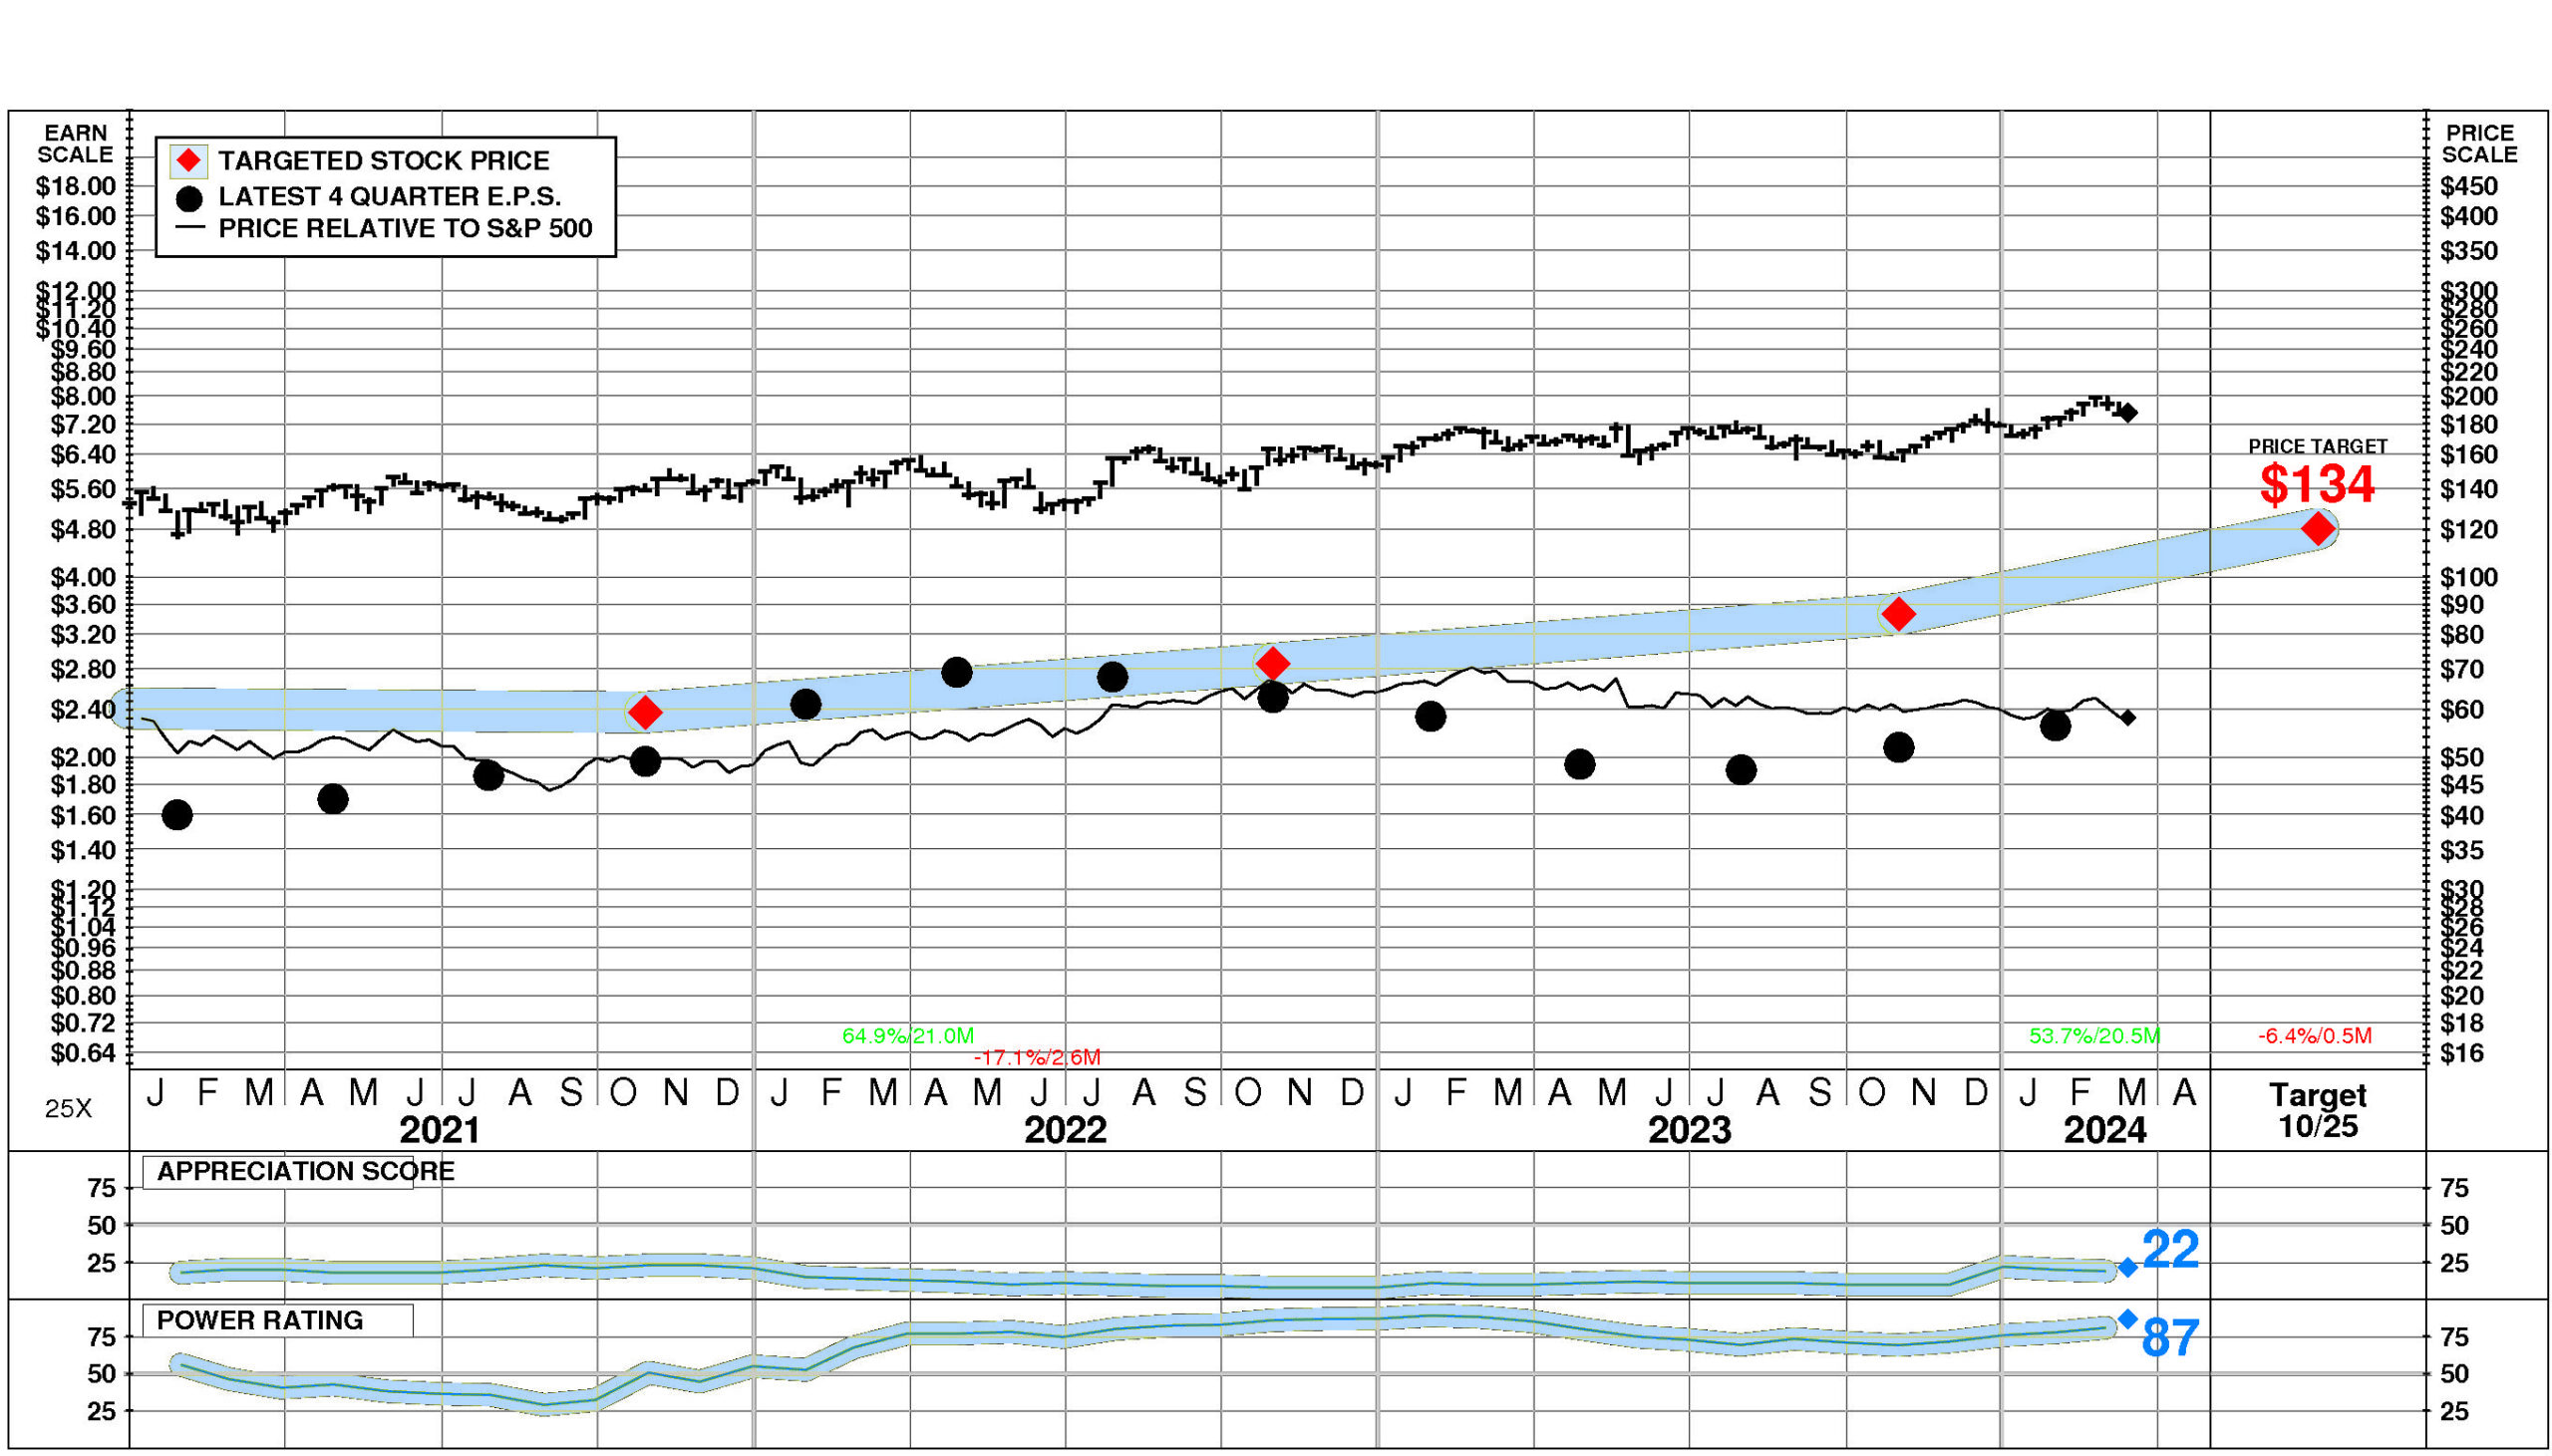
HEICO’s current technical position is very strong. The stock price is in a 20.5 month up move. The stock has appreciated 53.7% from its prior low. The stock price is above its 200 day moving average which is in an uptrend.
ALERTS
The stock is currently rated C.
On 3/13/24, HEICO Corp (NYSE: HEI) stock increased 1.7%, closing at $187.79. This advance was accompanied by normal trading volume. Relative to the market the stock has been strong over the last nine months but has declined -0.6% during the last week.
CASH FLOW
In 2023, HEICO generated a significant increase in cash of +$31.5 million (+23%). Sources of cash were larger than uses. Cash generated from 2023 EBITDA totaled +$765.7 million. Non-operating uses consumed -$53.5 million (-7% of EBITDA). Cash taxes consumed -$50.2 million (-7% of EBITDA). Re-investment in the business amounted to -$2,918.9 million (-381% of EBITDA). On a net basis, debt investors supplied +$2,152.3 million (+281% of EBITDA) while equity investors contributed +$136.3 million (+18% of EBITDA).
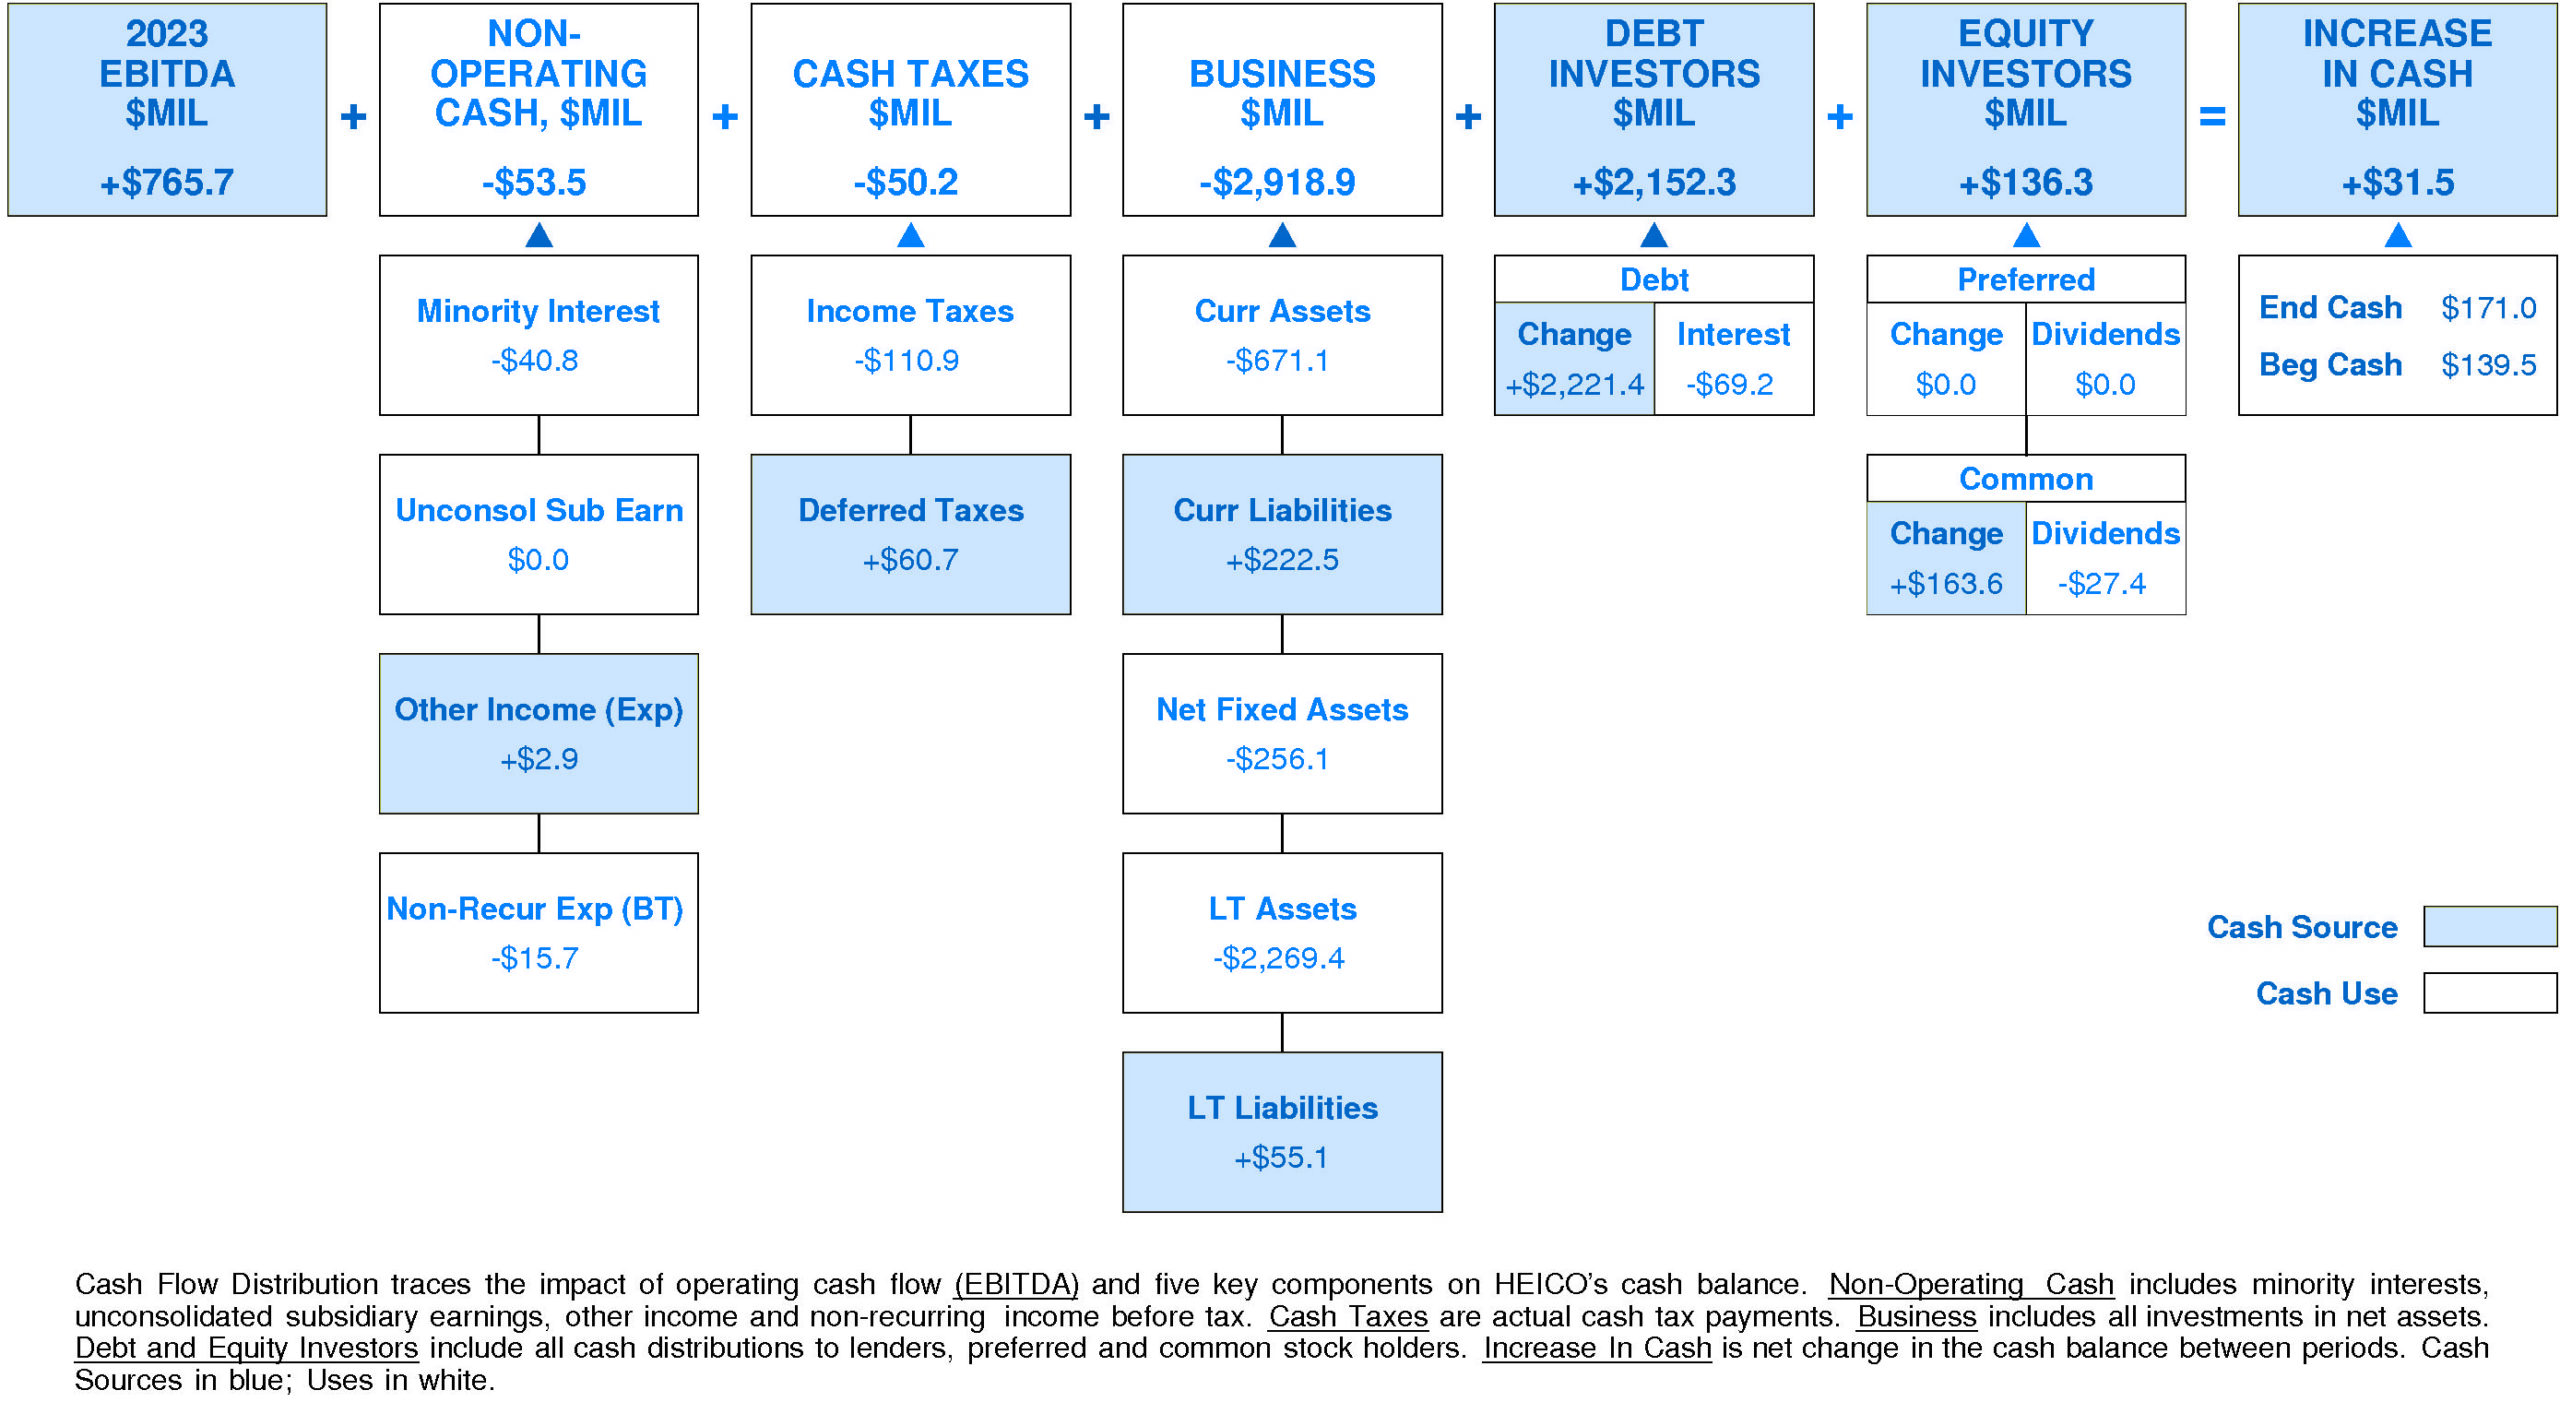
HEICO’s Non-operating Income, %EBITDA has exhibited little to no overall change over the period. This stability was accompanied by stability for the Heico Peer Group as well. In most years, HEICO was in the third quartile and lower quartile. Currently, HEICO is substantially below median at -7% of EBITDA (-$53.5 million).
HEICO’s Cash Taxes, %EBITDA enjoyed a strong overall uptrend over the period. This improvement was accompanied by a similar trend for the Heico Peer Group. In most years, HEICO was in the third quartile and top quartile. Currently, HEICO is upper quartile at -7% of EBITDA (-$50.2 million).
HEICO’s Business Re-investment, %EBITDA has suffered a very strong overall downtrend over the period. This downtrend was accompanied by stability for the Heico Peer Group. (Since 2021 Business Re-investment, %EBITDA has accelerated very sharply.) In most years, HEICO was in the third quartile and second quartile. Currently, HEICO is lower quartile at -381% of EBITDA (-$2,918.9 million).
HEICO’s Debt Investors, %EBITDA has experienced a volatile overall uptrend over the period. This improvement was accompanied by a similar trend for the Heico Peer Group. (Since 2021 Debt Investors, %EBITDA has accelerated very sharply.) In most years, HEICO was in the top quartile and third quartile. Currently, HEICO is upper quartile at +281% of EBITDA (+$2,152.3 million).
HEICO’s Equity Investors, %EBITDA has exhibited a minor overall uptrend over the period. This improvement was accompanied by an opposite trend for the Heico Peer Group. (Since 2021 Equity Investors, %EBITDA has sharply accelerated.) In most years, HEICO was in the third quartile and second quartile. Currently, HEICO is above median at +18% of EBITDA (+$136.3 million).
HEICO’s Change in Cash, %EBITDA has exhibited little to no overall change over the period. This stability was accompanied by stability for the Heico Peer Group as well. In most years, HEICO was in the third quartile and top quartile. Currently, HEICO is above median at +4% of EBITDA (+$31.5 million).
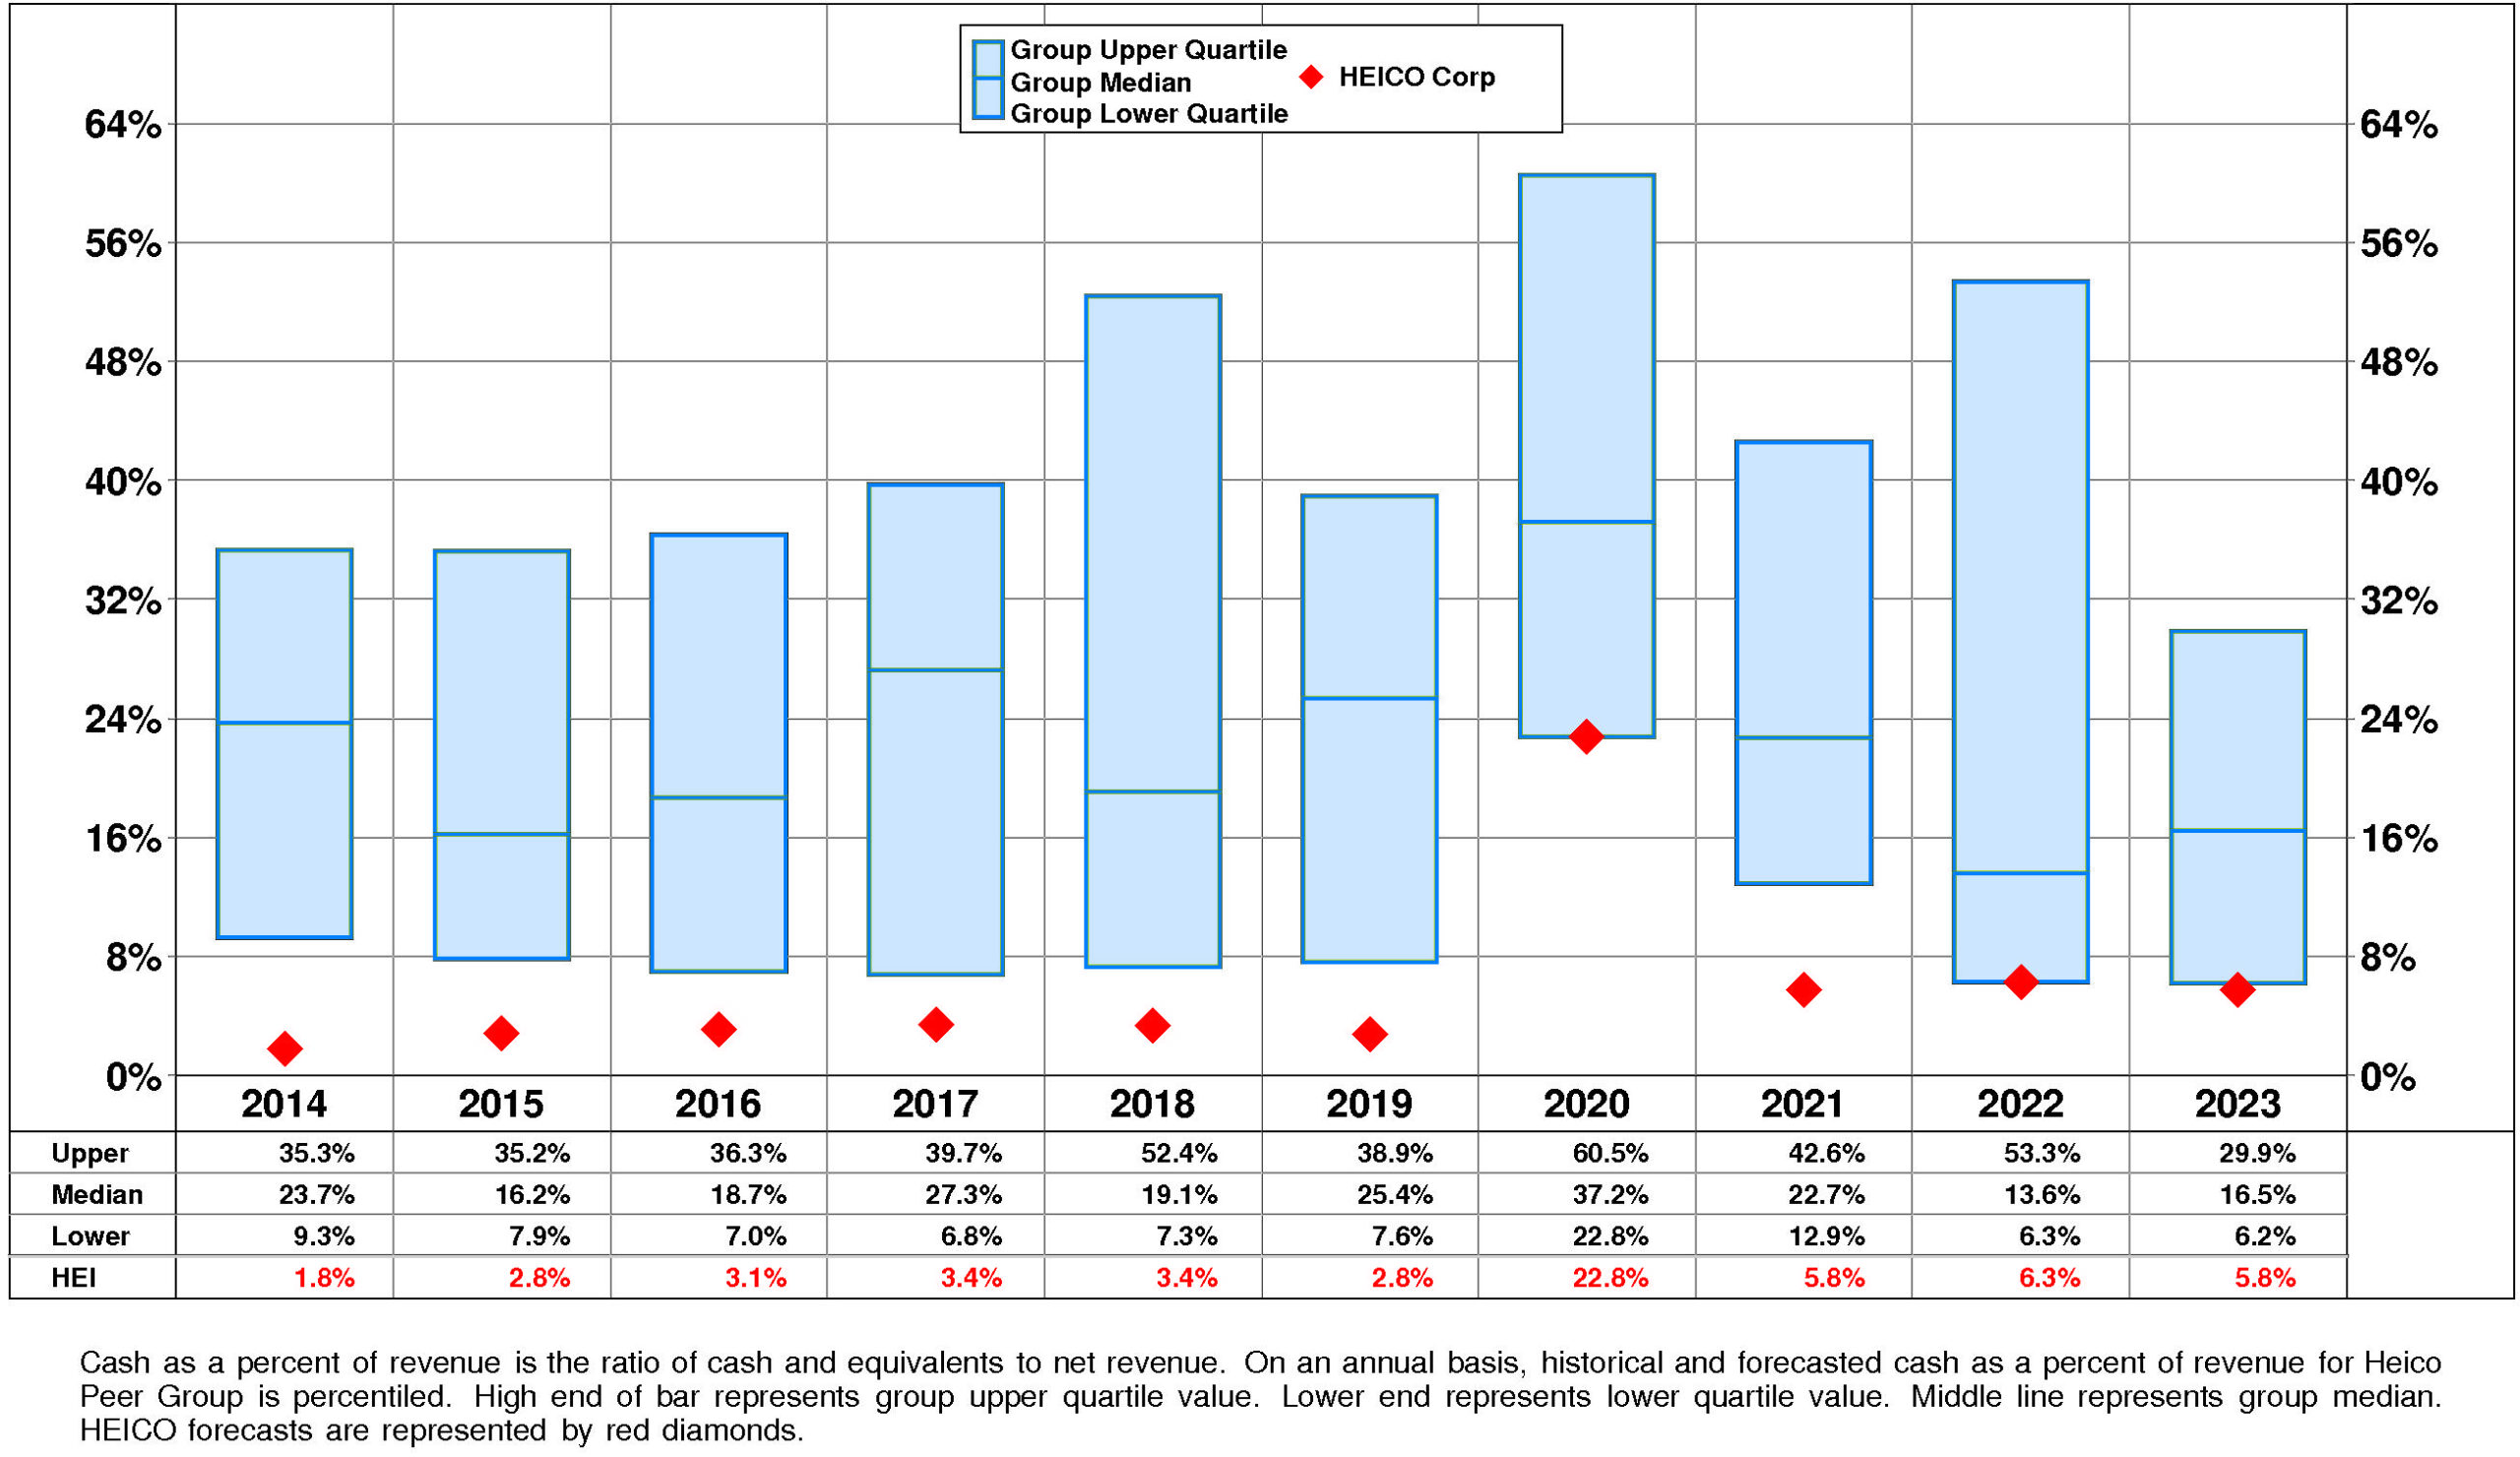
HEICO’s Cash, %Revenue has exhibited a volatile overall uptrend over the period. This improvement was accompanied by stability for the Heico Peer Group. (Since 2020 Cash, %Revenue has experienced a very sharp decline.) In most years, HEICO was in the lower quartile. Currently, HEICO is lower quartile at +6%.
PROFITABILITY
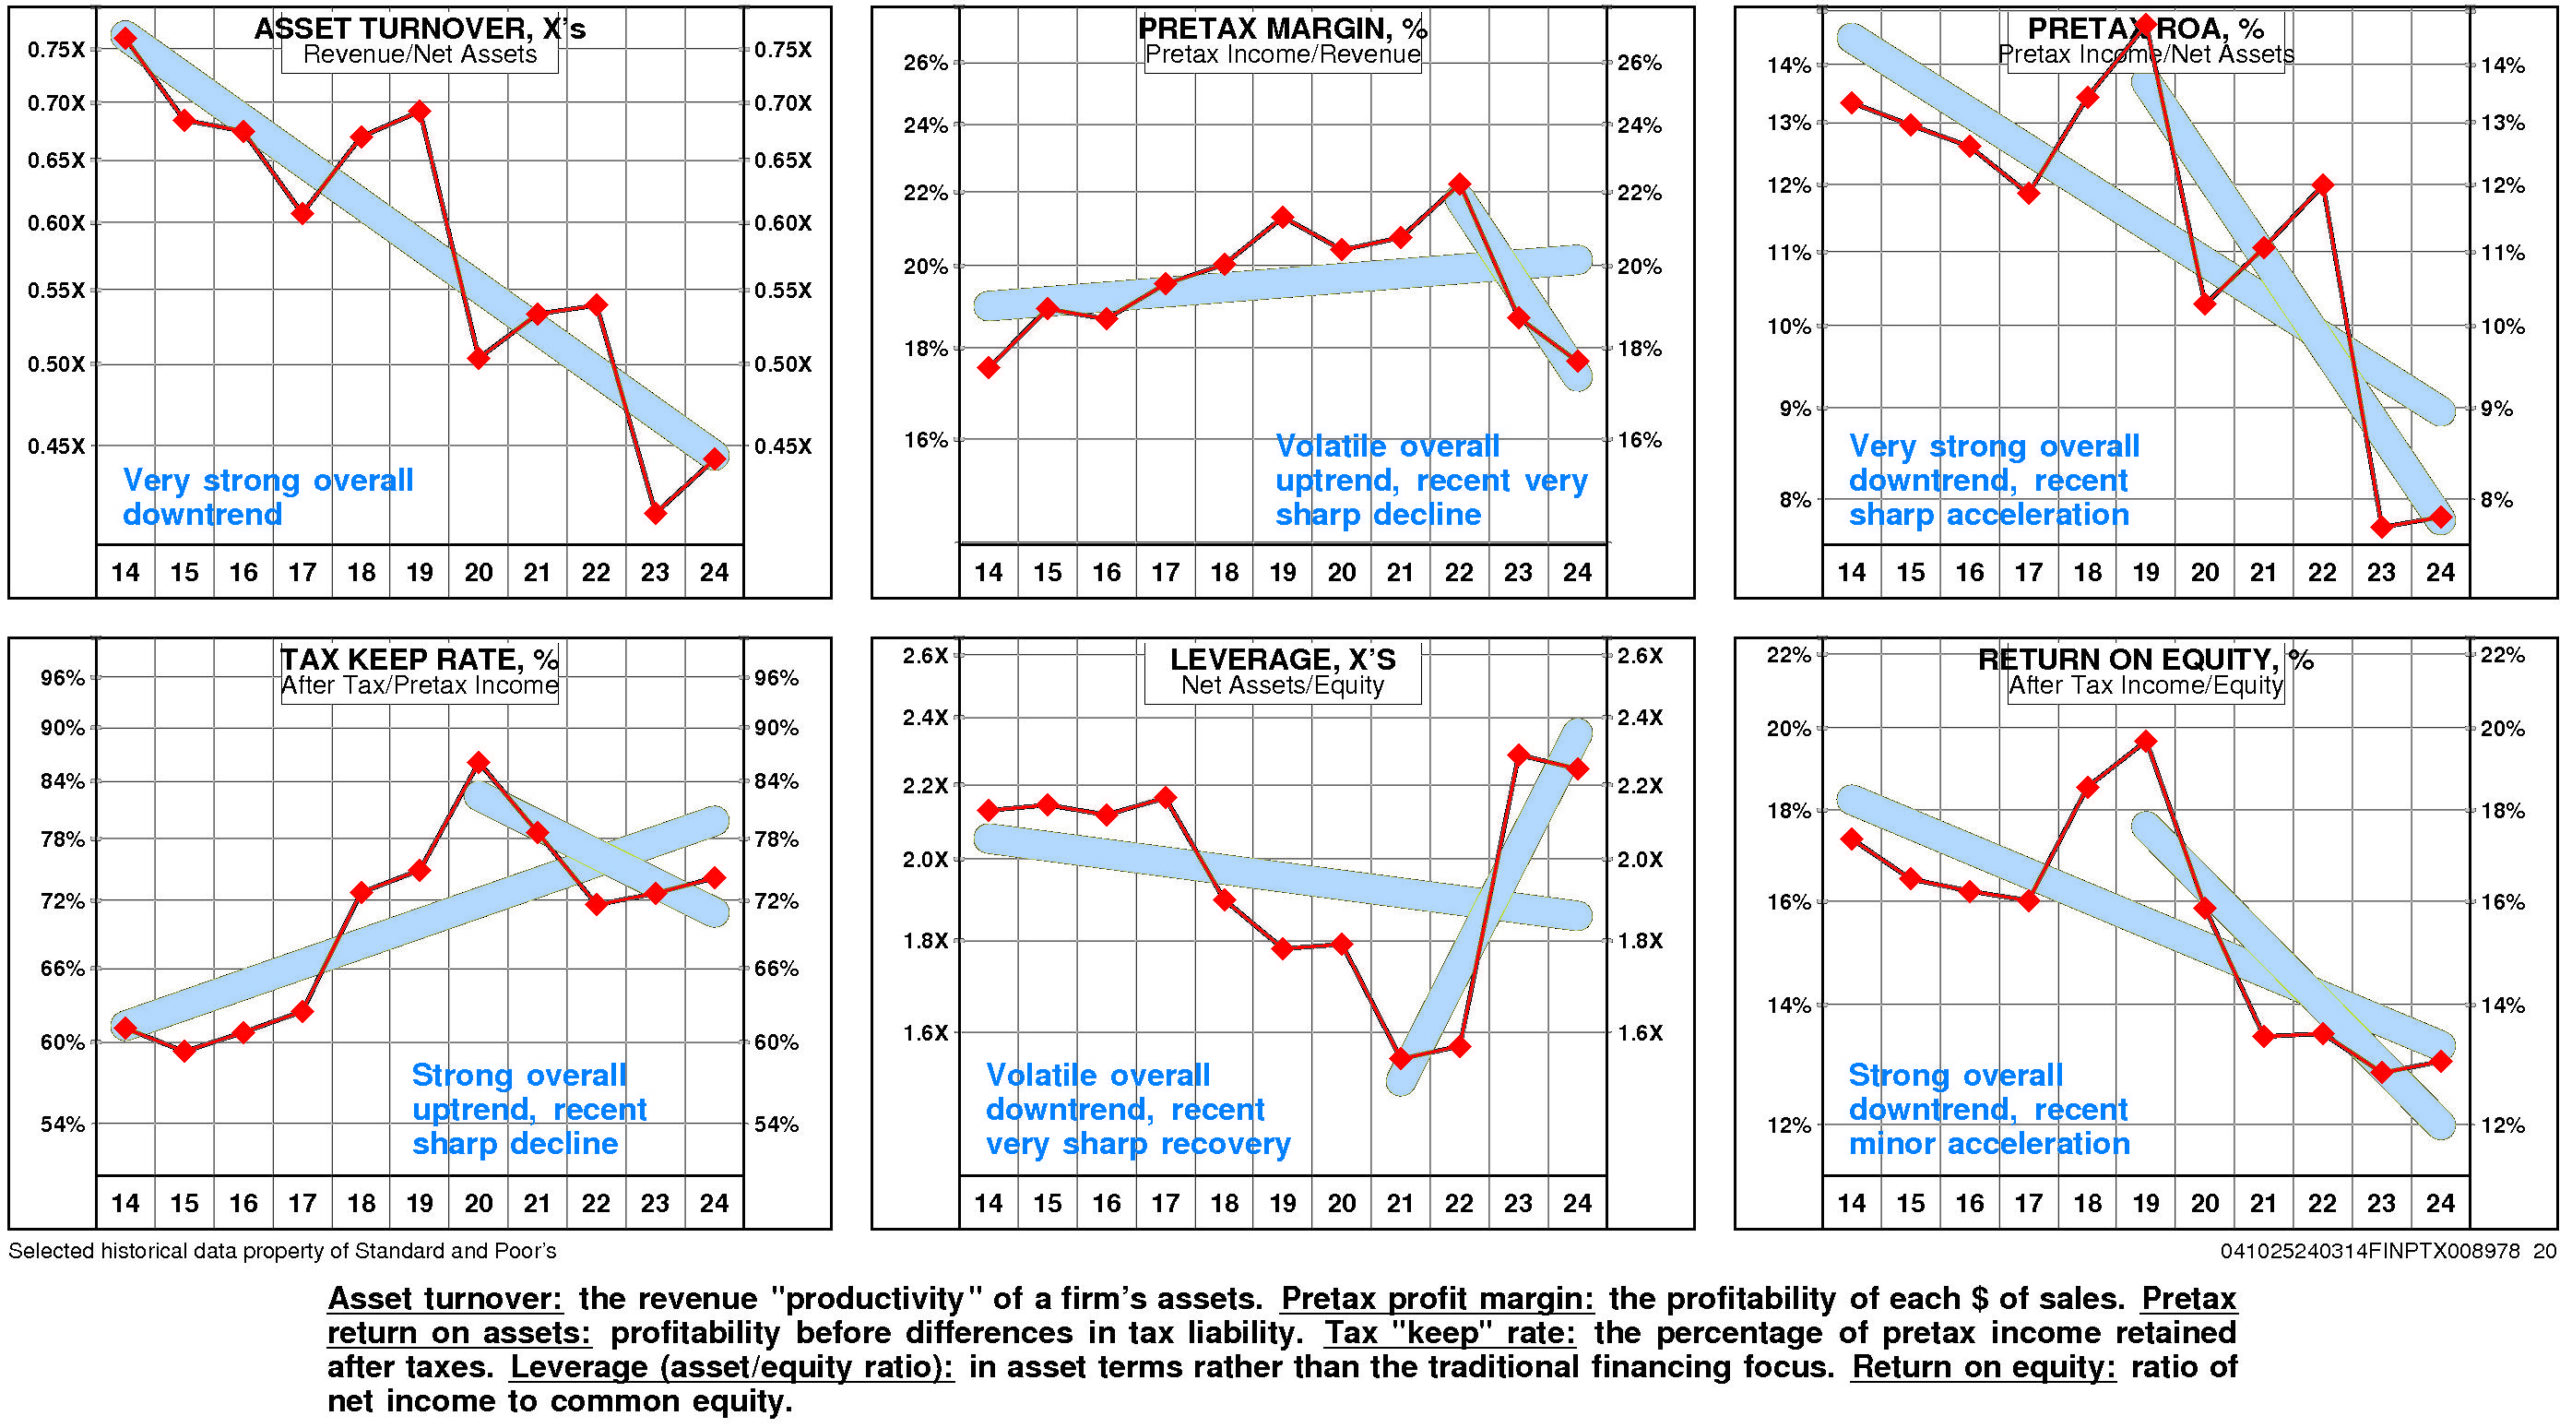
HEICO’s return on equity has eroded significantly since 2014. The current level of 13.0% is 1.01X the low for the period and is -24.9% from the high.
This significant erosion was due to very strong negative trend in pretax operating return and small positive trend in non-operating factors.
The productivity of HEICO’s assets declined over the full period 2014-2024: asset turnover has suffered a very strong overall downtrend.
Partially offsetting this trend, however, pretax margin has exhibited a volatile overall uptrend even as it experienced a very sharp decline after the 2022 high.
Non-operating factors (income taxes and financial leverage) had a minor positive influence on return on equity.
HEICO’s return on equity is at median (13.0%) for the four quarters ended January, 2024.
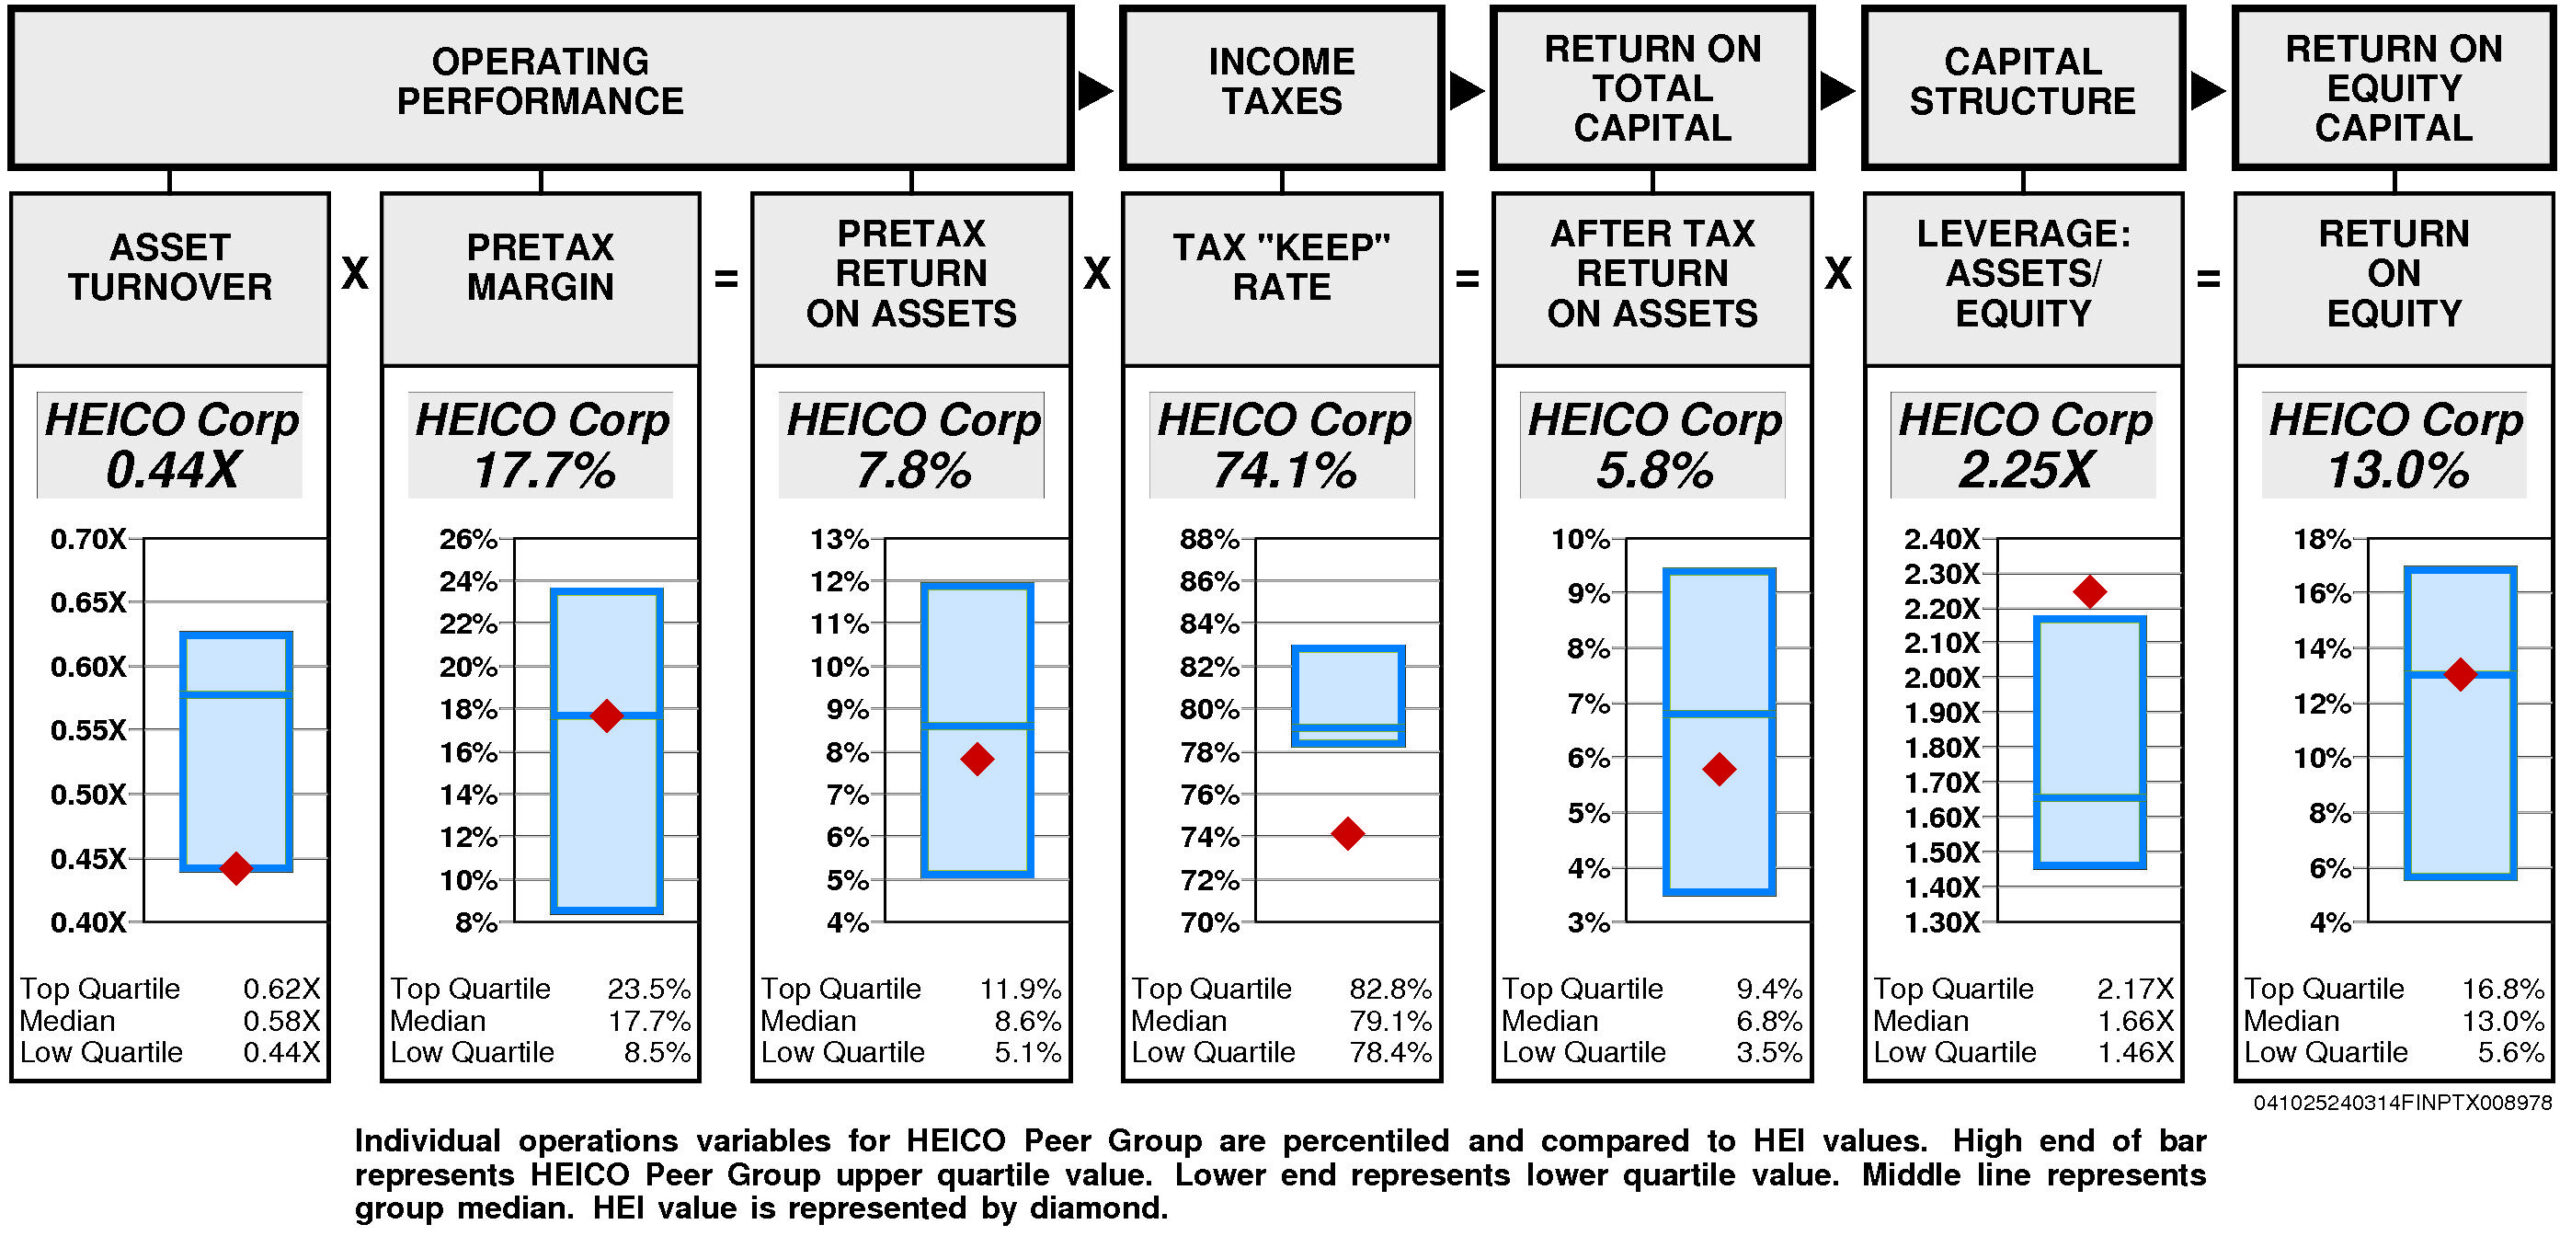
Operating performance (pretax return on assets) is slightly below median (7.8%) reflecting asset turnover that is at the lower quartile (0.44X) and at median pretax margin (17.7%).
Tax “keep” rate (income tax management) is lower quartile (74.1%) resulting in after tax return on assets that is below median.
Financial leverage (leverage) is upper quartile (2.25X).
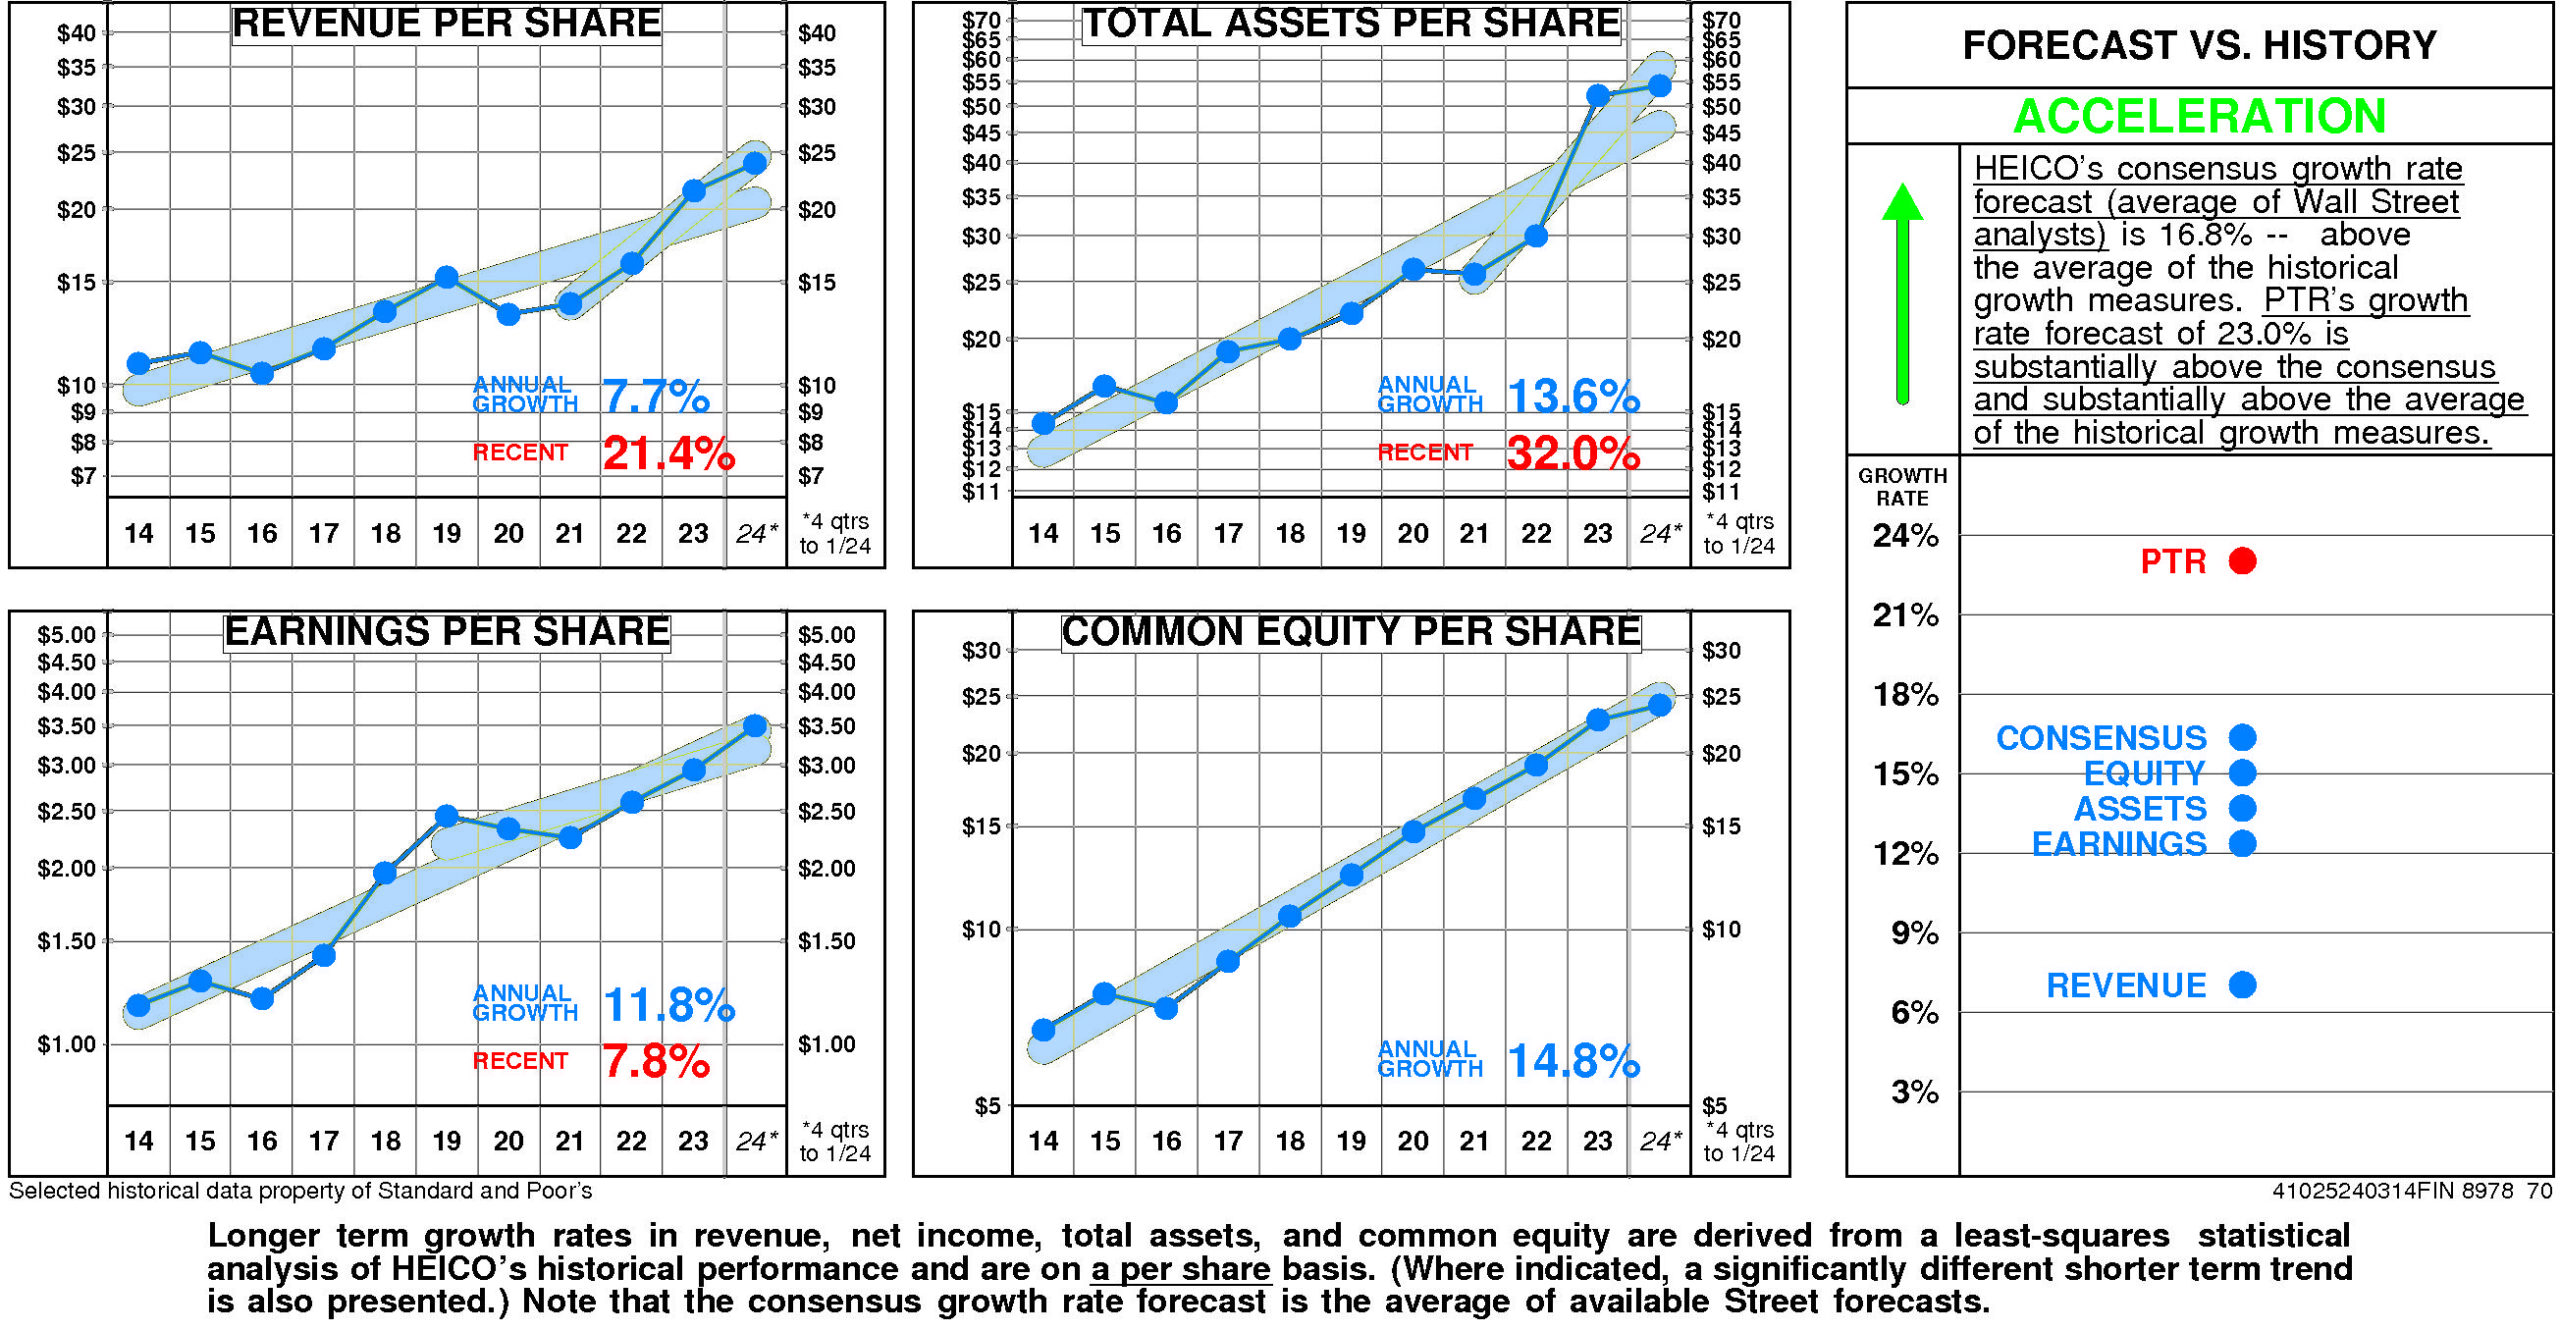
GROWTH RATES
There are no significant differences between HEICO’s longer term growth and growth in recent years.
HEICO’s historical income statement growth and balance sheet growth have diverged. Revenue growth has fallen short of asset growth; earnings growth has paralleled equity growth.
Annual revenue growth has been 7.7% per year. (More recently it has been 21.4%.)
Total asset growth has been 13.6% per year. (More recently it has been 32.0%.)
Annual E.P.S. growth has been 11.8% per year. (More recently it has been 7.8%.)
Equity growth has been 14.8% per year.
HEICO’s consensus growth rate forecast (average of Wall Street analysts) is 16.8% — above the average of the historical growth measures.
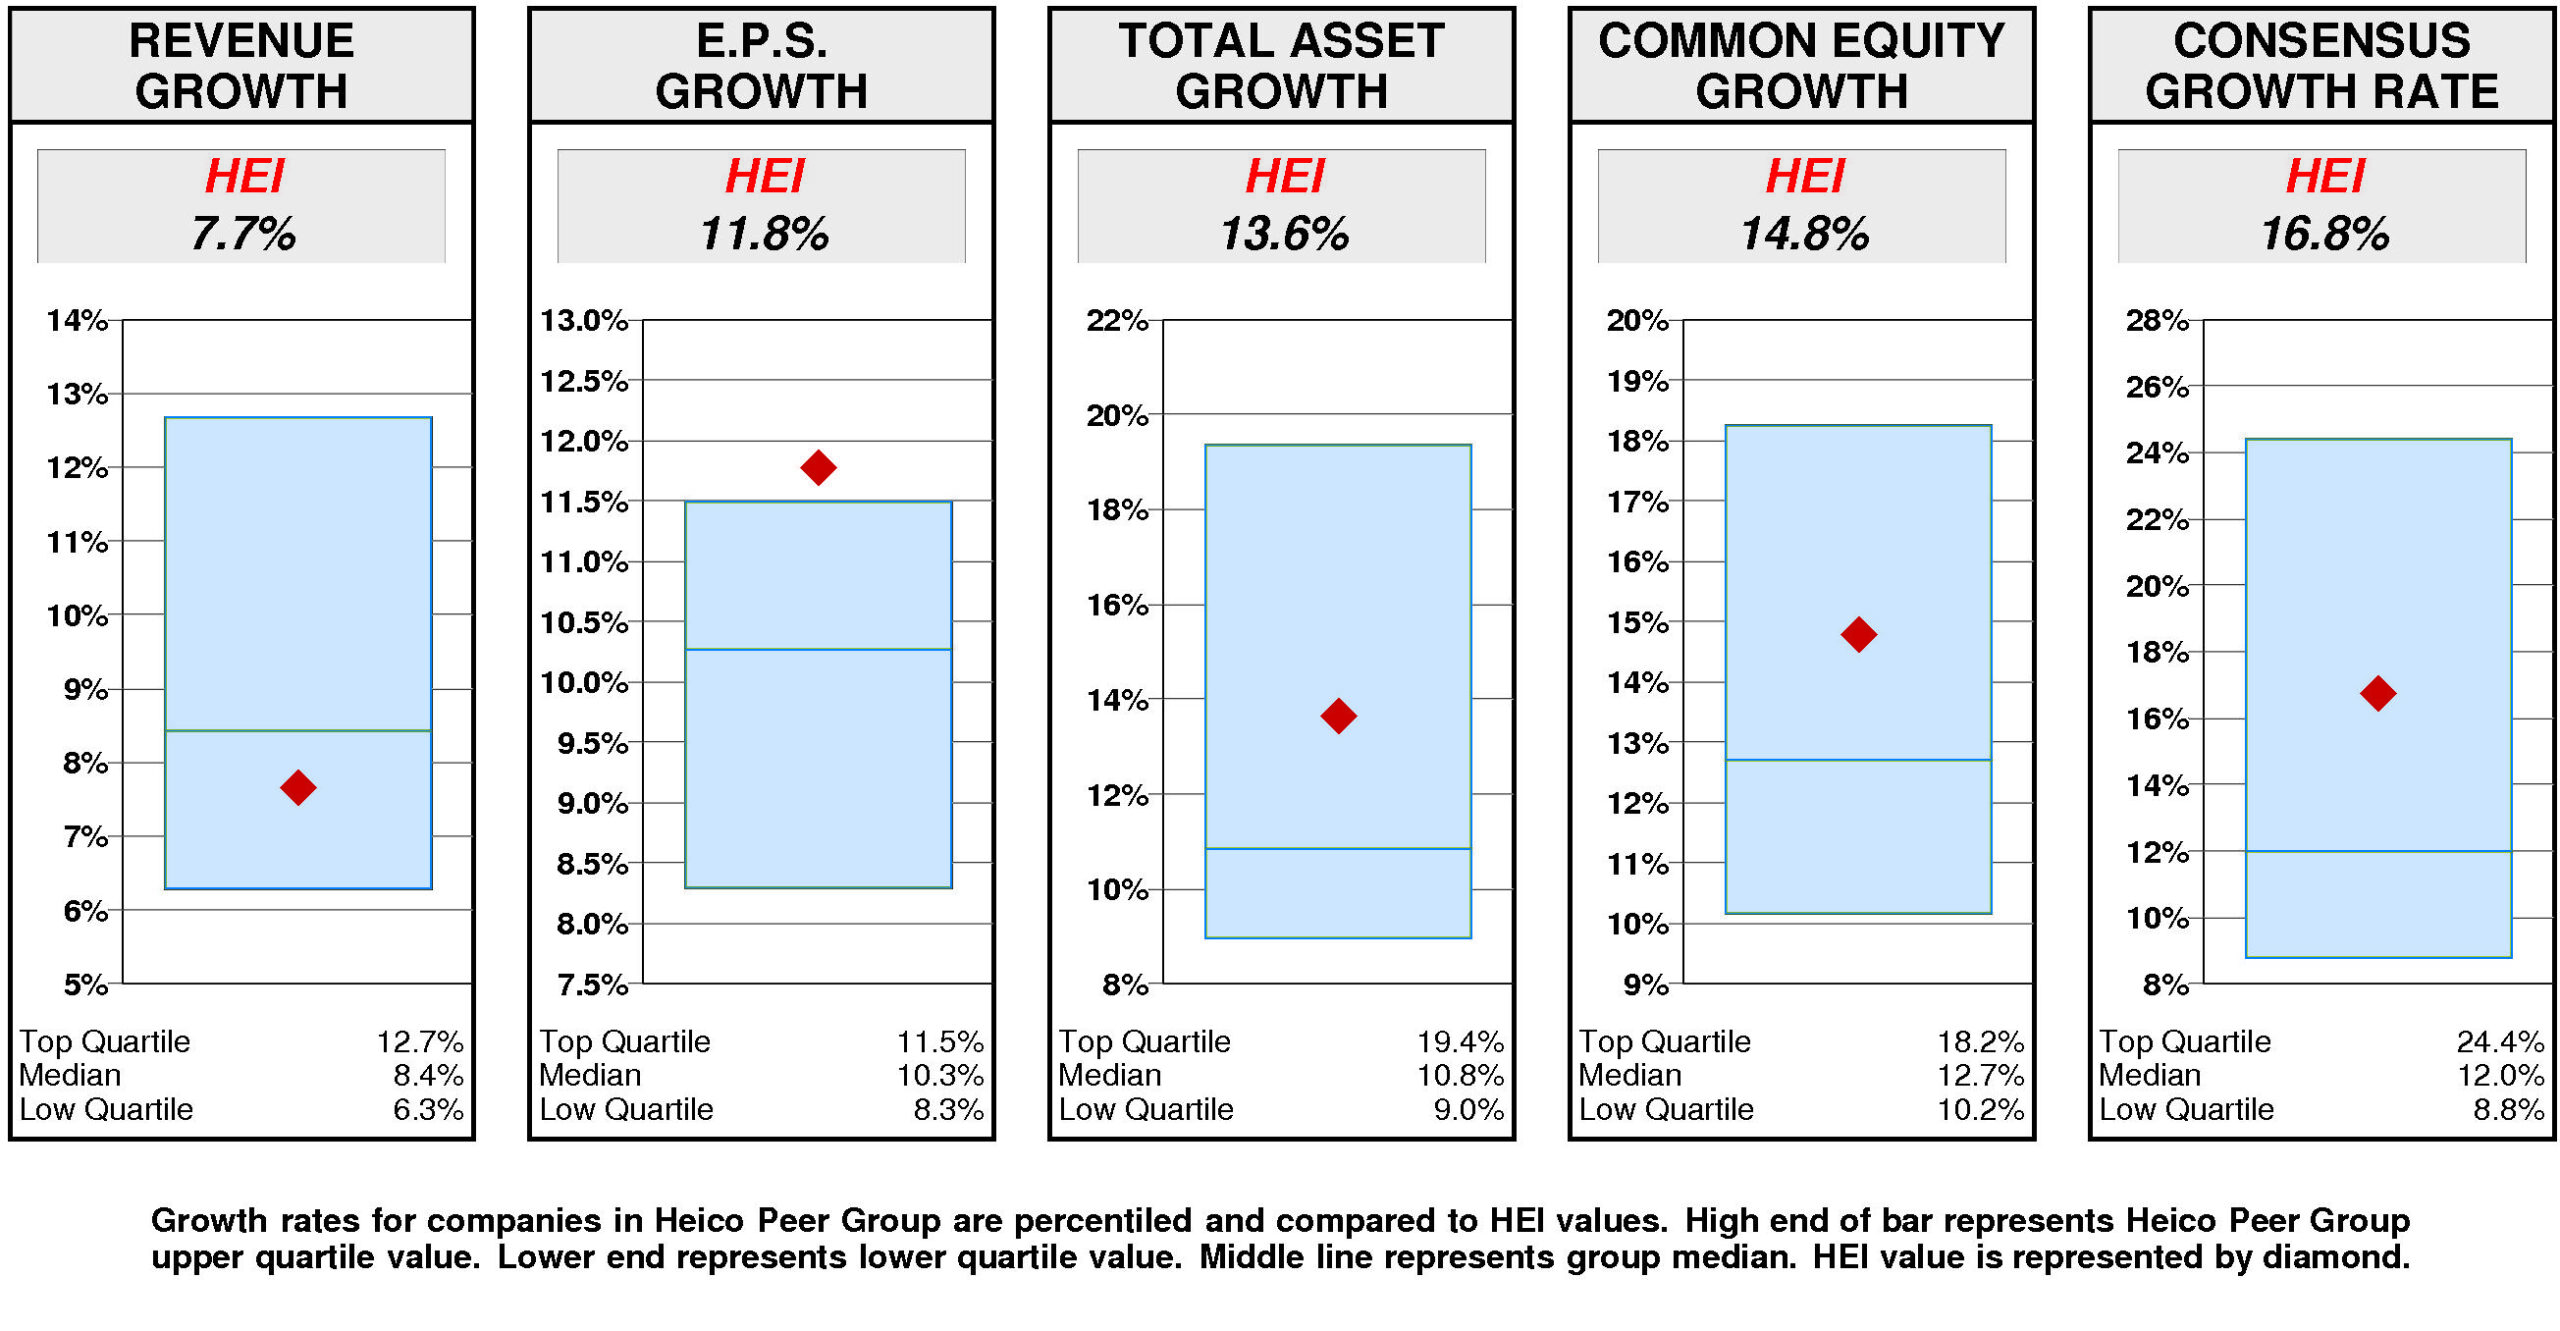
Relative to the Heico Peer Group, HEICO’s historical growth measures are erratic. E.P.S. growth (11.8%) has been upper quartile. Total asset growth (13.6%) has been above median. Equity growth (14.8%) has been above median. Revenue growth (7.7%) has been below median.
Consensus growth forecast (16.8%) is above median.
PRICE HISTORY
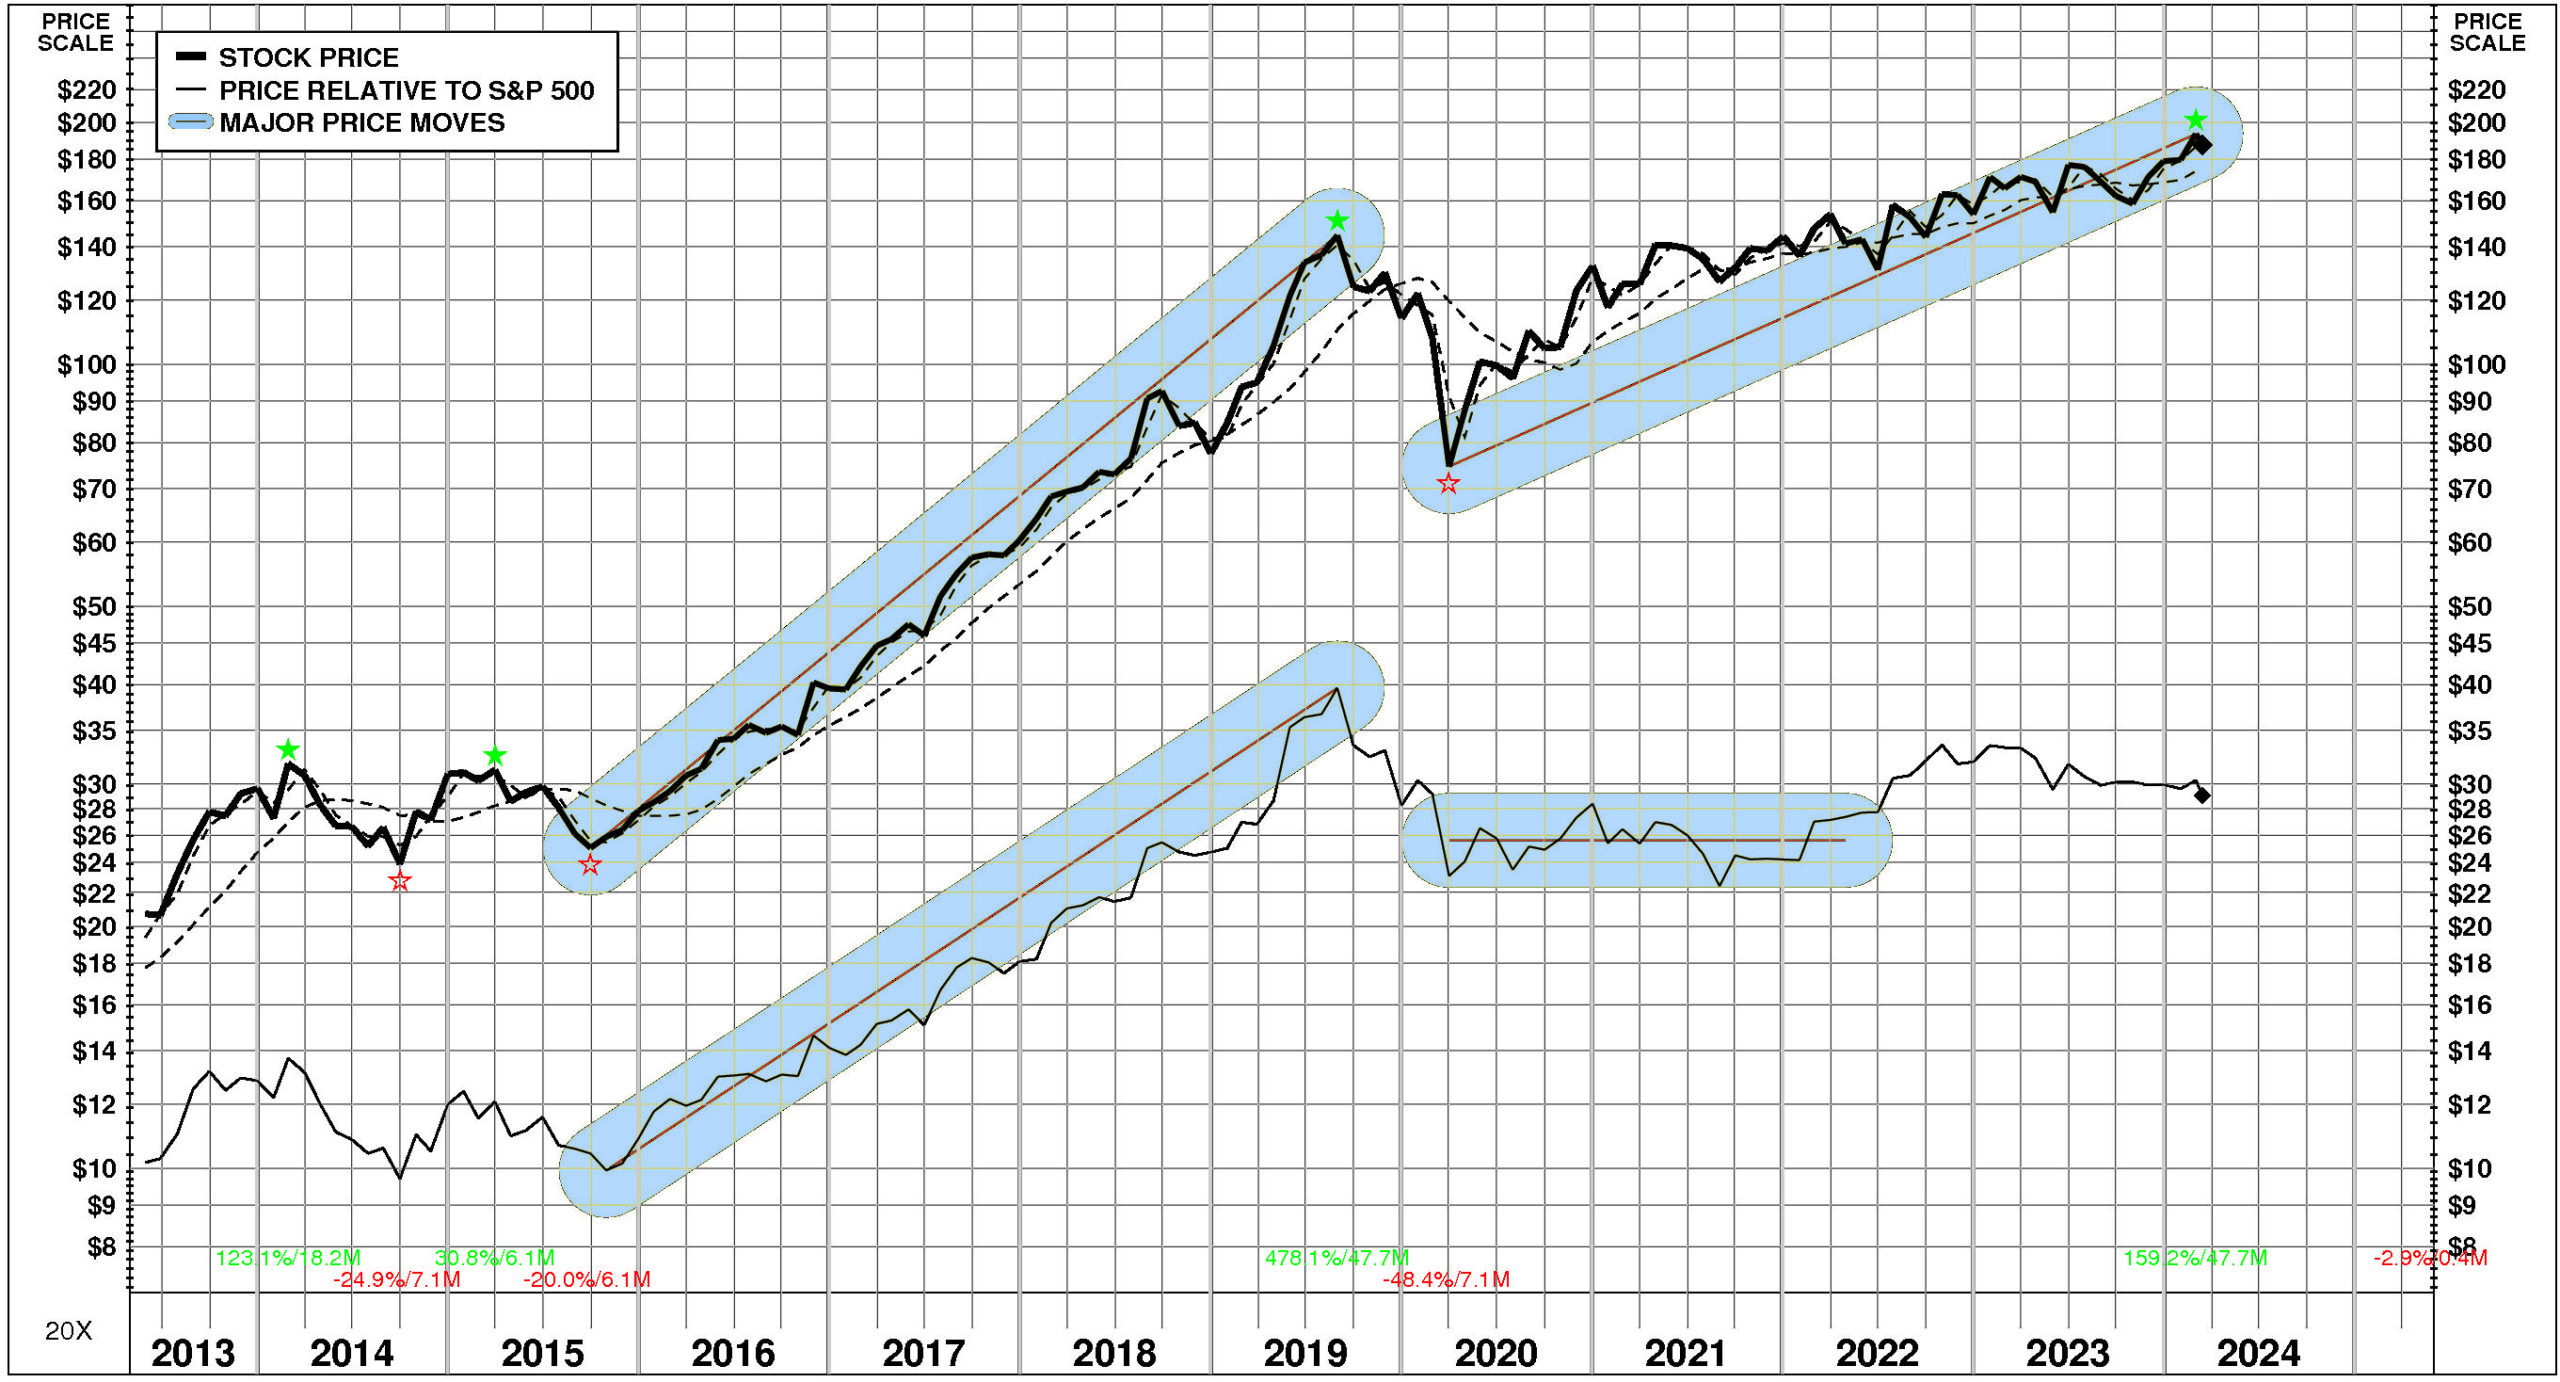
Over the full time period, HEICO’s stock price performance has been exceptional. Between May, 2013 and March, 2024, HEICO’s stock price rose +806%; relative to the market, this was a +186% gain. Significant price moves during the period: 1) March, 2020 – February, 2024: +159%; and 2) September, 2015 – August, 2019: +478%.
TOTAL INVESTMENT RETURNS
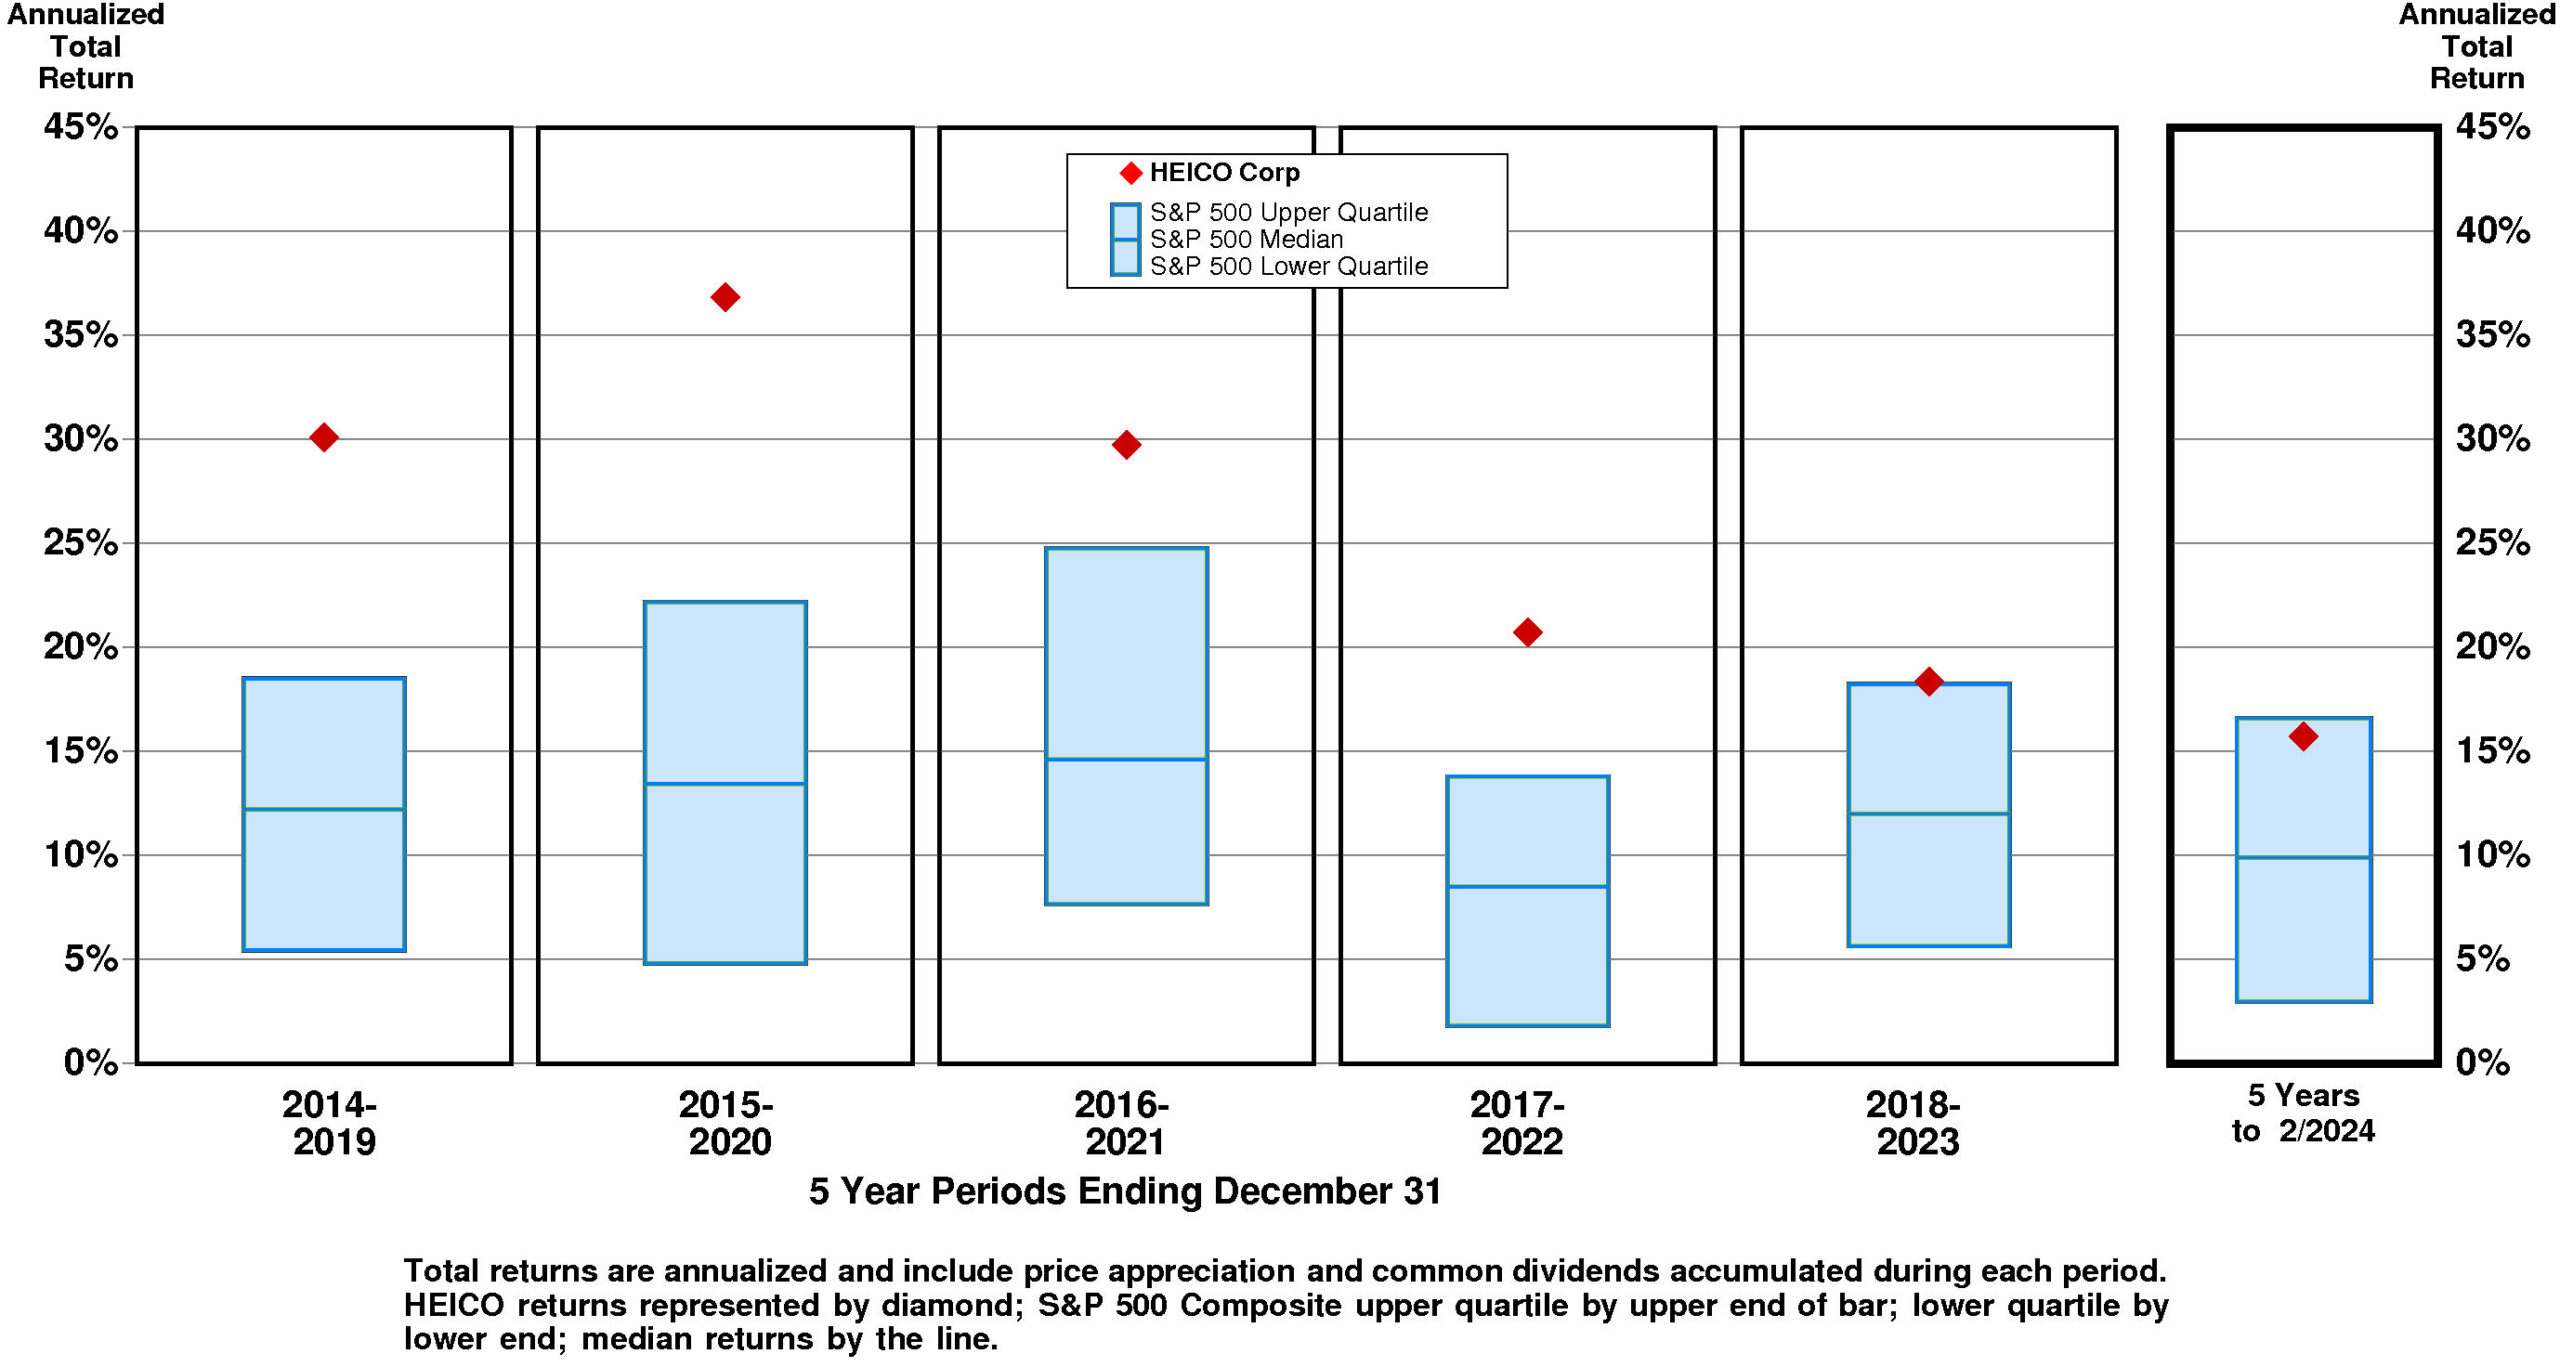
Current annual total return performance of 16.9% is above median relative to the S&P 500 Composite.
In addition to being above median relative to S&P 500 Composite, current annual total return performance through February, 2024 of 16.9% is below median relative to HEICO Corp Peer Group.
Current 5-year total return performance of 15.7% is substantially above median relative to the S&P 500 Composite.
Through February, 2024, with substantially above median current 5-year total return of 15.7% relative to S&P 500 Composite, HEICO’s total return performance is at median relative to HEICO Corp Peer Group.
VALUATION BENCHMARKS
Relative to S&P 500 Composite, HEI’s overall valuation is normal. The highest factor, the ratio of enterprise value/assets, is slightly above median. Ratio of enterprise value/revenue is slightly above median. Price/equity ratio is at median. Price/earnings ratio is at median. The lowest factor, the ratio of enterprise value/earnings before interest and taxes, is below median.
Relative to HEICO Peer Group, HEI’s overall valuation is quite low. The highest factor, the ratio of enterprise value/revenue, is lower quartile. Ratio of enterprise value/earnings before interest and taxes is lower quartile. Price/equity ratio is at the lower quartile. Ratio of enterprise value/assets is at the lower quartile. The lowest factor, the price/earnings ratio, is lower quartile.
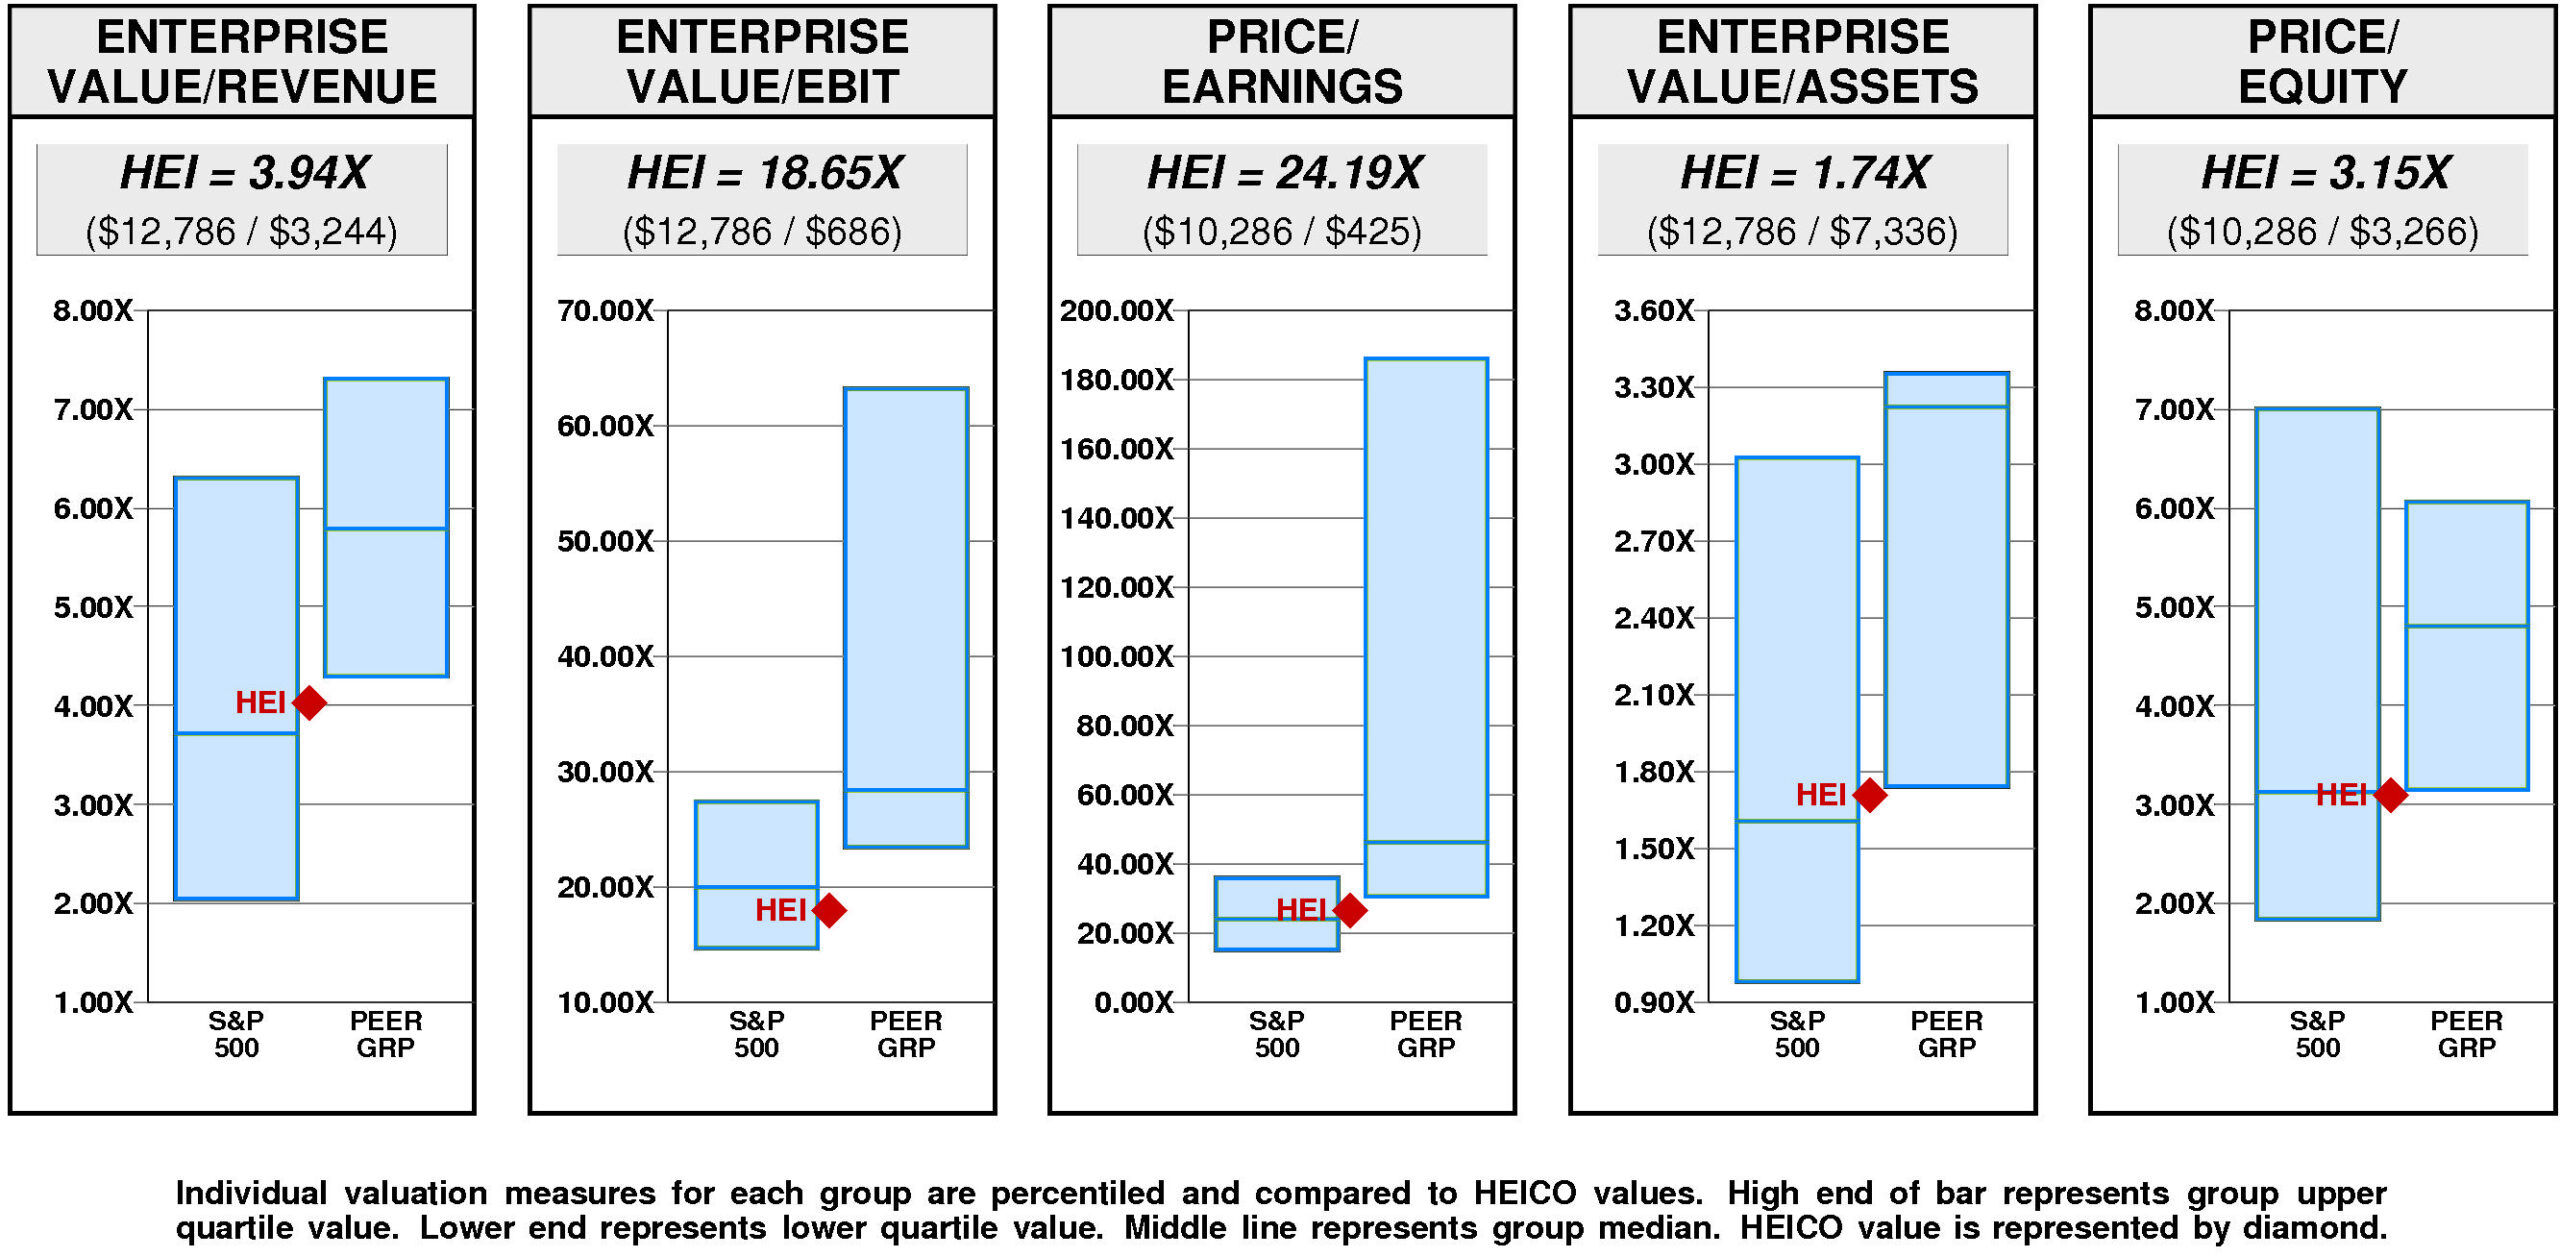
HEICO has a major value gap compared to the median. For HEI to hit median valuation, its current ratio of enterprise value/revenue would have to rise from the current level of 3.94X to 5.79X. If HEI’s ratio of enterprise value/revenue were to rise to 5.79X, its stock price would be higher by $109 to $297.
For HEI to achieve upper quartile valuation relative to the HEICO Peer Group, its current ratio of enterprise value/revenue would have to rise from the current level of 3.94X to 7.31X. If HEI’s ratio of enterprise value/revenue were to rise to 7.31X, its stock price would increase by $199 from the current level of $188.
VALUE TARGETS
With future capital returns forecasted to be above the cost of capital, HEI is expected to continue to be an important Value Builder.
HEICO’s current Price Target of $134 represents a -28% change from the current price of $187.79.
HEICO’s low appreciation potential results in an appreciation score of 22 (78% of the universe has greater appreciation potential.)
Notwithstanding this low Appreciation Score of 22, the high Power Rating of 87 results in an Value Trend Rating of C.
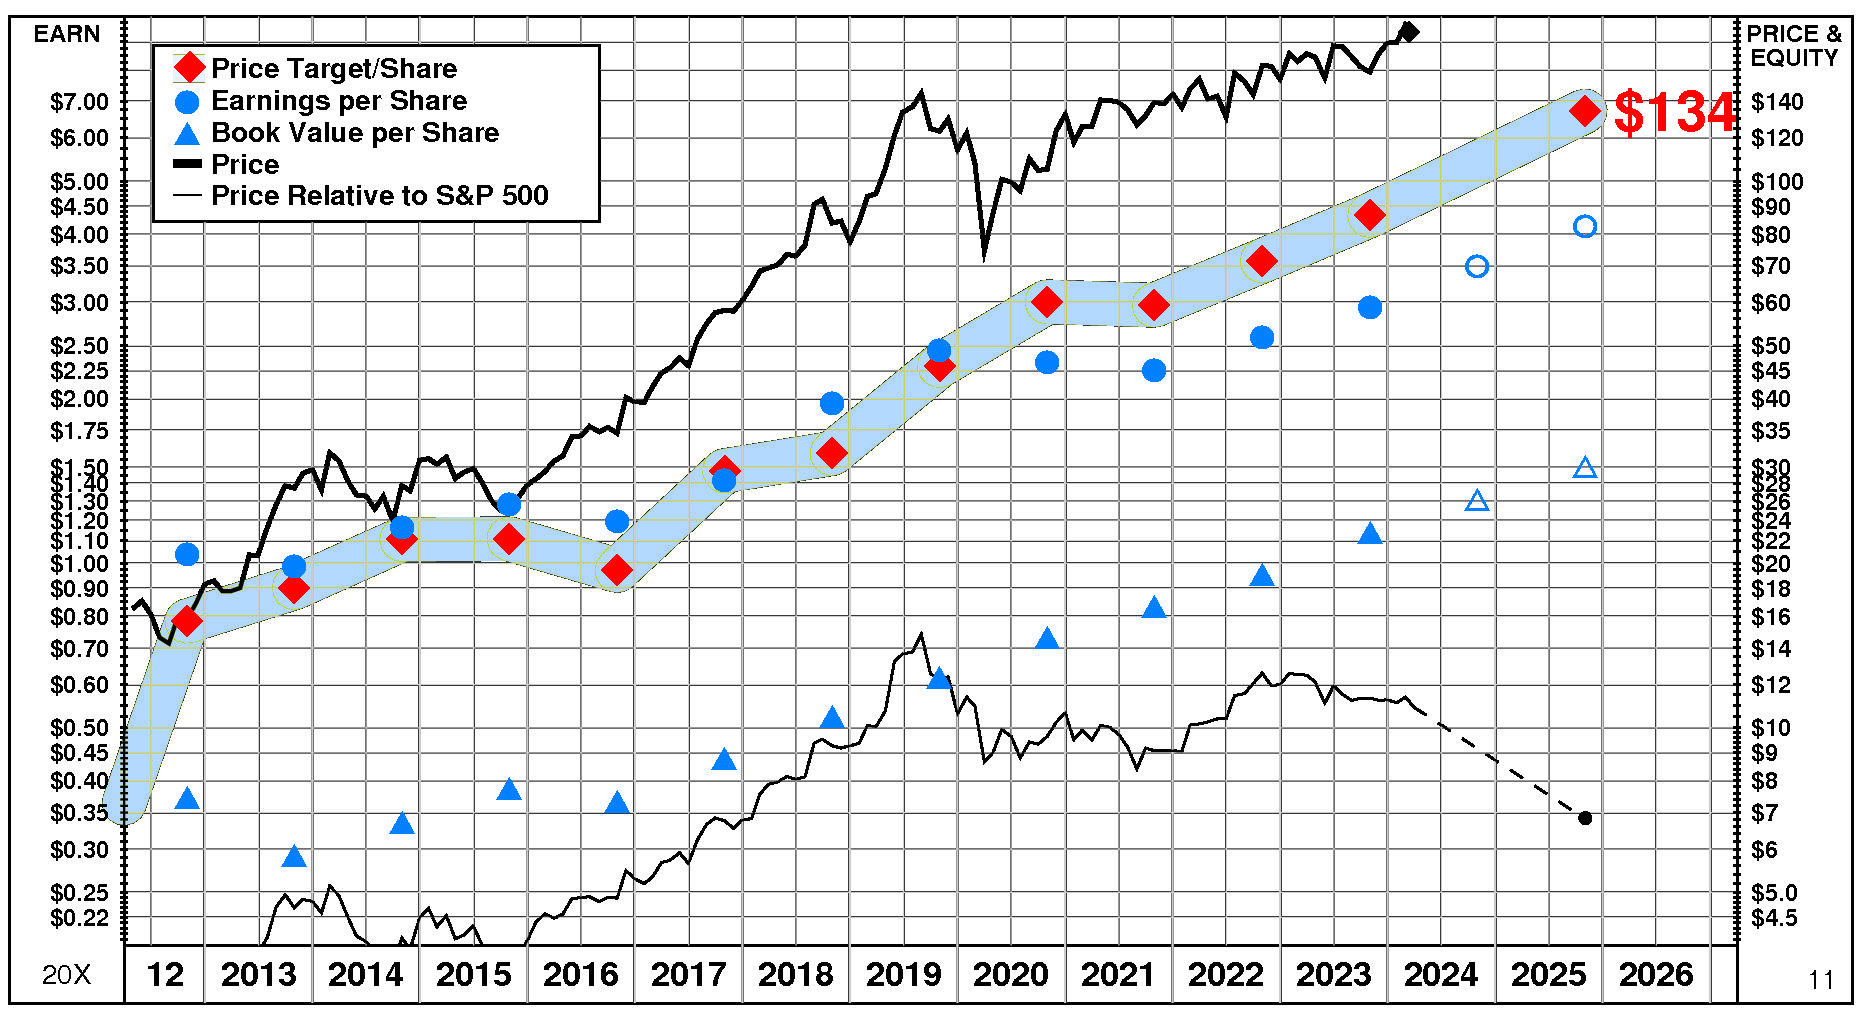
HEICO’s current Price Target is $134 (+55% from the 2023 Target of $87 but -28% from the 03/13/24 price of $187.79). This dramatic rise in the Target is the result of a +36% increase in the equity base and a +14% increase in the price/equity multiple. The forecasted increase in return on equity has a very large positive impact on the price/equity multiple and the forecasted increase in growth has a large positive impact as well. Partially offsetting these Drivers, the forecasted increase in cost of equity has a very large negative impact.
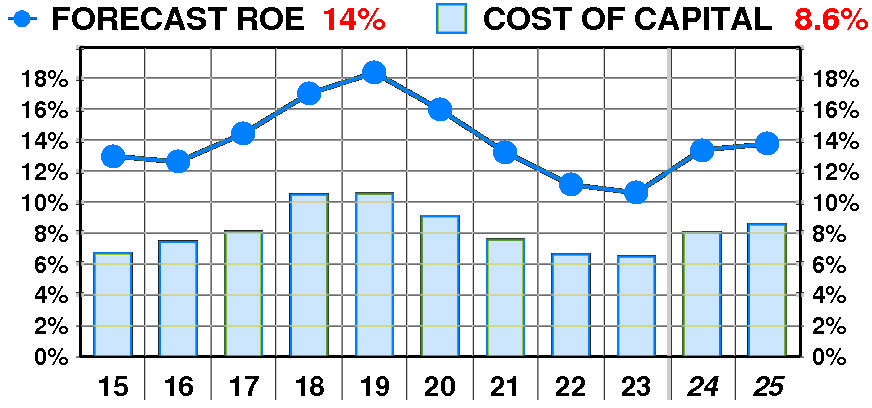
PTR’s return on equity forecast is 13.8% — slightly above our recent forecasts. Forecasted return on equity suffered a dramatic, erratic decline between 2015 and 2023. The current forecast is below the 2019 peak of 18%.
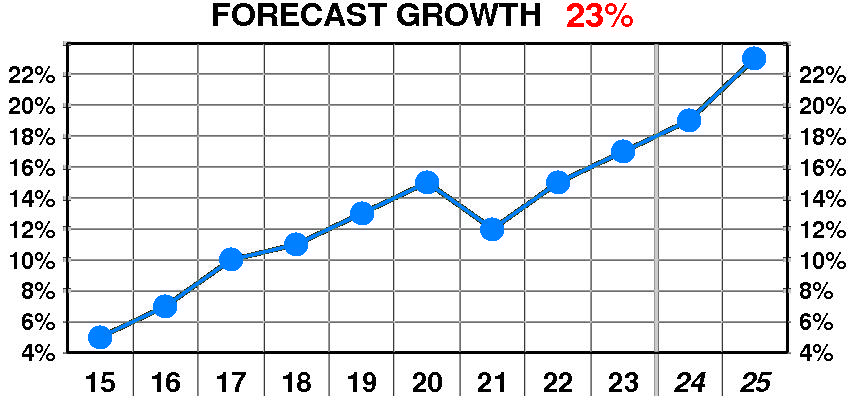
PTR’s growth forecast is 23.0% — above our recent forecasts. Forecasted growth enjoyed a dramatic, steady increase between 2015 and 2023. The current forecast is significantly above the 2015 low of 5%.
PTR’s cost of equity forecast is 8.6% — slightly above recent levels. Forecasted cost of equity exhibited a modest, erratic decline between 2015 and 2023. The current forecast is steady at the 2019 peak of 10.5%.
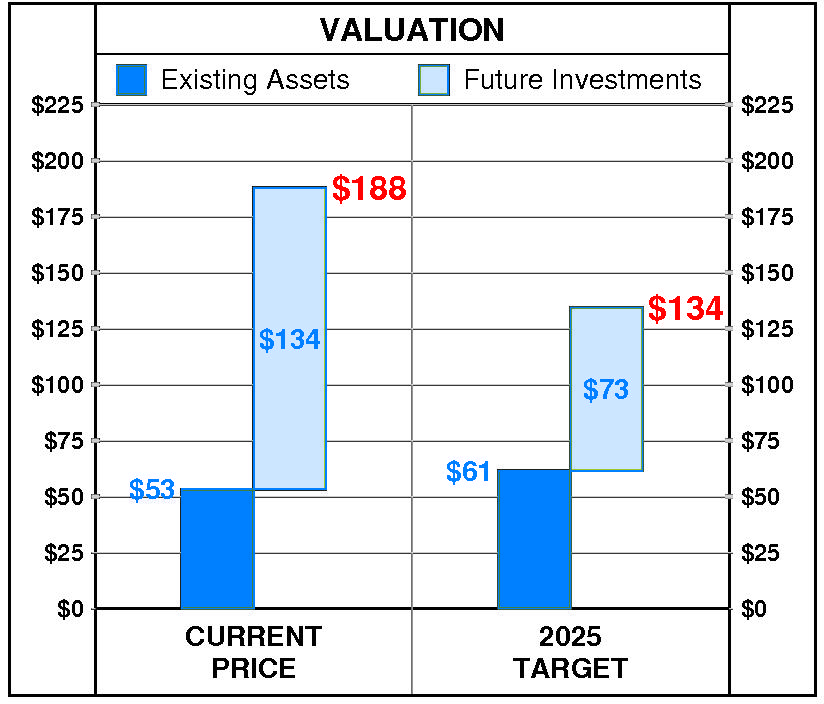
At HEICO’s current price of $187.79, investors are placing a positive value of $134 on its future investments. This view is consistent with the company’s most recent performance that reflected a growth rate of 17.0% per year, and a return on equity of 10.6% versus a cost of equity of 6.5%.
PTR’s 2025 Price Target of $134 is based on these forecasts and reflects an estimated value of existing assets of $61 and a value of future investments of $73.
Be the first to comment