![]()
BUSINESS
Hawaiian Electric Industries, Inc., together with its subsidiaries, engages in the electric utility, banking, and renewable/sustainable infrastructure investment businesses in the state of Hawaii. It operates in three segments: Electric Utility, Bank, and Other. The Electric Utility segment engages in the production, purchase, transmission, distribution, and sale of electricity in the islands of Oahu, Hawaii, Maui, Lanai, and Molokai. Its renewable energy sources and potential sources include wind, solar, photovoltaic, geothermal, wave, hydroelectric, municipal waste, and other biofuels. This segment serves suburban communities, resorts, the United States armed forces installations, and agricultural operations.
INVESTMENT RATING
With future capital returns forecasted to exceed the cost of capital, HE is expected to continue to be a Value Builder.
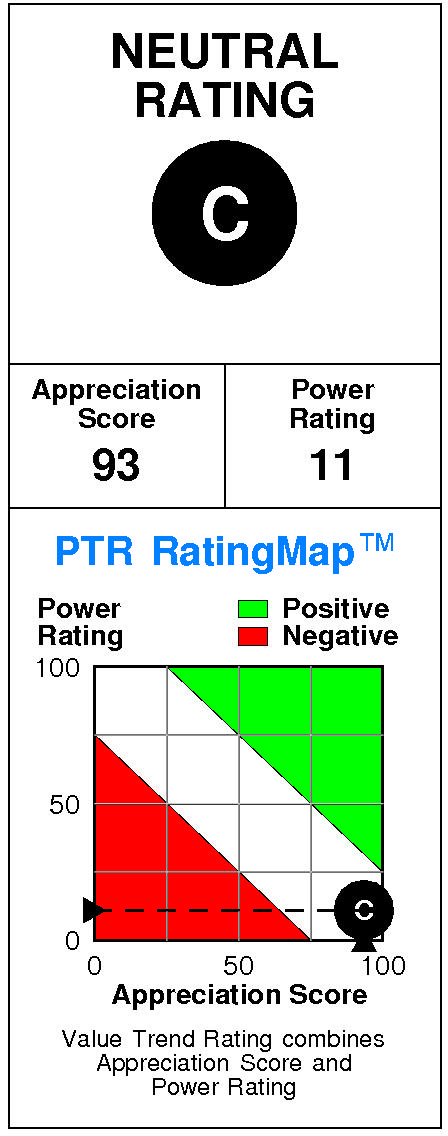
Hawaiian Electric Industries has a current Value Trend Rating of C (Neutral).
This rating combines very contradictory signals from two proprietary PTR measures of a stock’s attractiveness. Hawaiian Electric Industries has a very high Appreciation Score of 93 but a very low Power Rating of 11, leading to the Neutral Value Trend Rating.
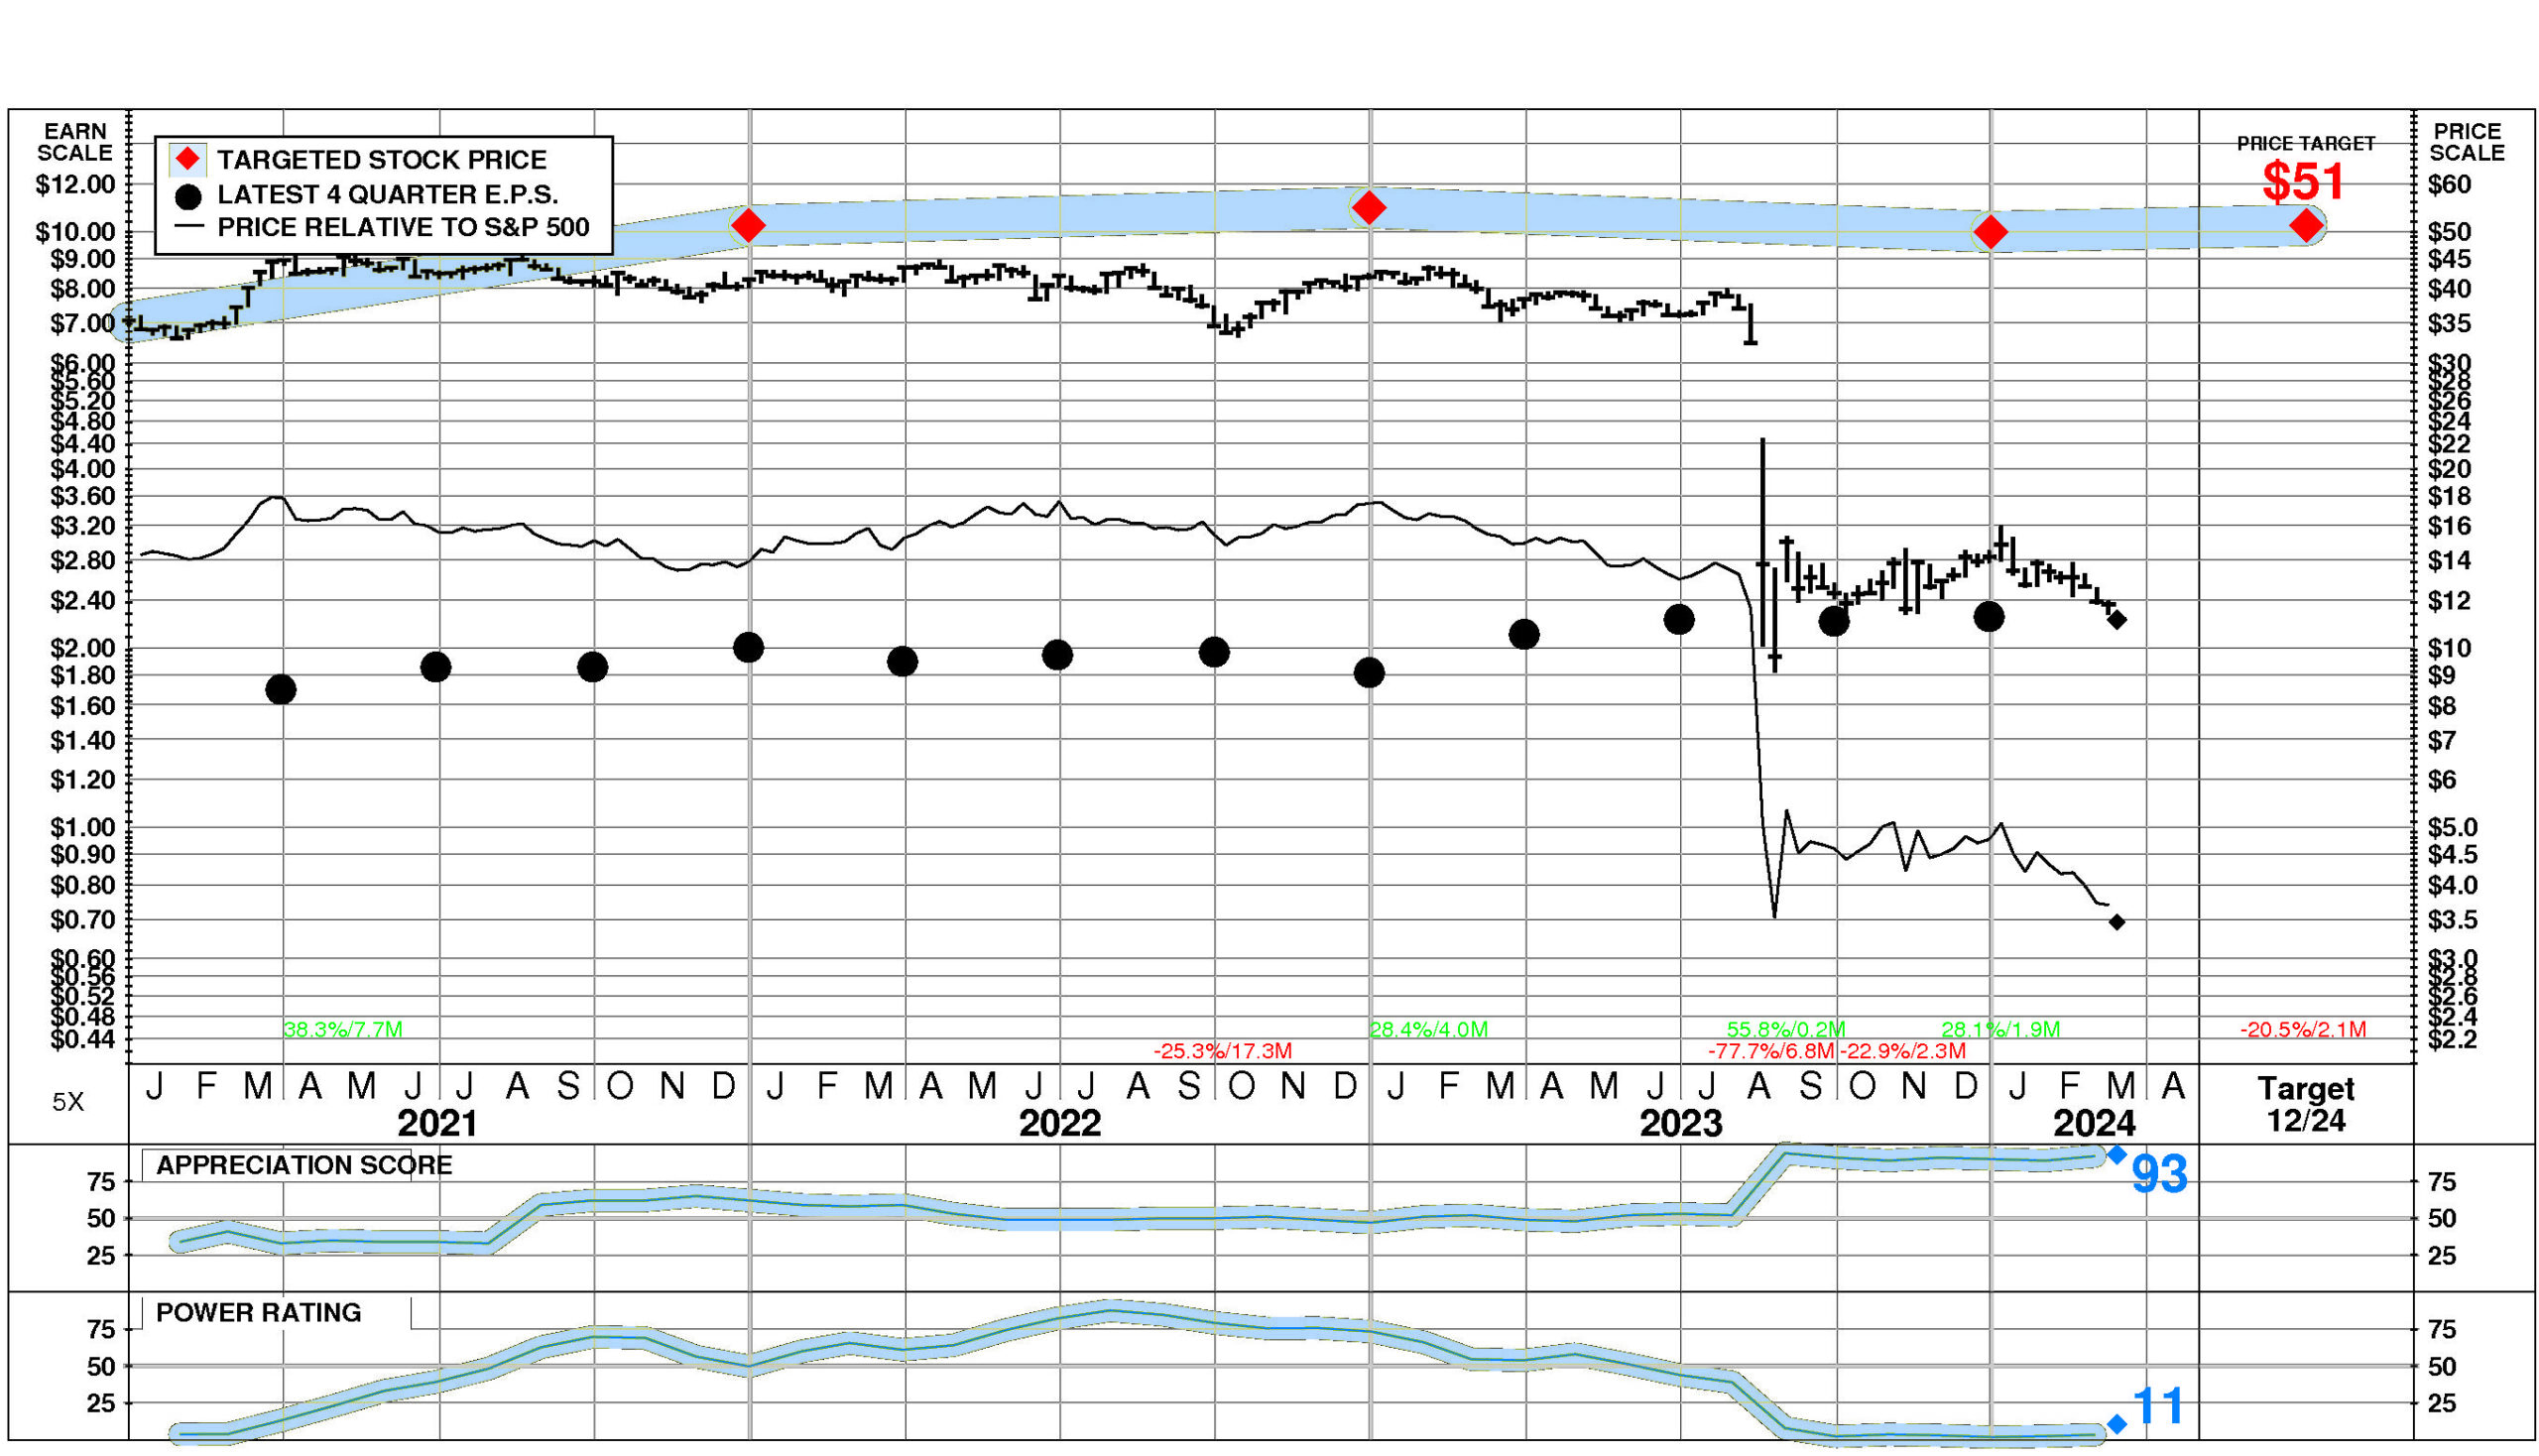
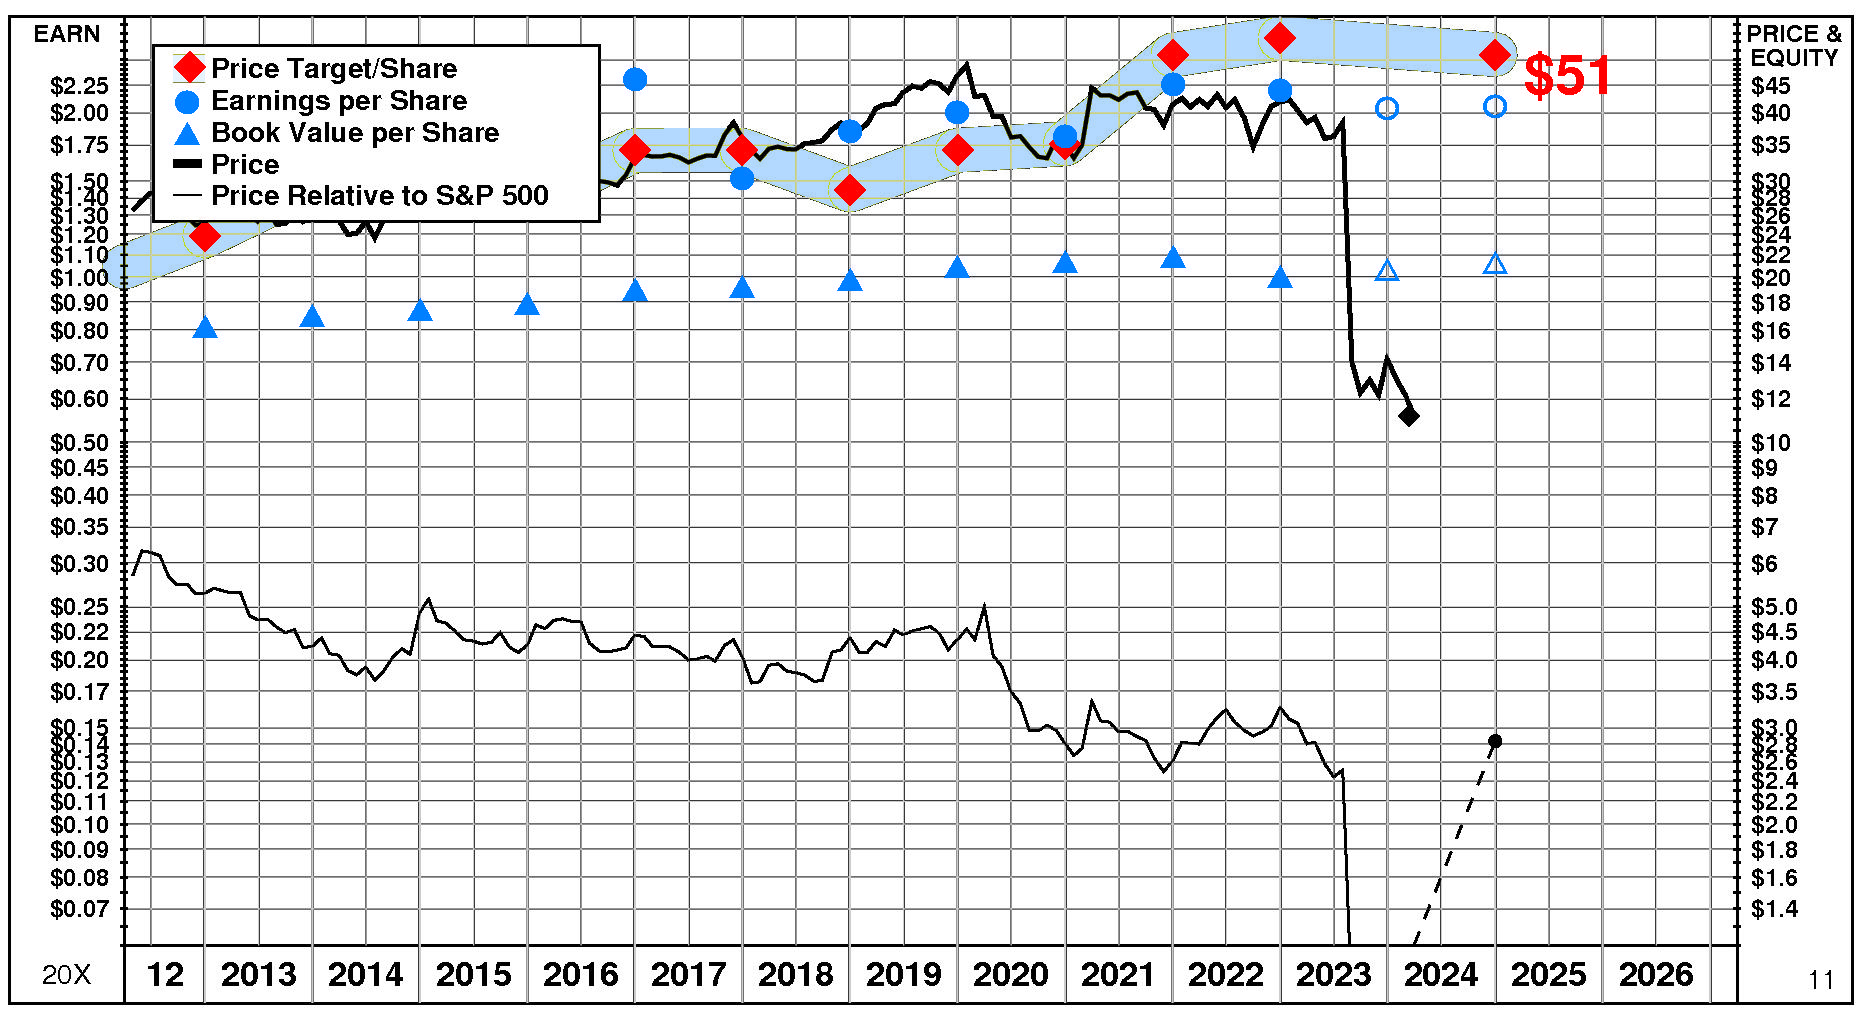
Hawaiian Electric Industries’ stock is selling well below targeted value. The current stock price of $11.16 compares to targeted value 12 months forward of $51.
Hawaiian Electric Industries’ very high appreciation potential results in an appreciation score of 93 (only 7% of the universe has greater appreciation potential.)
Hawaiian Electric Industries has a Power Rating of 11. (This very low Power Rating indicates that HE only has a better chance of achieving attractive investment performance over the near to intermediate term than 11% of companies in the universe.)
Factors contributing to this very low Power Rating include: recent price action has been extremely unfavorable; and the Electric Services comparison group is currently in an unfavorable position. An offsetting factor is earnings estimate behavior for HE has been slightly favorable recently.
INVESTMENT PROFILE
HE’s financial strength is below average. Financial strength rating is 40.
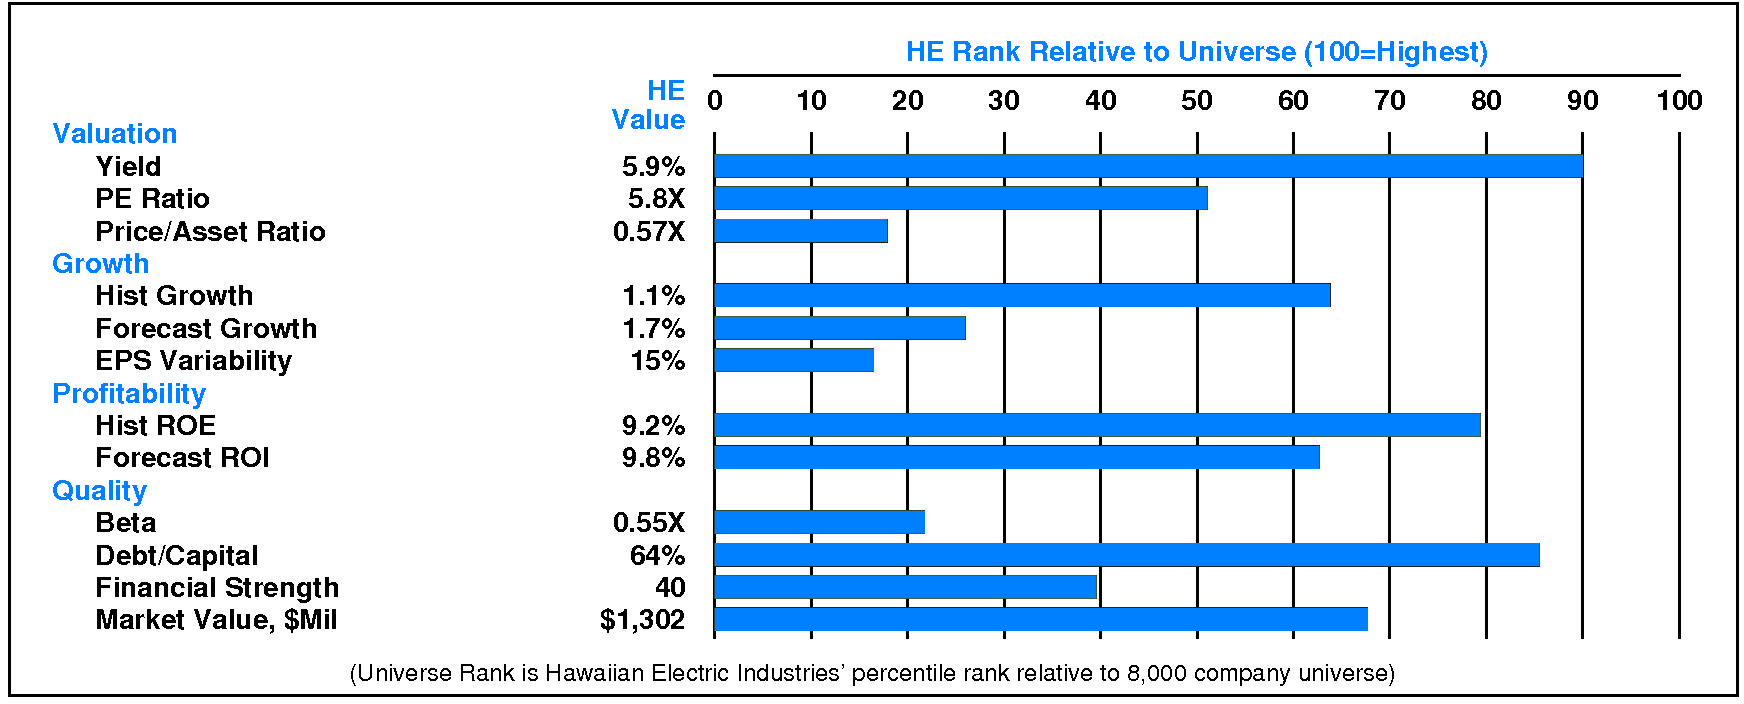
Relative to the S&P 500 Composite, Hawaiian Electric Industries Inc has significant Value characteristics; its appeal is likely to be to investors heavily oriented toward Income; the perception is that HE is normal risk. Relative weaknesses include: low forecasted profitability, low financial strength, high financial leverage, low expected growth, and low historical growth. HE’s valuation is low: high dividend yield, low P/E ratio, and low price/book ratio. HE has unusually low market capitalization.
CURRENT SIGNALS
Hawaiian Electric Industries’ current operations are eroding. Return on equity is falling, reflecting: declining pretax margin; and falling leverage.
Hawaiian Electric Industries’ current technical position is very weak. The stock price is in a 2.1 month down move. The stock has declined 17.0% from its prior high. The stock price is below its 200 day moving average which is in a downtrend. Hawaiian Electric Industries’ stock price decline is extreme and the stock appears oversold.
ALERTS
Recent meaningful negative changes in investment behavior have impacted Hawaiian Electric Industries Inc (NYSE: HE): negative upside/downside volume developed.
The stock is currently rated C.
On 3/13/24, Hawaiian Electric Industries Inc (NYSE: HE) stock declined slightly by -1.0%, closing at $11.16. NORMAL trading volume accompanied the decline. The stock has declined -4.0% during the last week and has been extremely weak relative to the market over the last nine months.
CASH FLOW
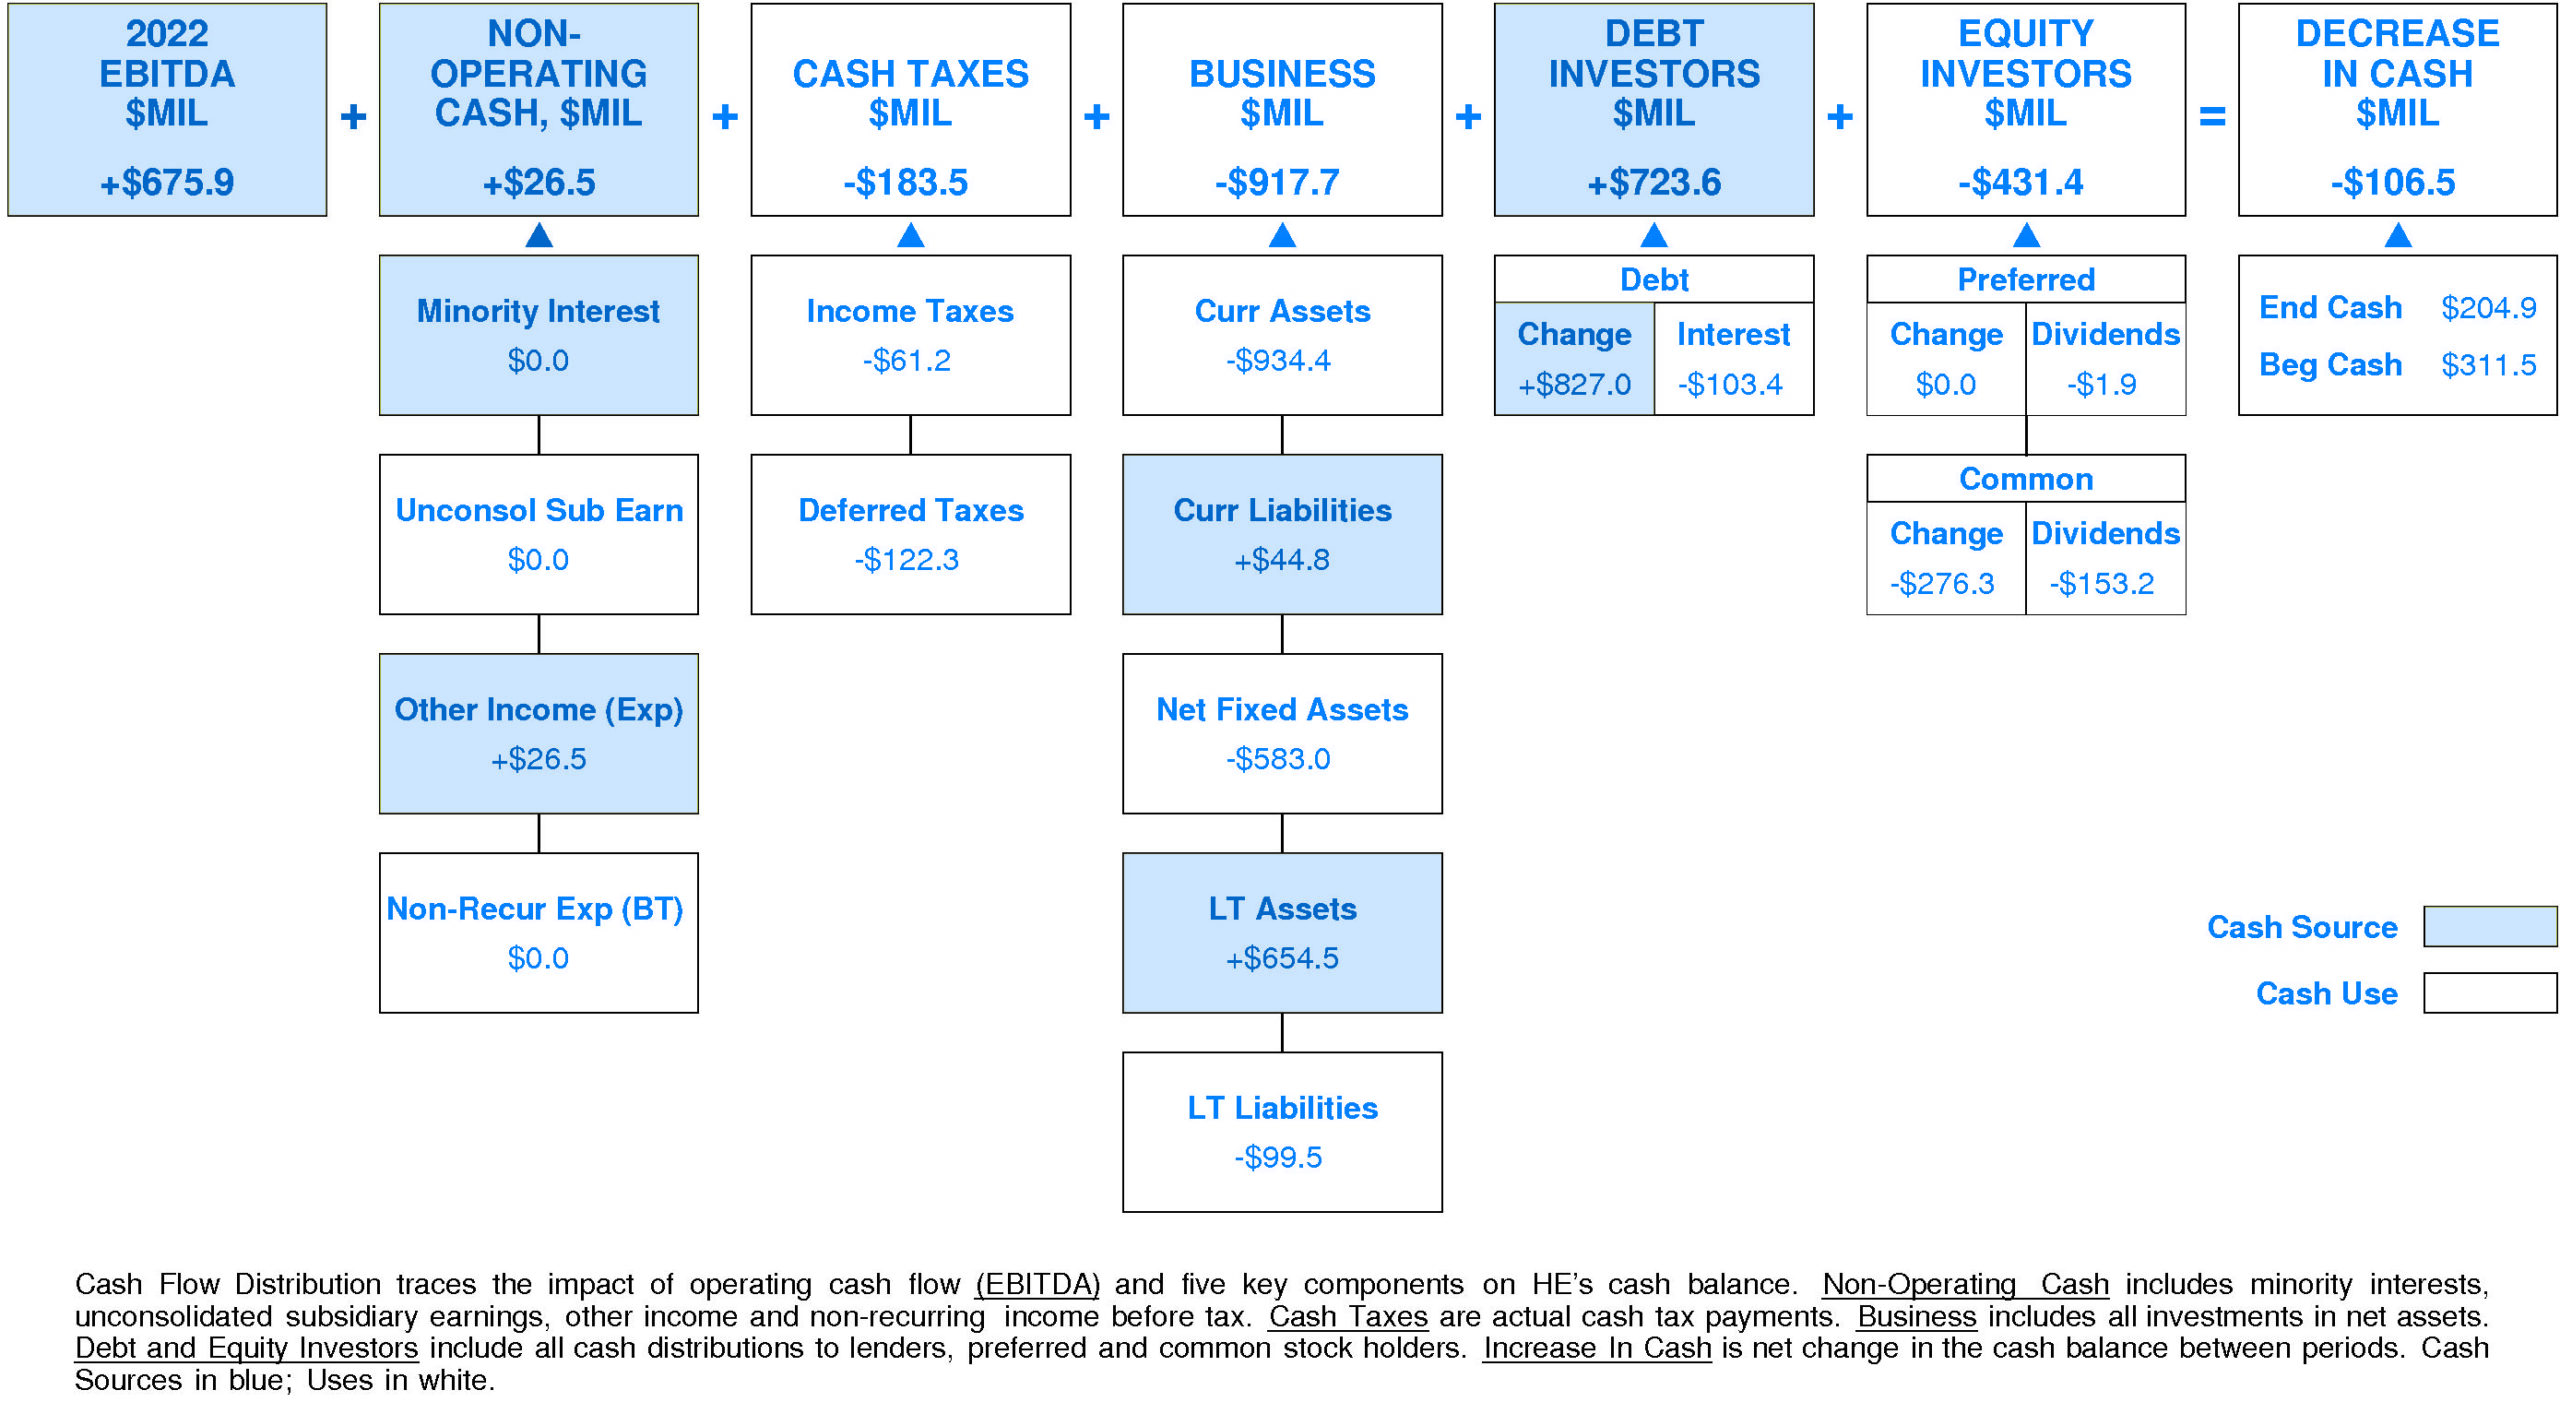
In 2022, Hawaiian Electric Industries experienced a very significant reduction in cash of -$106.5 million (-34%). Sources of cash were much lower than uses. Cash generated from 2022 EBITDA totaled +$675.9 million. Non-operating sources contributed +$26.5 million (+4% of EBITDA). Cash taxes consumed -$183.5 million (-27% of EBITDA). Re-investment in the business amounted to -$917.7 million (-136% of EBITDA). On a net basis, debt investors contributed +$723.6 million (+107% of EBITDA) while equity investors removed -$431.4 million (-64% of EBITDA).
HE’s Non-operating Income, %EBITDA has exhibited little to no overall change over the period. This stability was accompanied by stability for the Hawaiian Electric Industries Peer Group as well. In most years, Hawaiian Electric Industries was in the third quartile and second quartile. Currently, Hawaiian Electric Industries is below median at +4% of EBITDA (+$26.5 million).
HE’s Cash Taxes, %EBITDA has experienced a downtrend over the period. This downtrend was accompanied by an opposite trend for the Hawaiian Electric Industries Peer Group. (Since 2020 Cash Taxes, %EBITDA has accelerated very sharply.) In most years, Hawaiian Electric Industries was in the lower quartile and second quartile. Currently, Hawaiian Electric Industries is lower quartile at -27% of EBITDA (-$183.5 million).
HE’s Business Re-investment, %EBITDA has experienced a downtrend over the period. This downtrend was accompanied by a similar trend for the Hawaiian Electric Industries Peer Group. (Since 2020 Business Re-investment, %EBITDA has accelerated very sharply.) In most years, Hawaiian Electric Industries was in the top quartile and second quartile. Currently, Hawaiian Electric Industries is substantially below median at -136% of EBITDA (-$917.7 million).
HE’s Debt Investors, %EBITDA has experienced a volatile overall uptrend over the period. This improvement was accompanied by a similar trend for the Hawaiian Electric Industries Peer Group. (Since 2020 Debt Investors, %EBITDA has accelerated very sharply.) In most years, Hawaiian Electric Industries was in the second quartile and top quartile. Currently, Hawaiian Electric Industries is upper quartile at +107% of EBITDA (+$723.6 million).
HE’s Equity Investors, %EBITDA has suffered a strong overall downtrend over the period. This downtrend was accompanied by an opposite trend for the Hawaiian Electric Industries Peer Group. (Since 2019 Equity Investors, %EBITDA has accelerated very sharply.) In most years, Hawaiian Electric Industries was in the lower quartile and second quartile. Currently, Hawaiian Electric Industries is lower quartile at -64% of EBITDA (-$431.4 million).
HE’s Change in Cash, %EBITDA has experienced a downtrend over the period. This downtrend was accompanied by stability for the Hawaiian Electric Industries Peer Group. (Since 2020 Change in Cash, %EBITDA has accelerated very sharply.) In most years, Hawaiian Electric Industries was in the lower quartile and top quartile. Currently, Hawaiian Electric Industries is lower quartile at -16% of EBITDA (-$106.5 million).
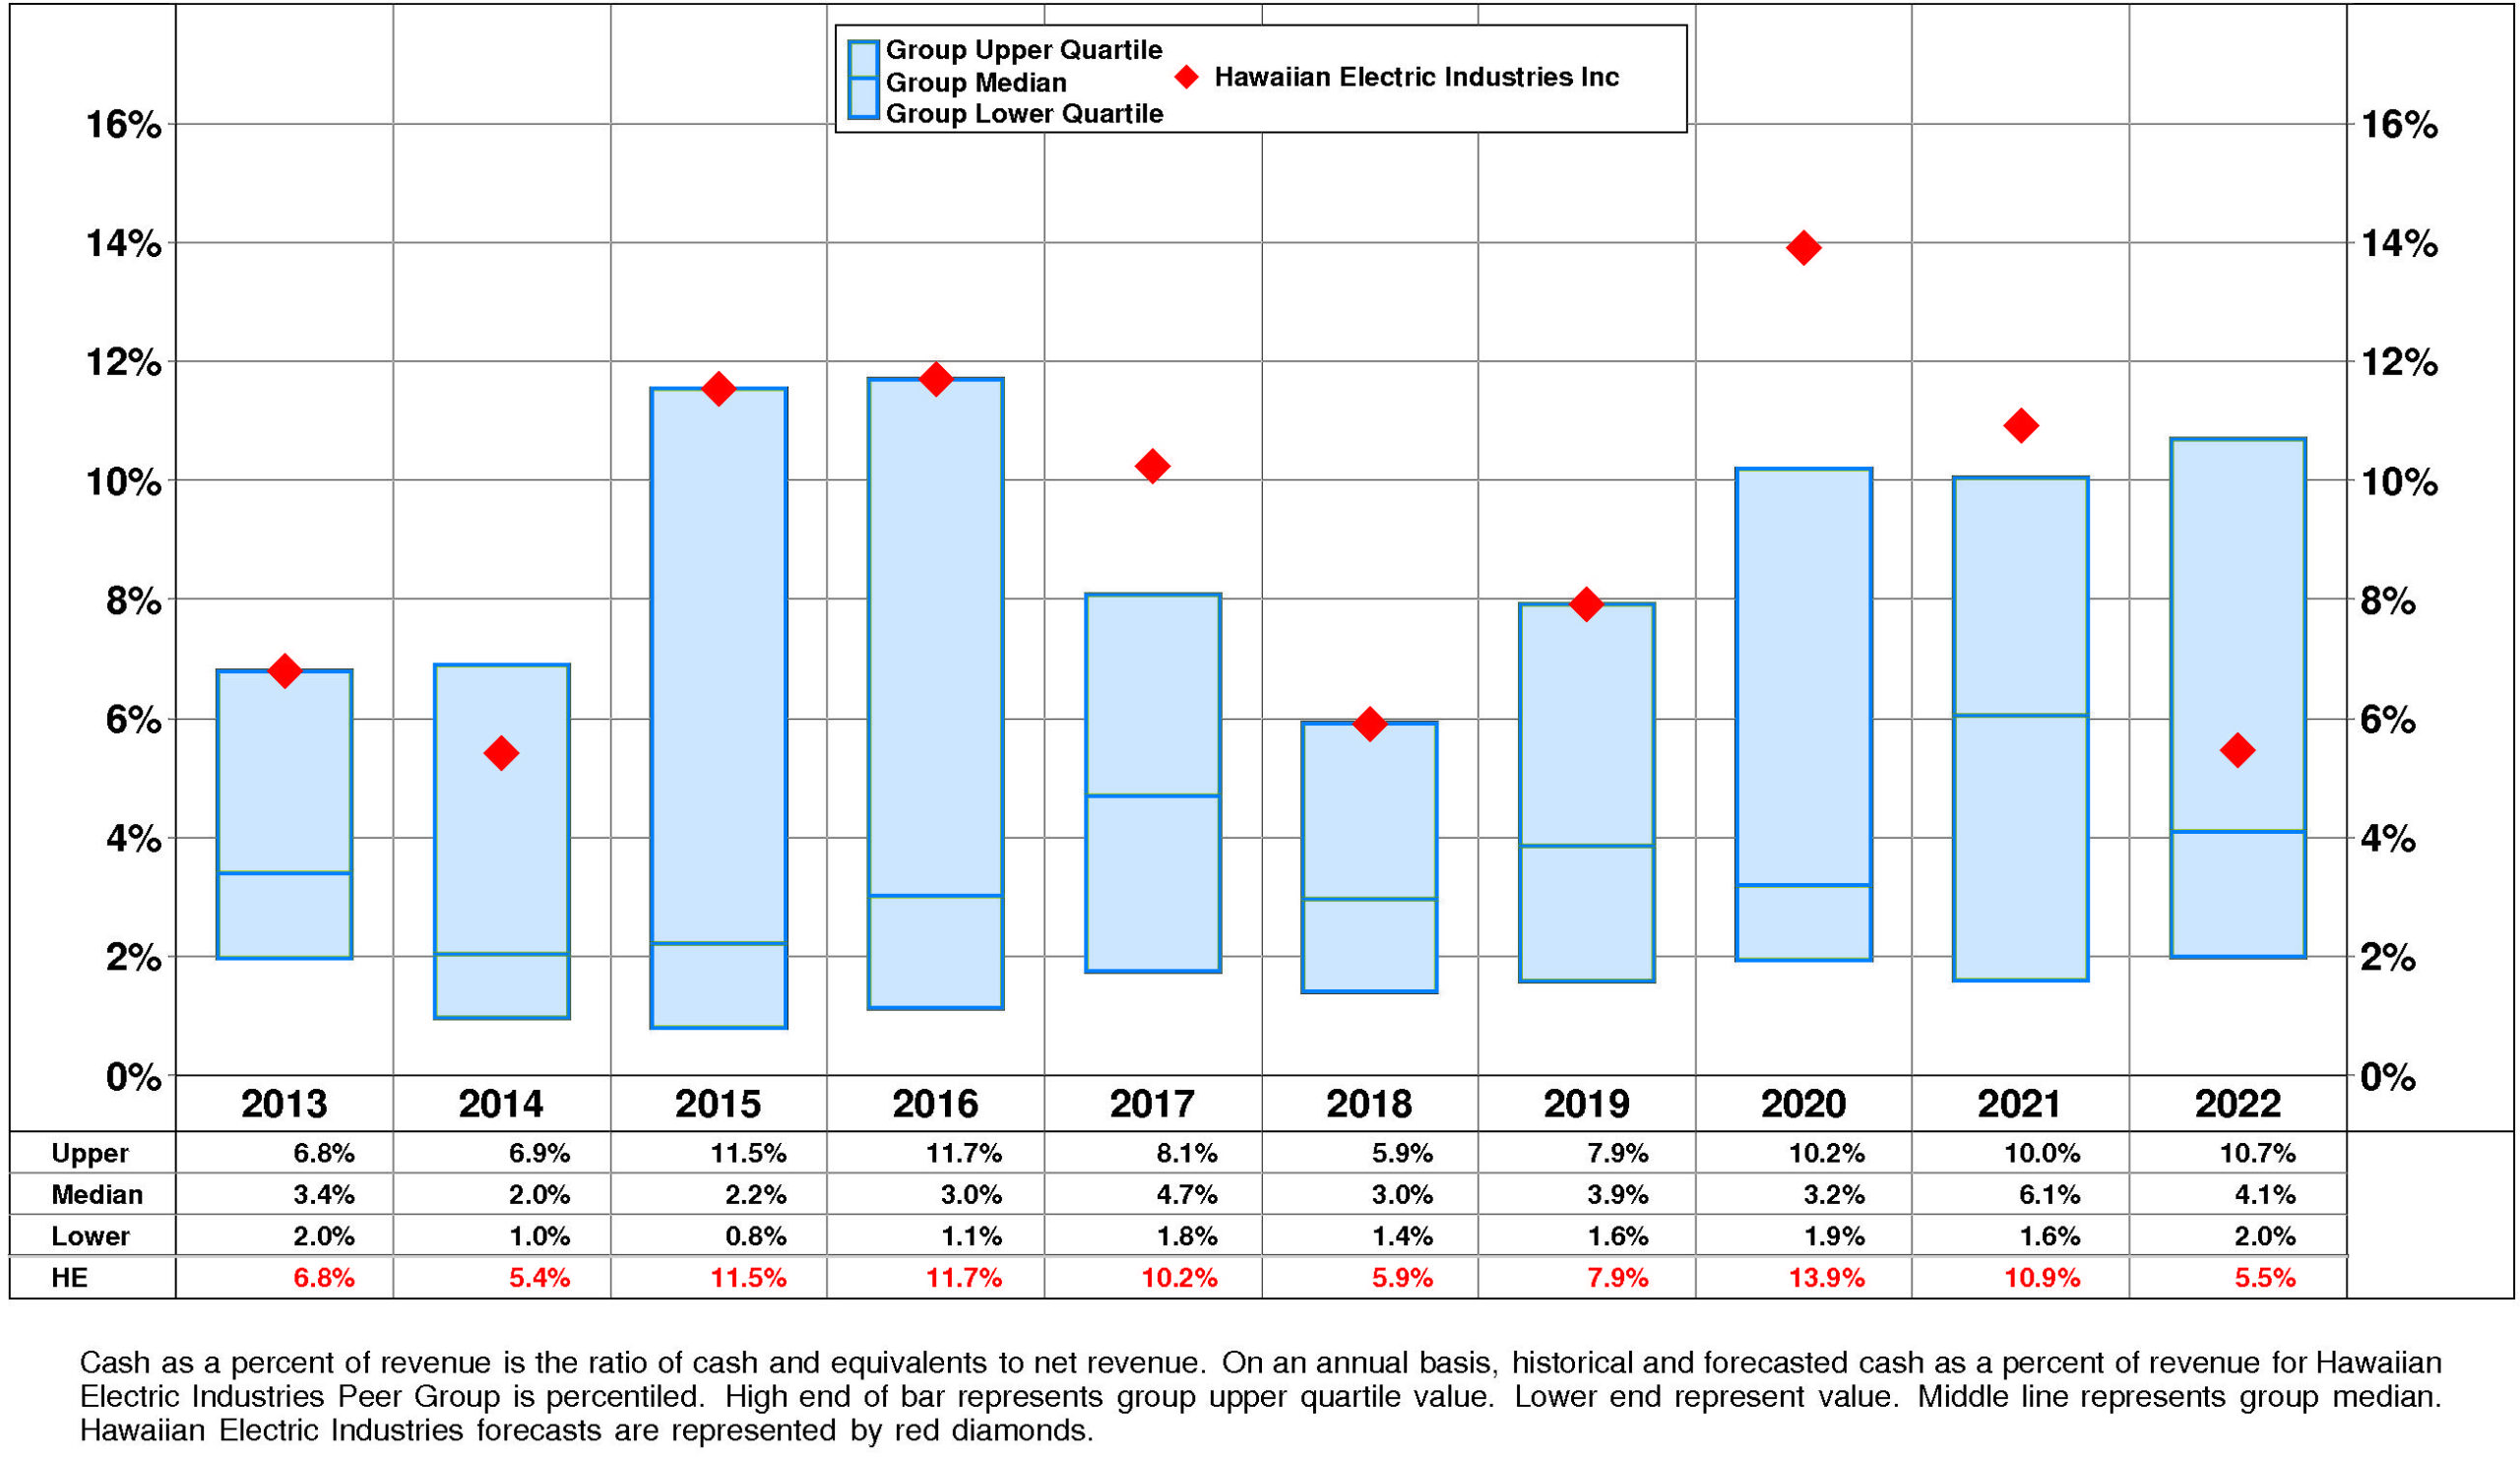
HE’s Cash, %Revenue has exhibited little to no overall change over the period. This stability was accompanied by stability for the Hawaiian Electric Industries Peer Group as well. (Since 2020 Cash, %Revenue has experienced a very sharp decline.) In most years, Hawaiian Electric Industries was in the top quartile. Currently, Hawaiian Electric Industries is slightly above median at +5%.
PROFITABILITY
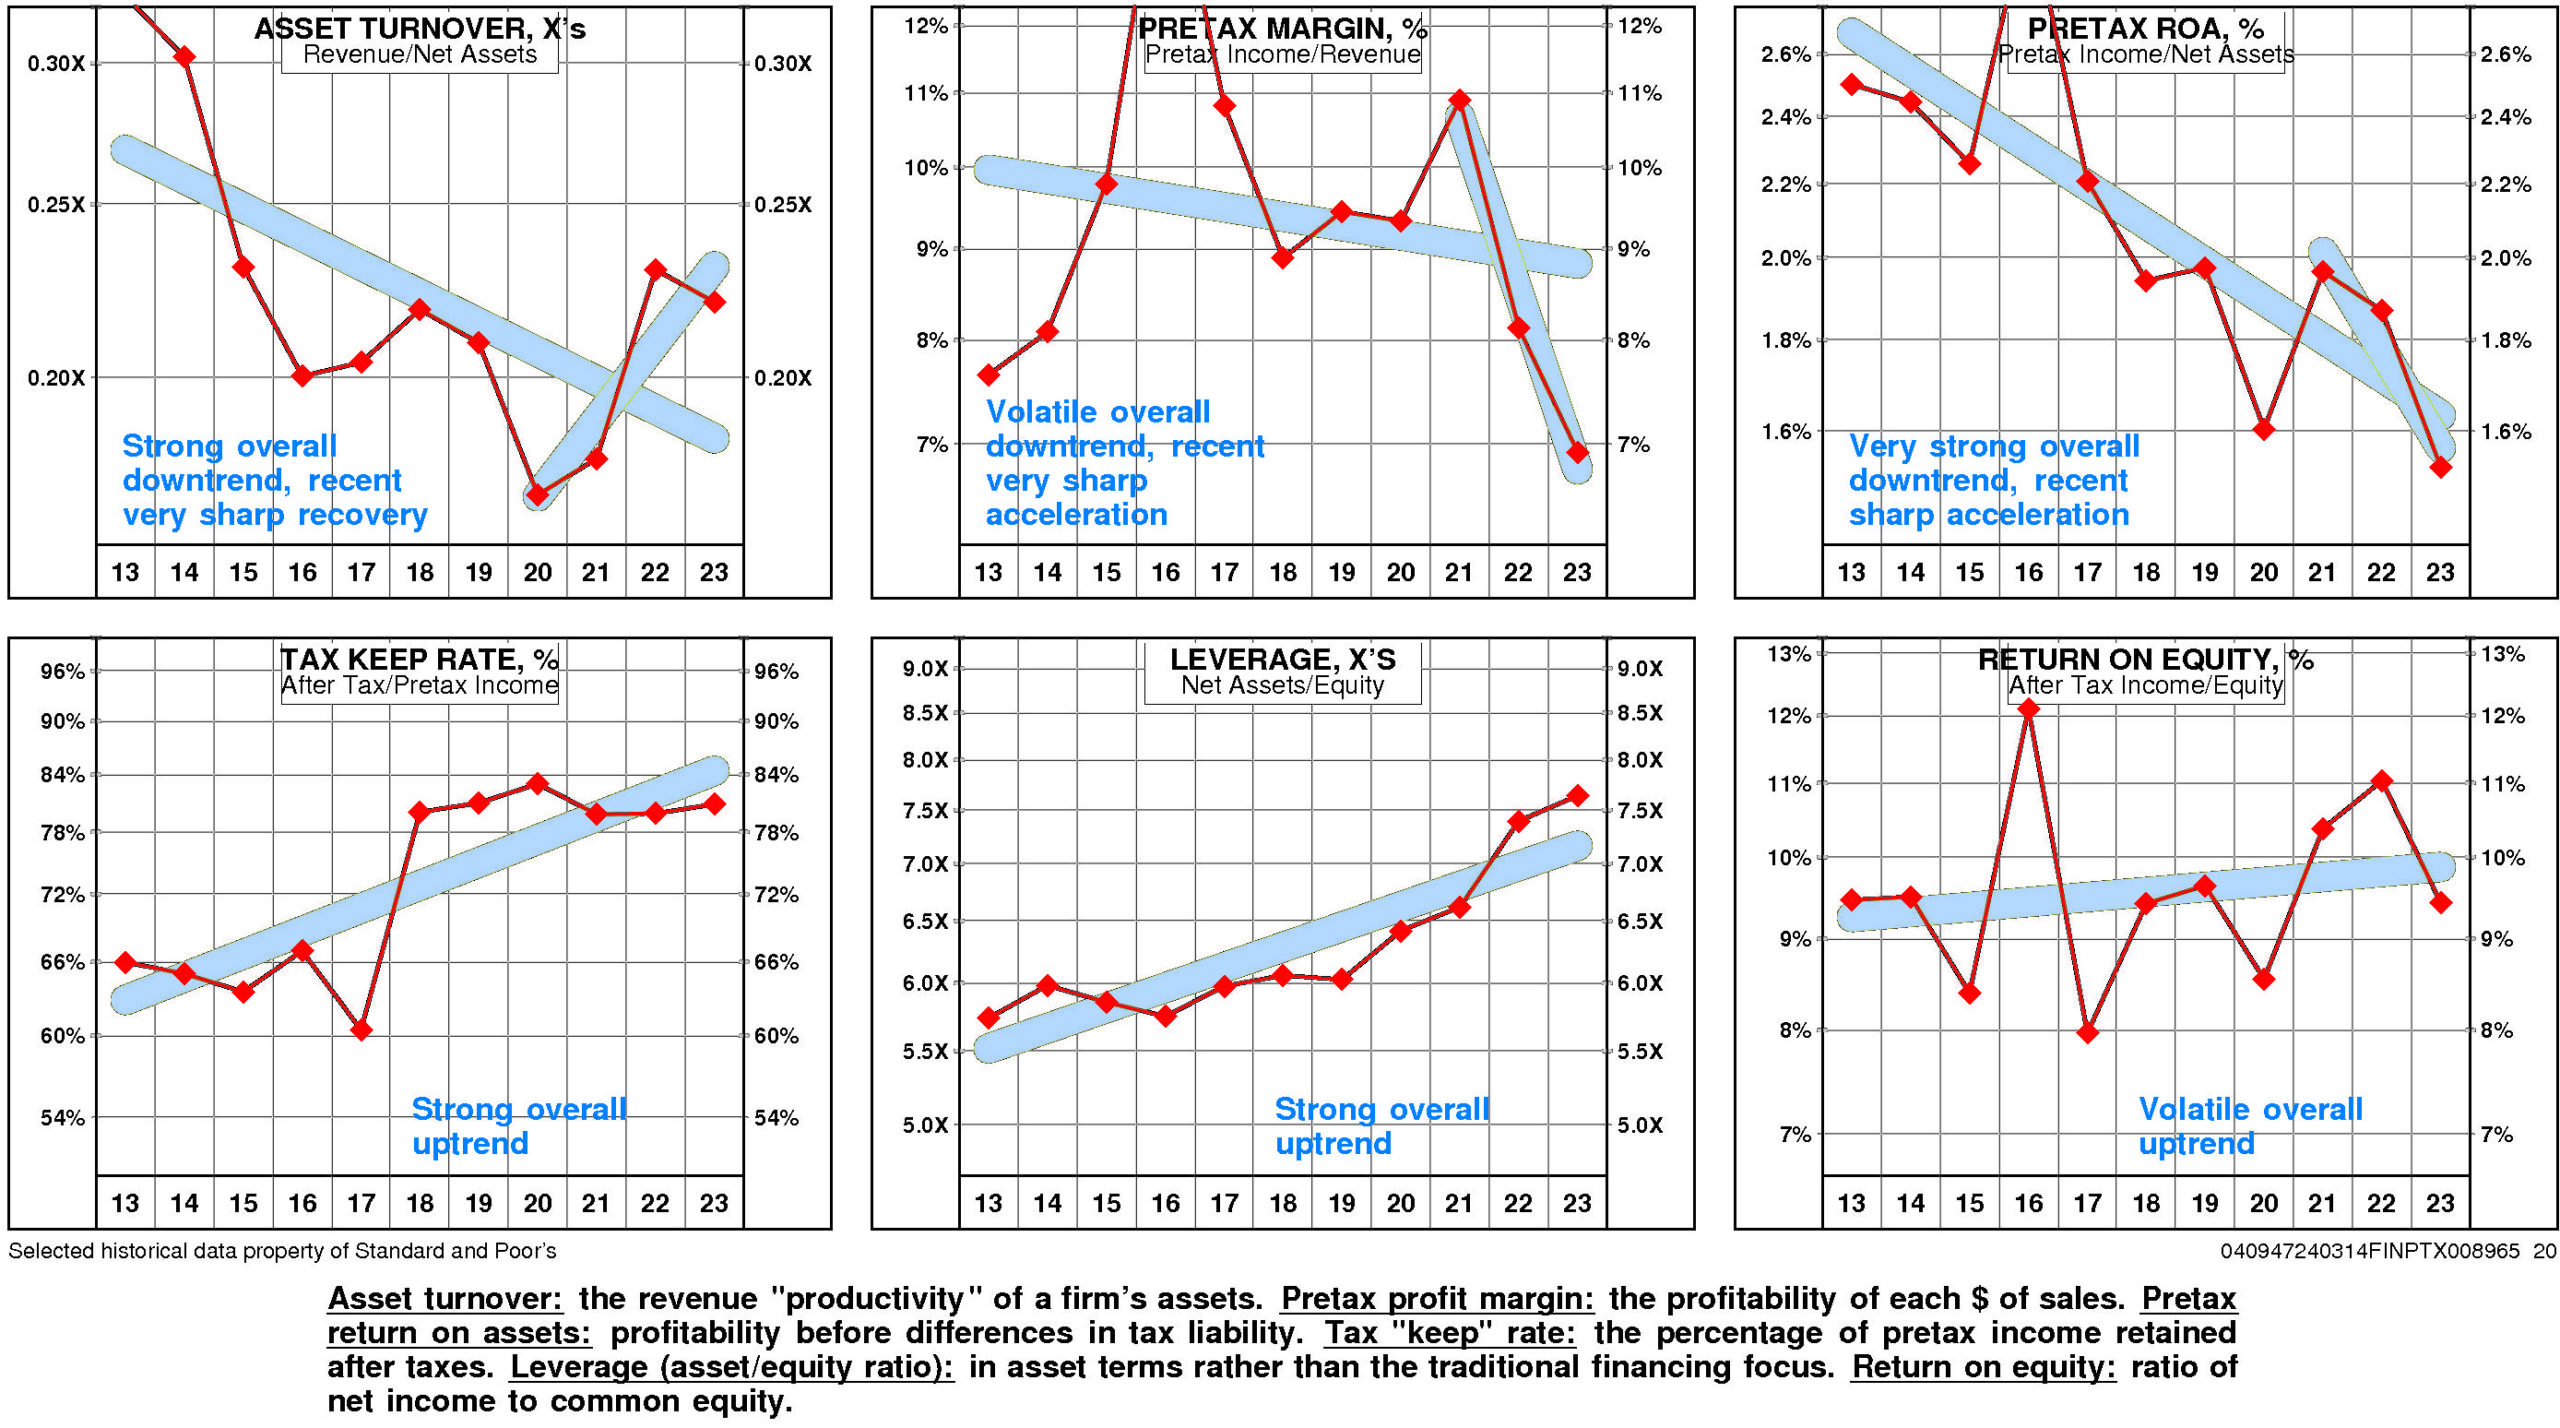
HE’s return on equity has improved slightly since 2013. The current level of 9.4% is 1.00X the low for the period and is -22.1% from the high.
A major analytical focus for HE is a very strong negative trend in pretax operating return significantly offset by a very strong positive trend in non-operating factors.
The productivity of HE’s assets declined over the full period 2013-2023: asset turnover has suffered a strong overall downtrend even as it experienced a very sharp recovery after the 2020 low.
Reinforcing this trend, pretax margin has experienced a downtrend that accelerated very sharply from the 2021 level.
Non-operating factors (income taxes and financial leverage) had a very significant positive influence on return on equity.
HE’s return on equity is at the upper quartile (9.4%) for the four quarters ended September, 2023.
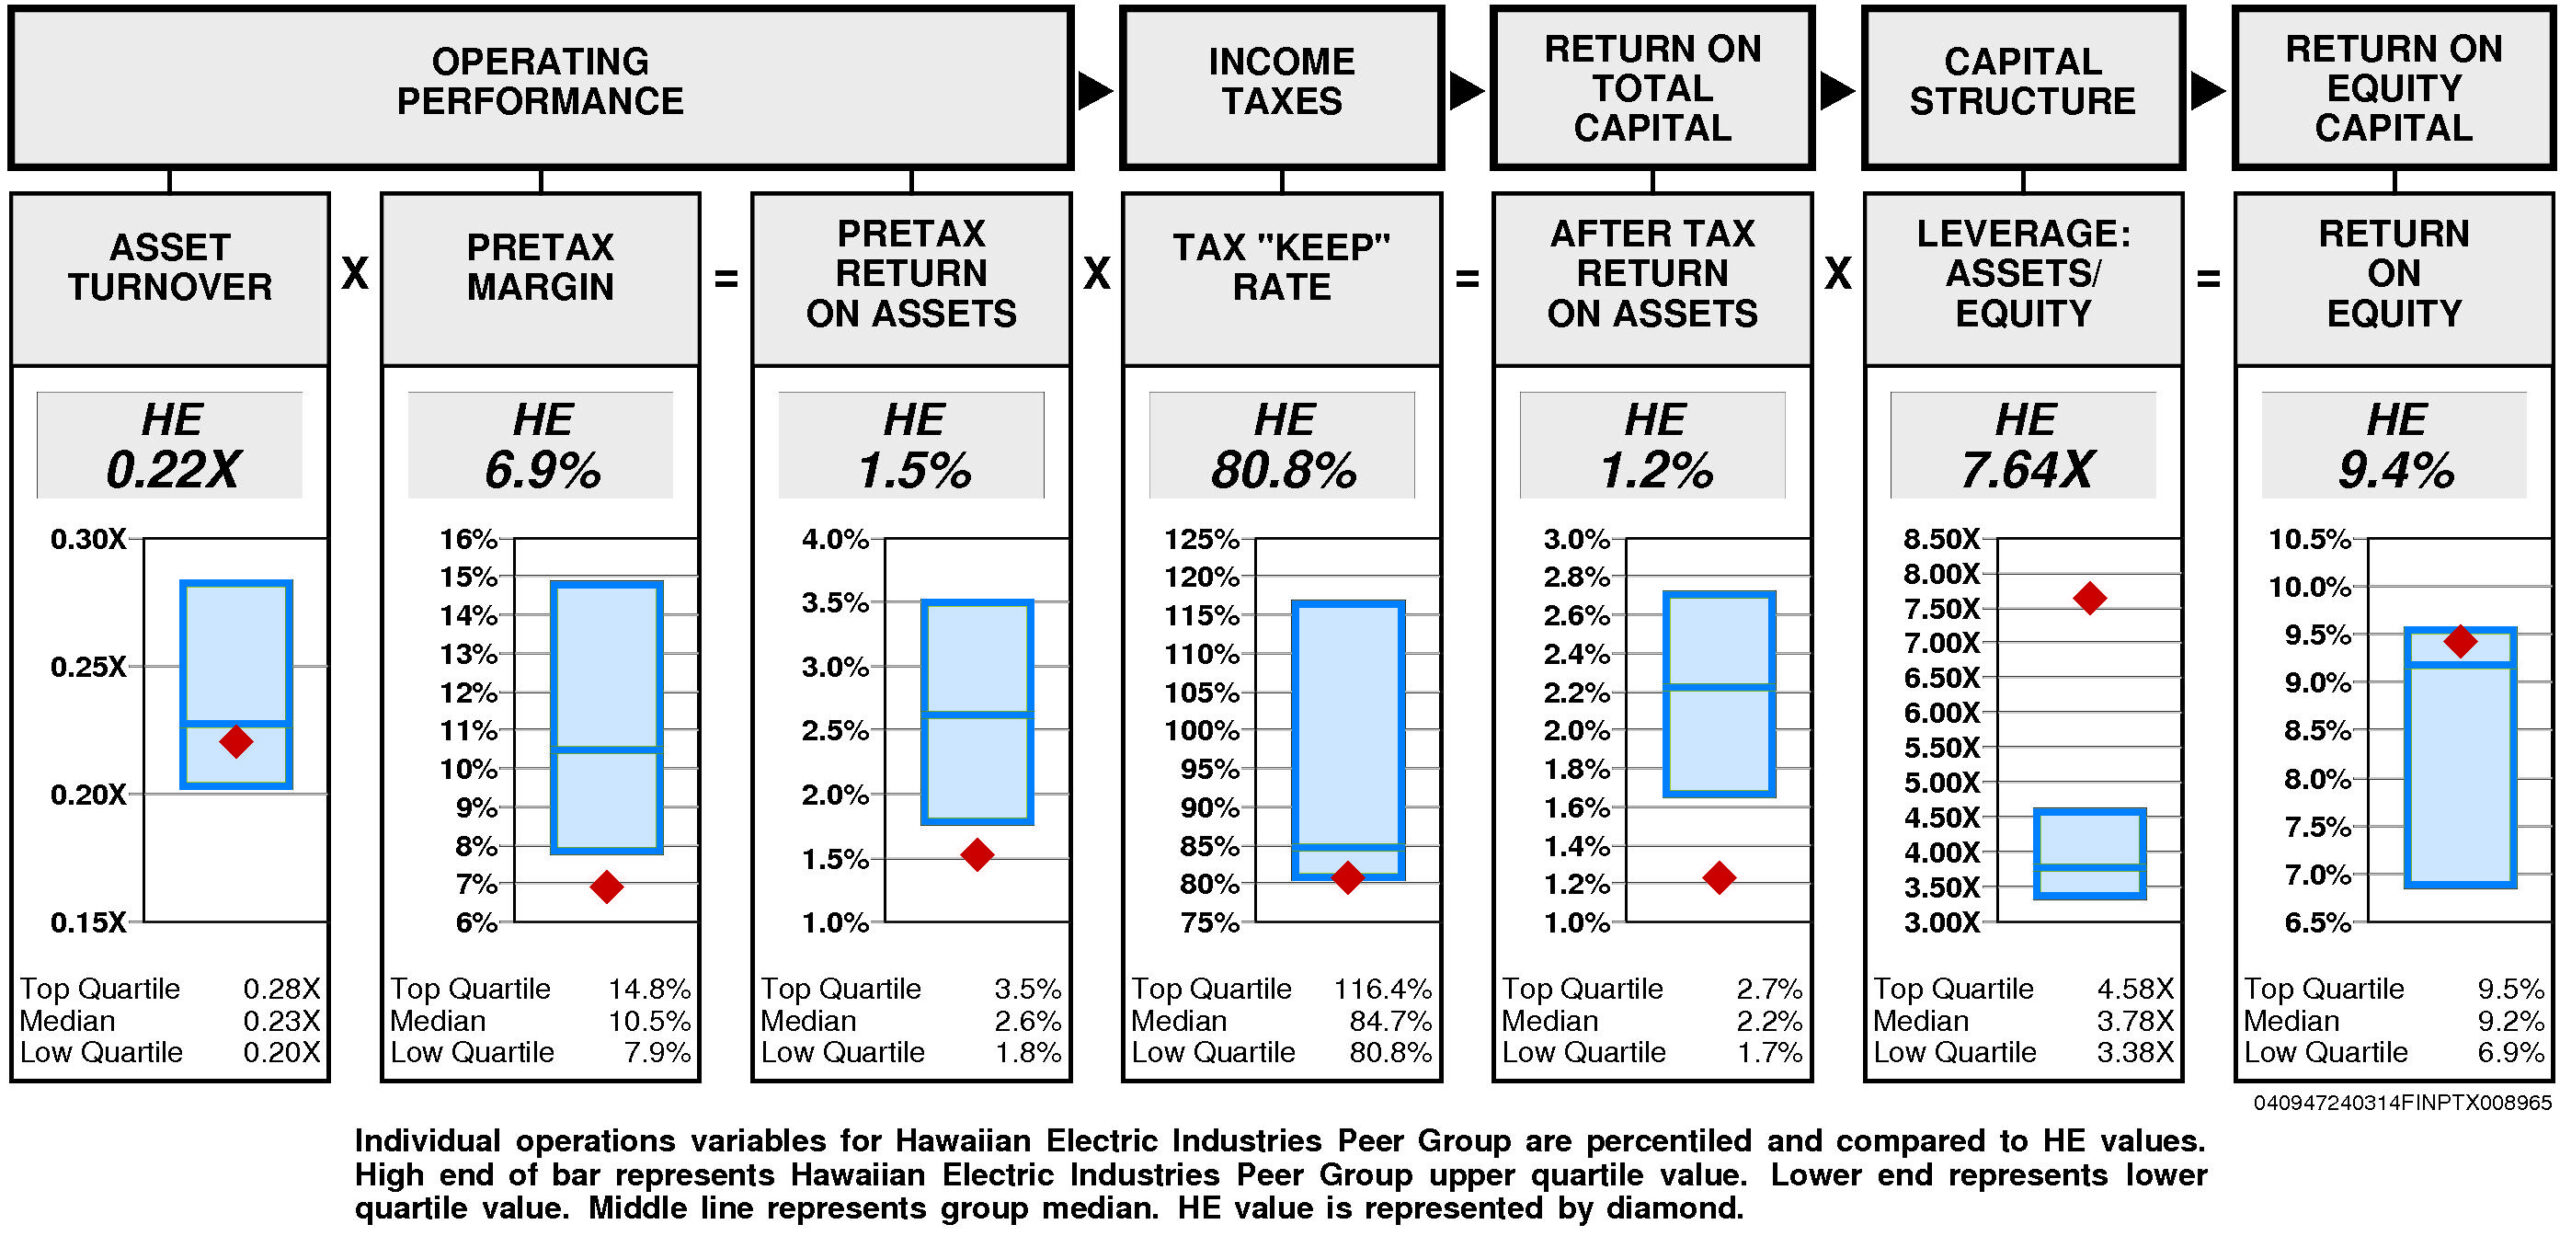
Operating performance (pretax return on assets) is lower quartile (1.5%) reflecting asset turnover that is below median (0.22X) and lower quartile pretax margin (6.9%).
Tax “keep” rate (income tax management) is at the lower quartile (80.8%) resulting in after tax return on assets that is lower quartile.
Financial leverage (leverage) is upper quartile (7.64X).
GROWTH RATES
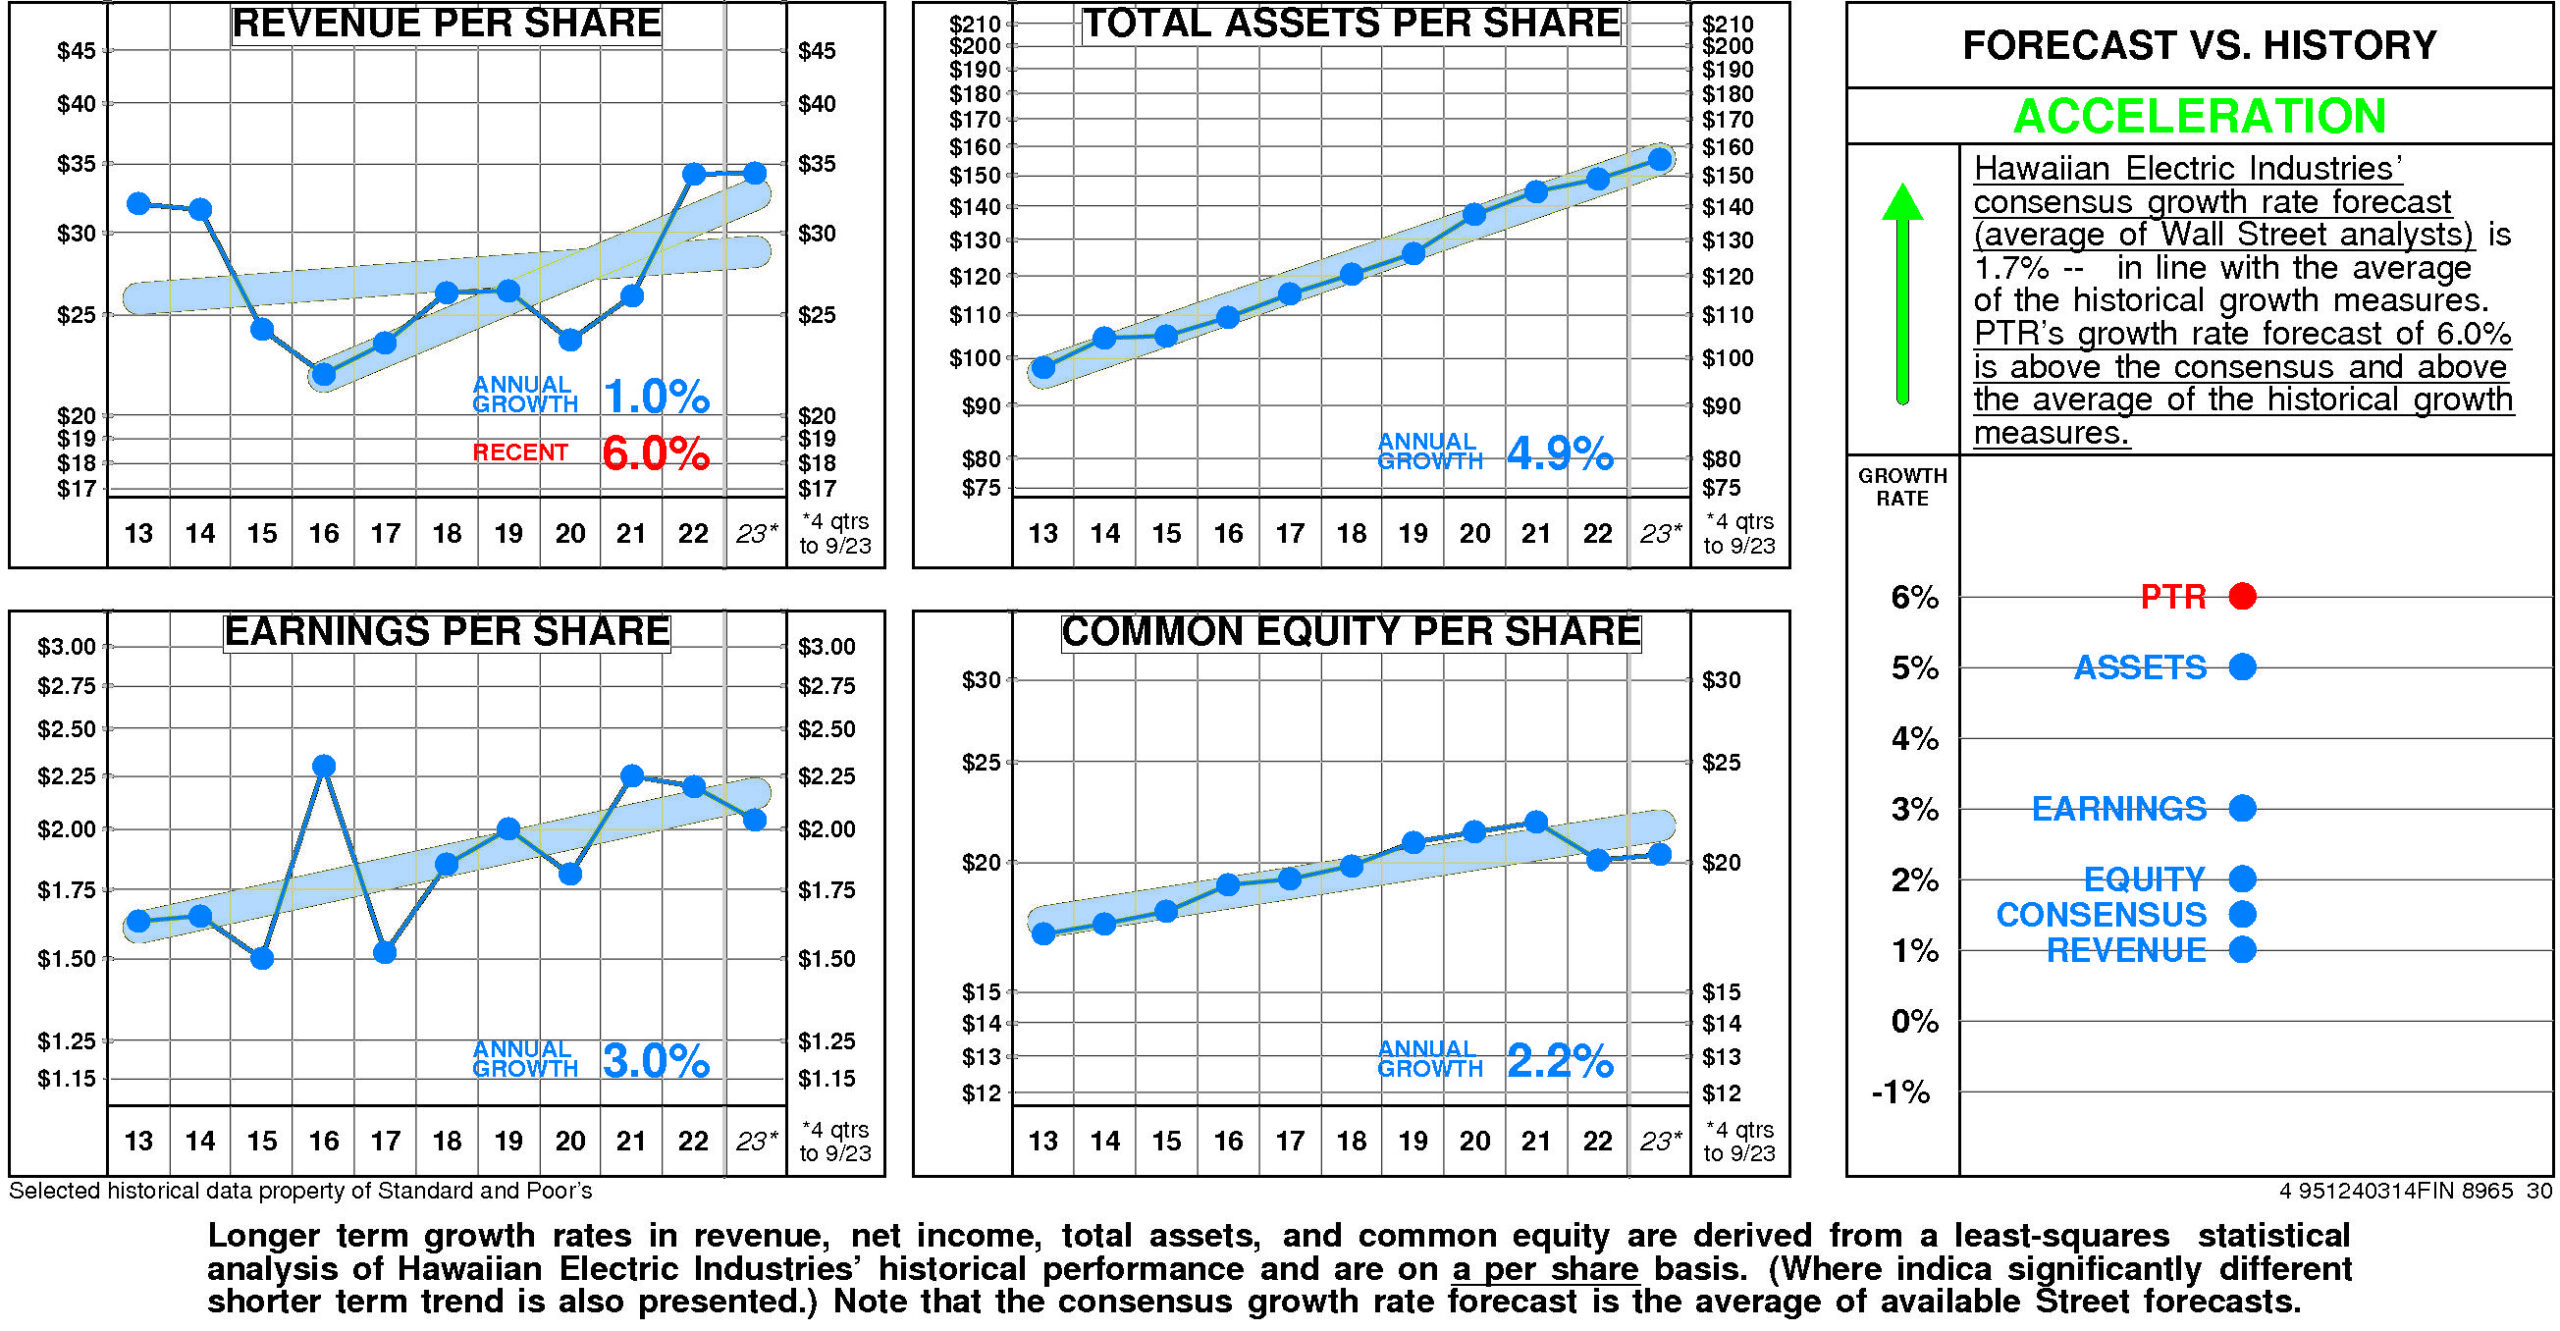
There are no significant differences between Hawaiian Electric Industries’ longer term growth and growth in recent years.
Hawaiian Electric Industries’ historical income statement growth has been in line with balance sheet growth. Revenue growth has paralleled asset growth; earnings growth has paralleled equity growth.
Annual revenue growth has been 1.0% per year. (More recently it has been 6.0%.)
Total asset growth has been 4.9% per year.
Annual E.P.S. growth has been 3.0% per year.
Equity growth has been 2.2% per year.
Hawaiian Electric Industries’ consensus growth rate forecast (average of Wall Street analysts) is 1.7% — in line with the average of the historical growth measures.
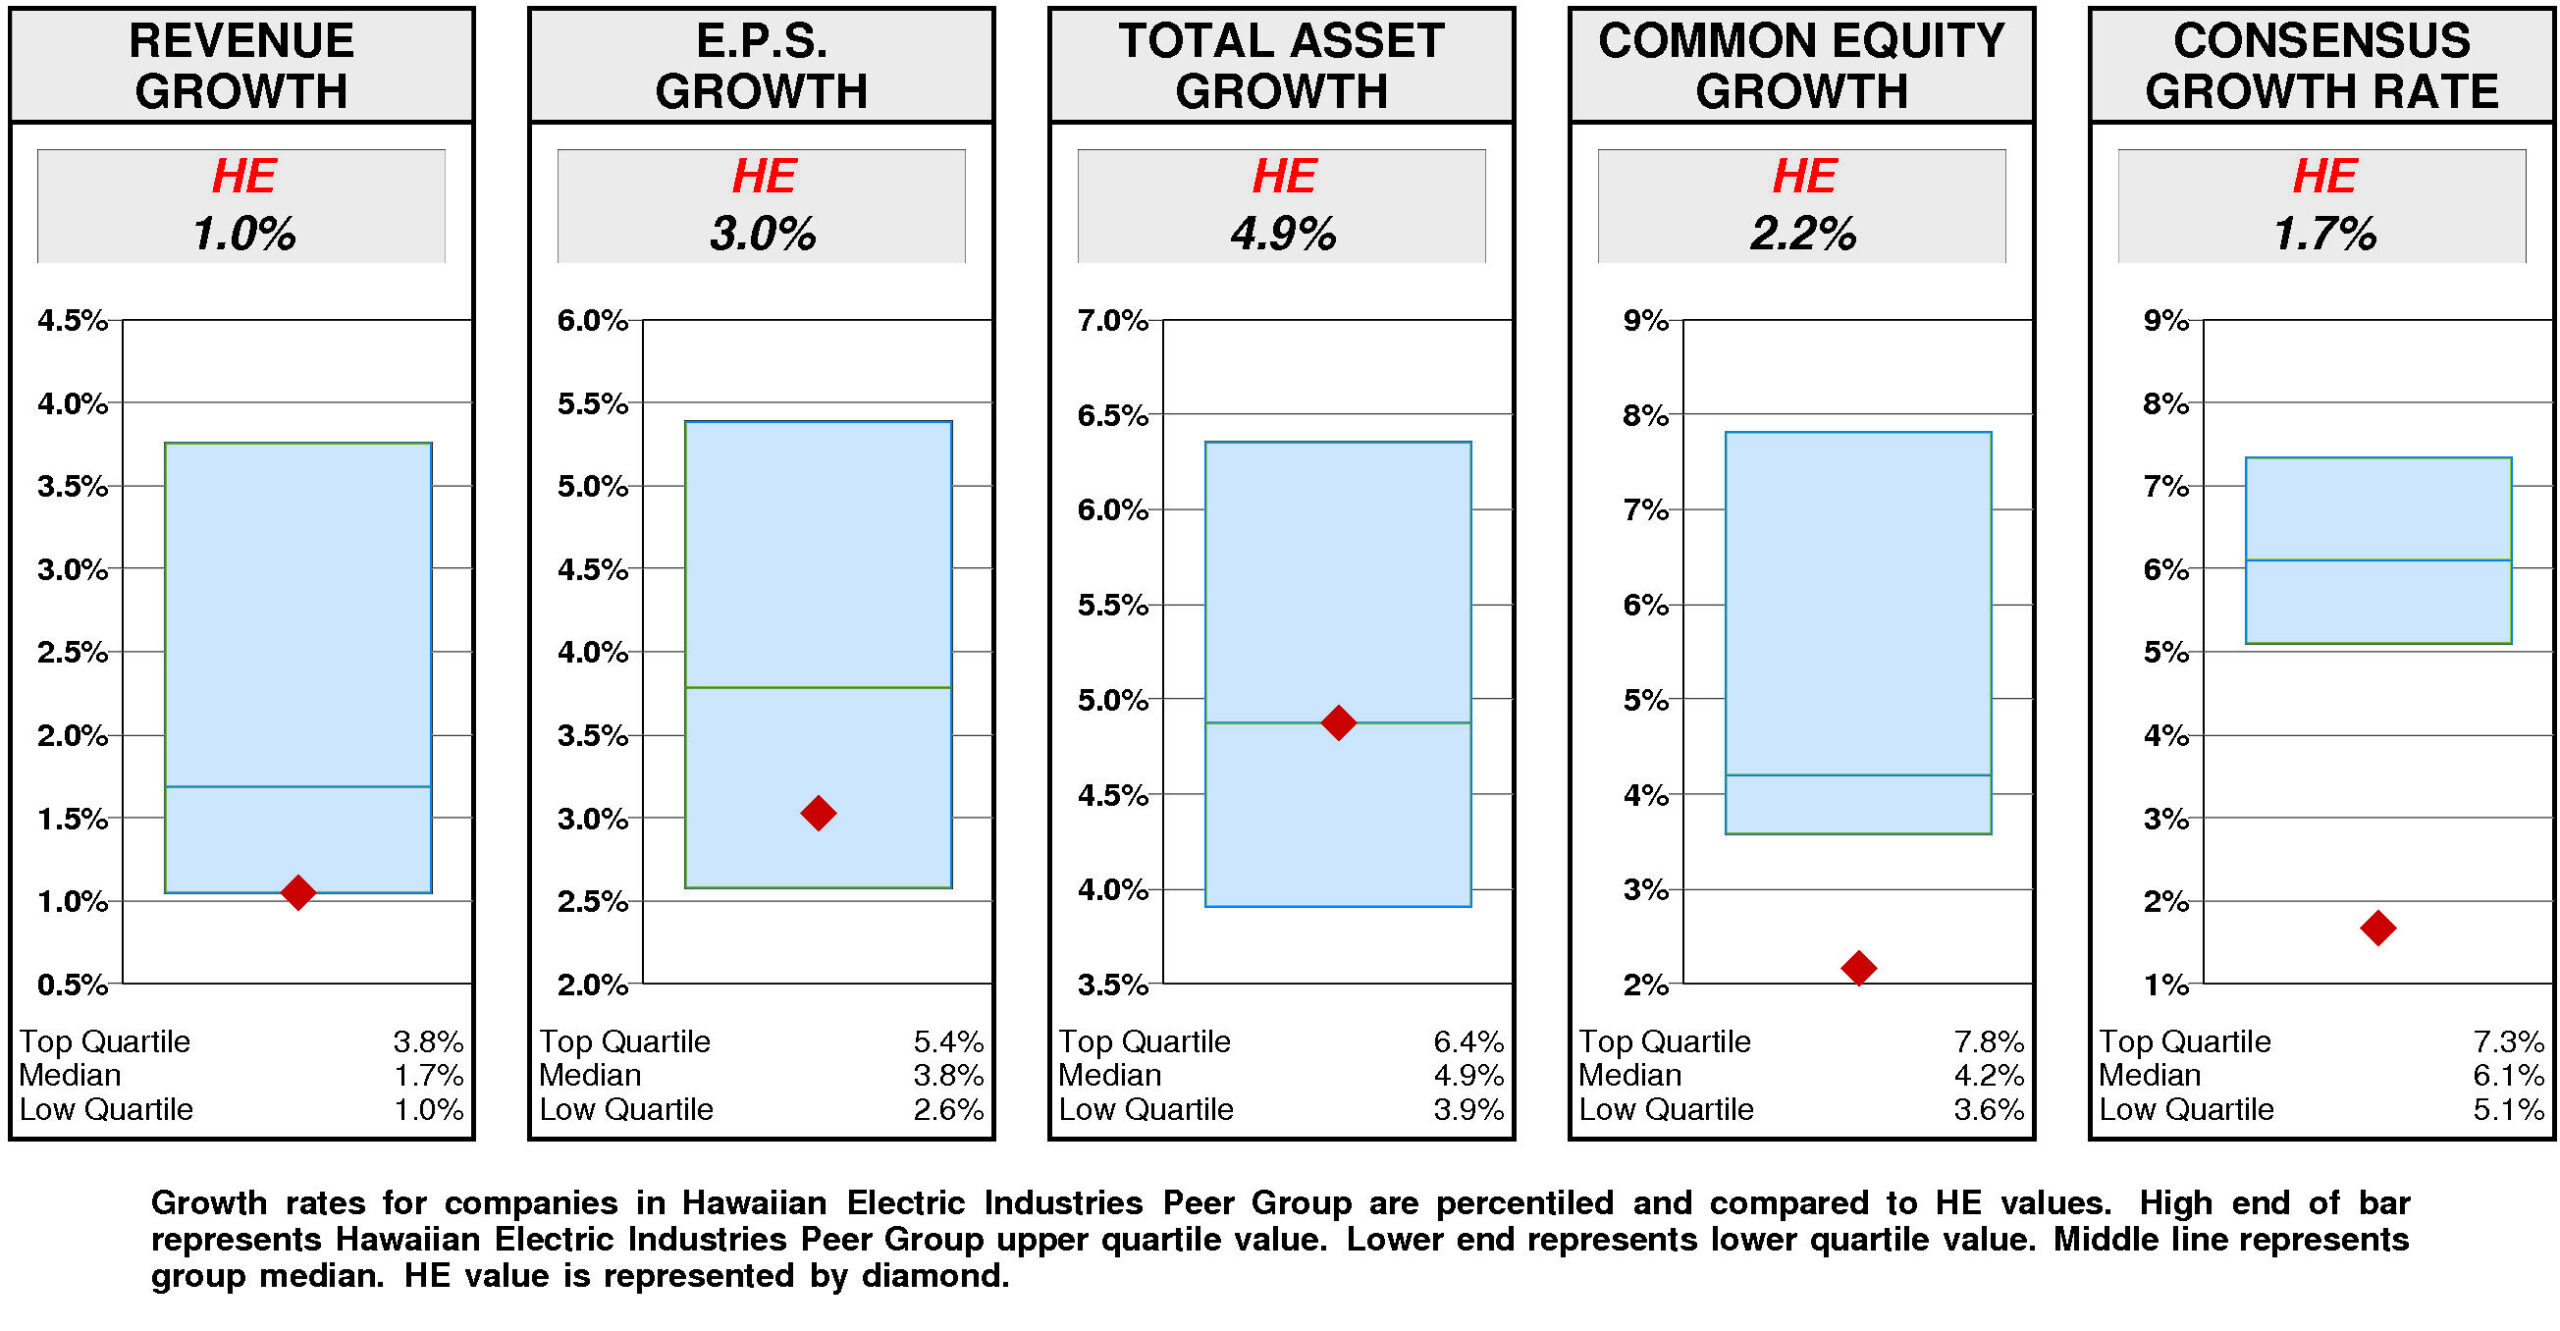
Relative to the Hawaiian Electric Industries Peer Group, Hawaiian Electric Industries’ historical growth measures are erratic. Total asset growth (4.9%) has been at median. E.P.S. growth (3.0%) has been below median. Revenue growth (1.0%) has been at the lower quartile. Equity growth (2.2%) has been lower quartile.
Consensus growth forecast (1.7%) is lower quartile.
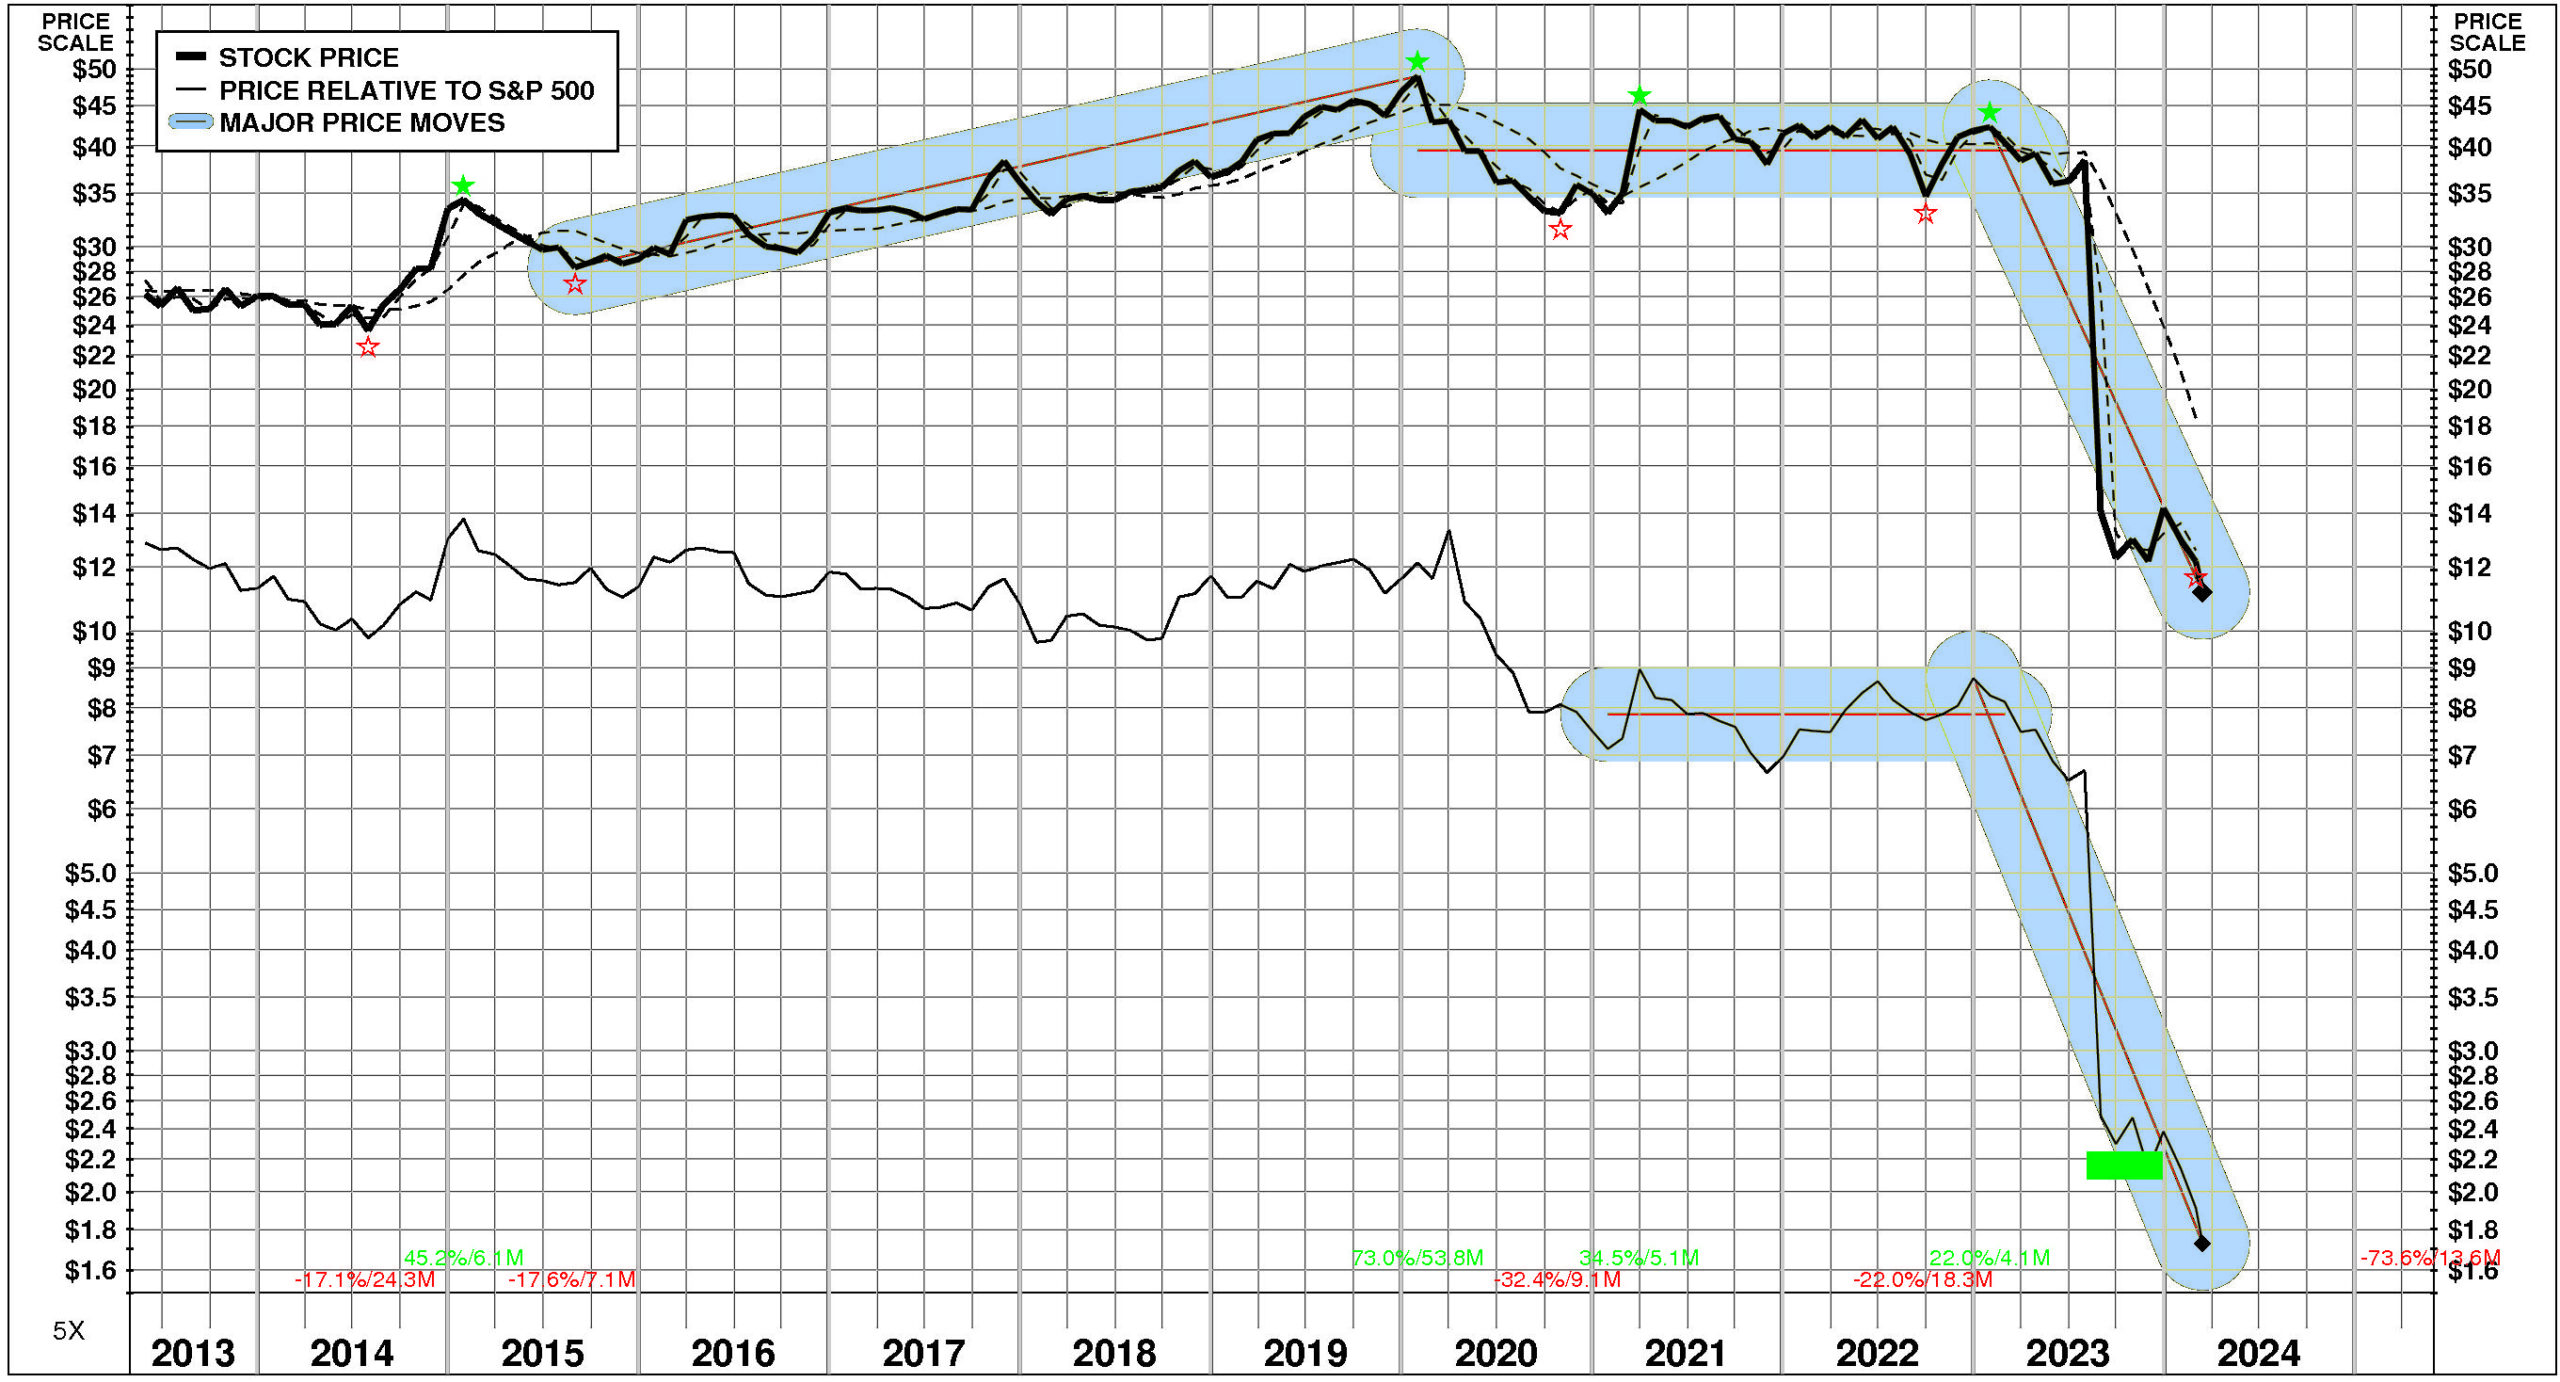
PRICE HISTORY
Over the full time period, Hawaiian Electric Industries’ stock price performance has been significantly below market. Between May, 2013 and March, 2024, Hawaiian Electric Industries’ stock price fell -57%; relative to the market, this was a -87% loss. Significant price moves during the period: 1) January, 2023 – March, 2024: -74%; and 2) August, 2015 – January, 2020: +73%.
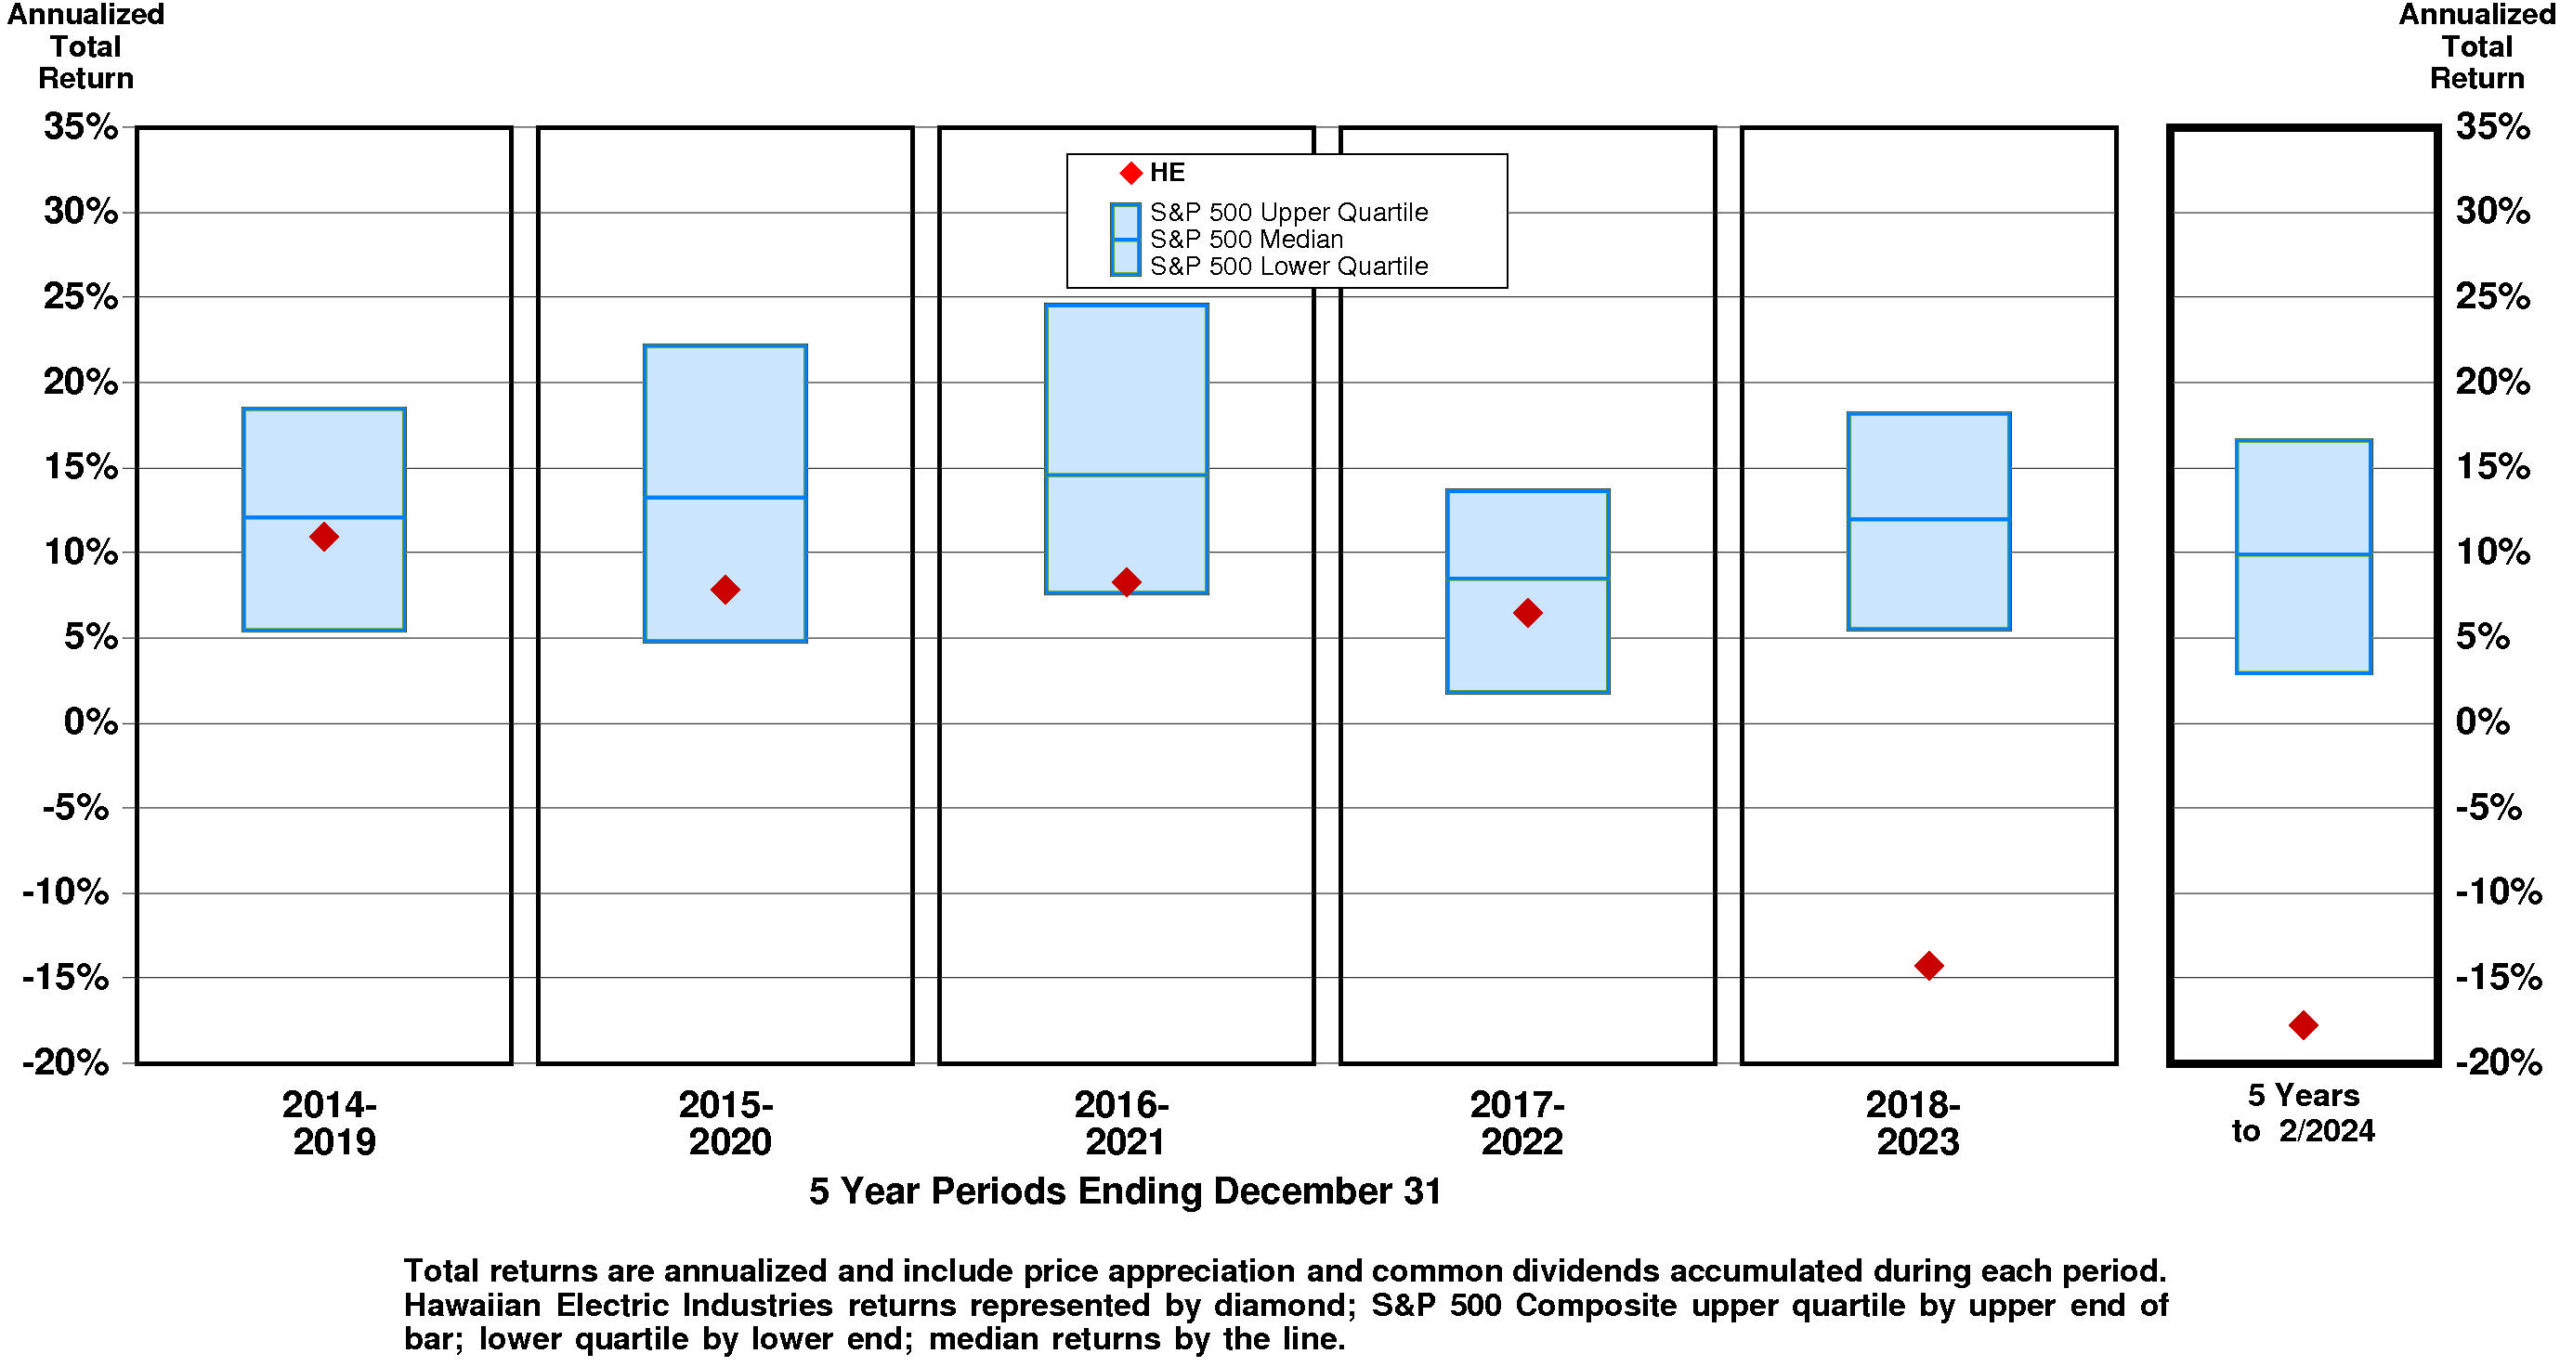
TOTAL INVESTMENT RETURNS
Current annual total return performance of -68.8% is lower quartile relative to the S&P 500 Composite.
In addition to being lower quartile relative to S&P 500 Composite, current annual total return performance through February, 2024 of -68.8% is lower quartile relative to Hawaiian Electric Industries Inc Peer Group.
Current 5-year total return performance of -17.7% is lower quartile relative to the S&P 500 Composite.
Through February, 2024, with lower quartile current 5-year total return of -17.7% relative to S&P 500 Composite, Hawaiian Electric Industries’ total return performance is lower quartile relative to Hawaiian Electric Industries Inc Peer Group.
VALUATION BENCHMARKS
Relative to S&P 500 Composite, HE’s overall valuation is exceptionally low. All five factors are lower quartile. The highest factor is the ratio of enterprise value/earnings before interest and taxes, followed by the ratio of enterprise value/revenue, then by the price/earnings ratio, then by the ratio of enterprise value/assets. The lowest factor is the price/equity ratio.
Relative to Hawaiian Electric Industries Peer Group, HE’s overall valuation is exceptionally low. All five factors are lower quartile. The highest factor is the ratio of enterprise value/earnings before interest and taxes, followed by the ratio of enterprise value/revenue, then by the price/equity ratio, then by the ratio of enterprise value/assets. The lowest factor is the price/earnings ratio.
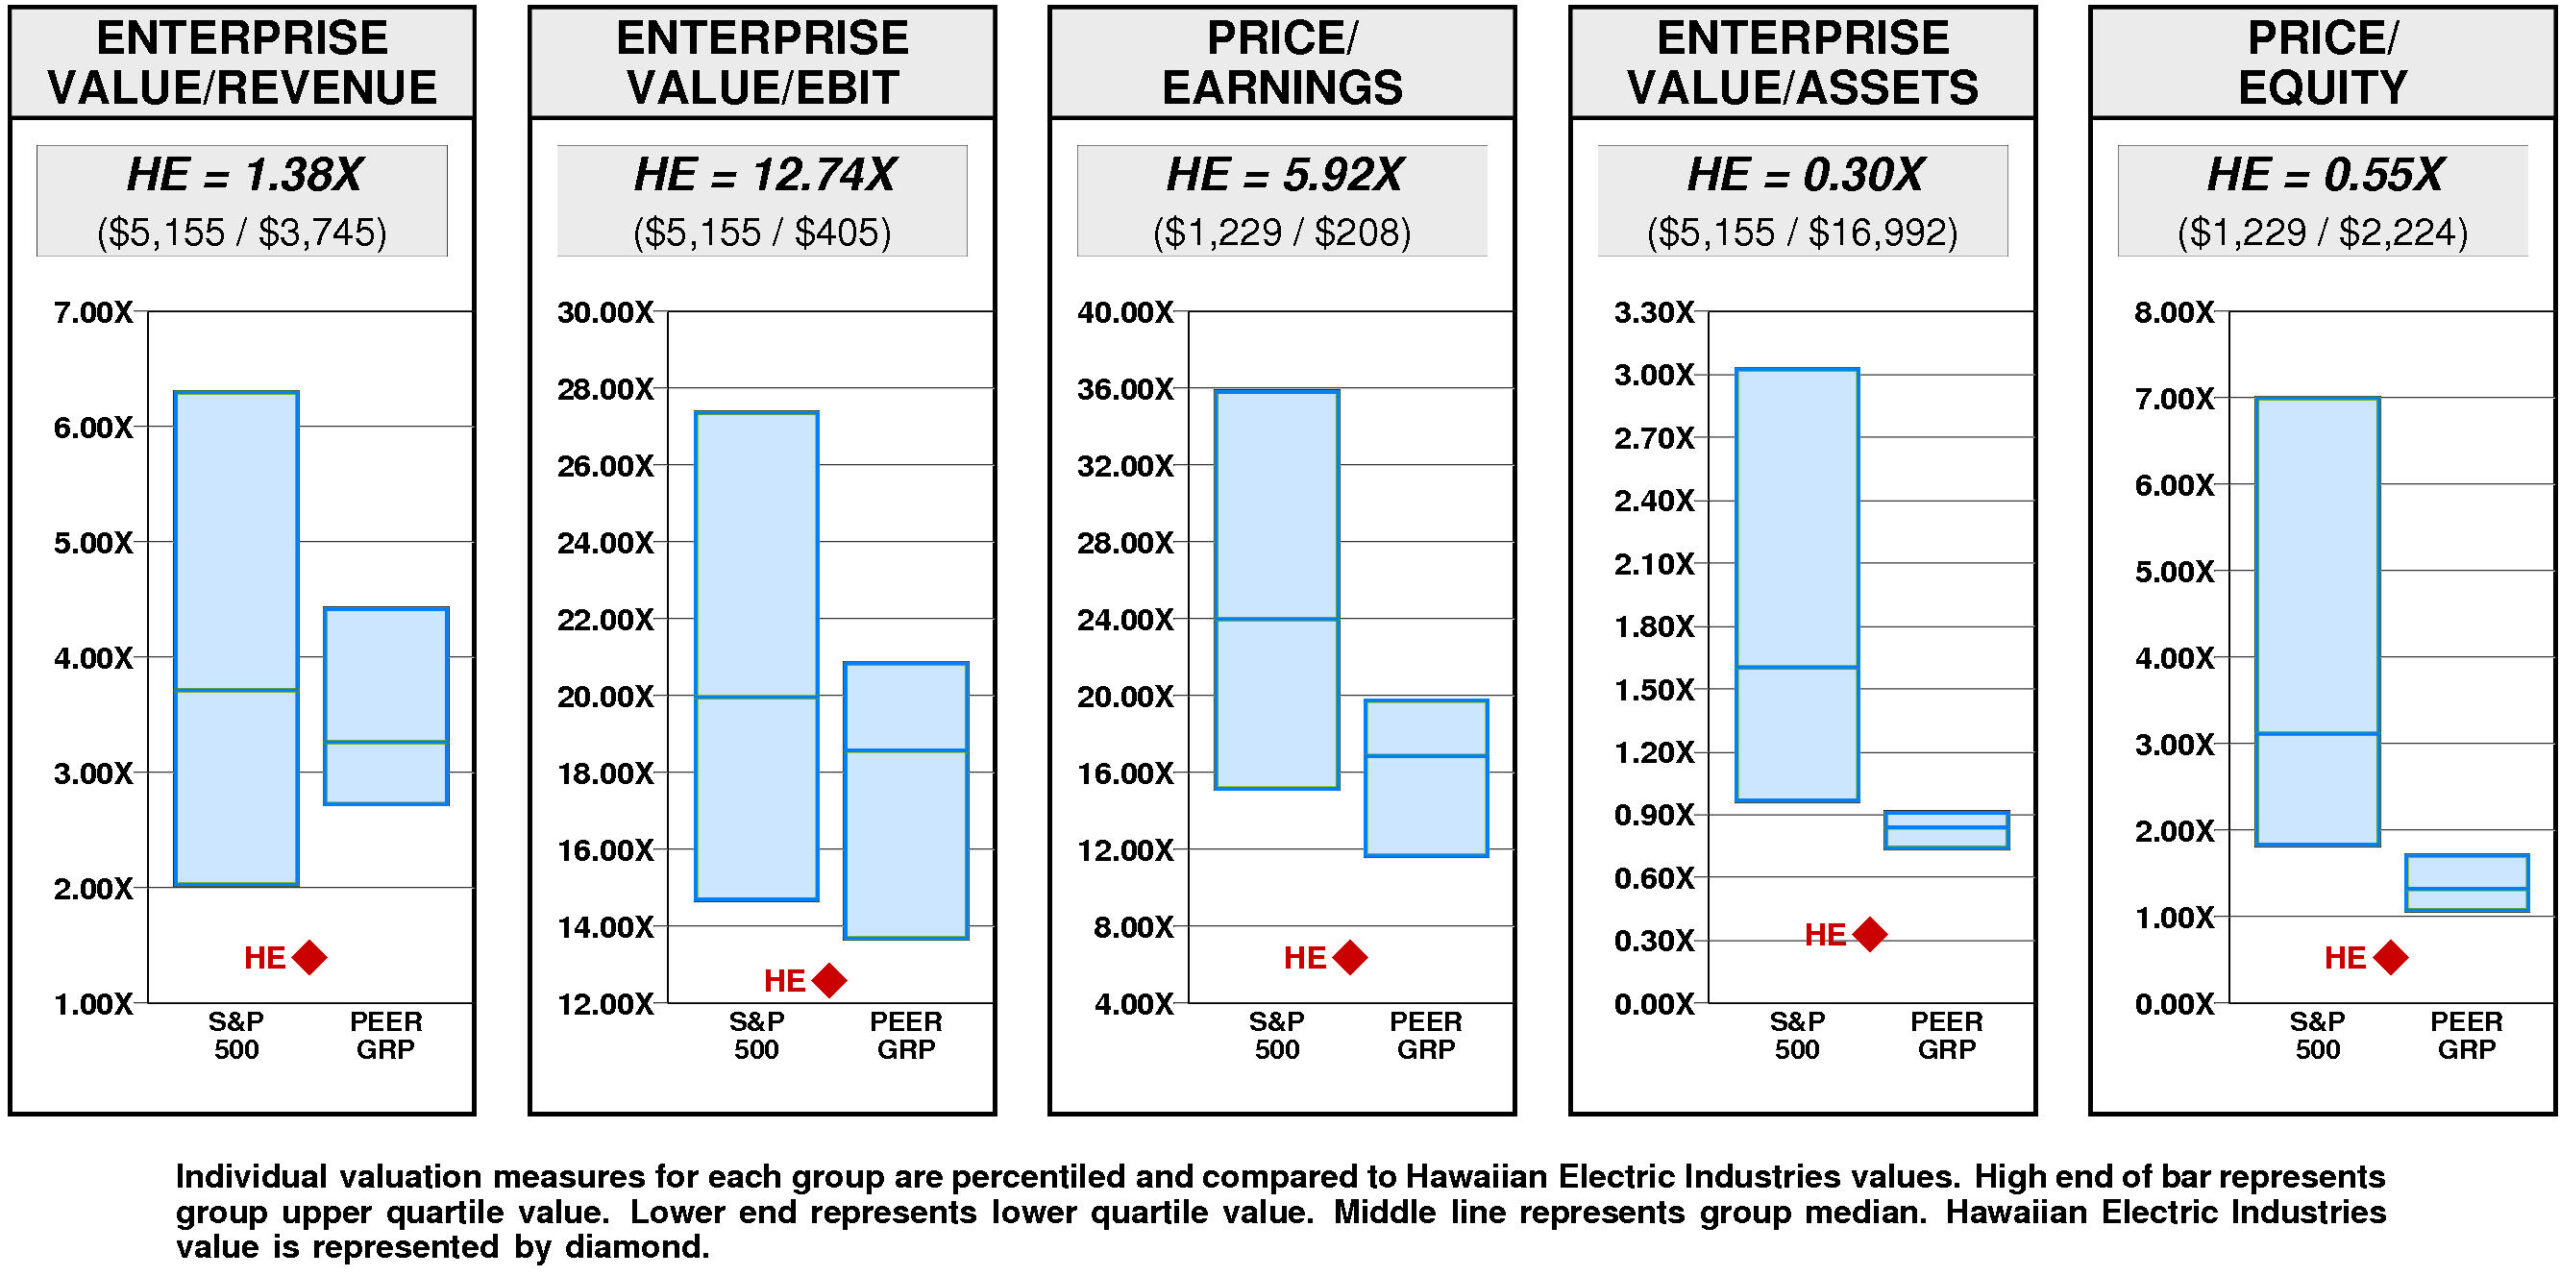
Hawaiian Electric Industries has a major value gap compared to the median. For HE to hit median valuation, its current ratio of enterprise value/revenue would have to rise from the current level of 1.38X to 3.27X. If HE’s ratio of enterprise value/revenue were to rise to 3.27X, its stock price would be higher by $64 to $75.
For HE to achieve upper quartile valuation relative to the Hawaiian Electric Industries Peer Group, its current ratio of enterprise value/revenue would have to rise from the current level of 1.38X to 4.42X. If HE’s ratio of enterprise value/revenue were to rise to 4.42X, its stock price would increase by $103 from the current level of $11.
VALUE TARGETS
With future capital returns forecasted to exceed the cost of capital, HE is expected to continue to be a Value Builder.
Hawaiian Electric Industries’ current Price Target of $51 represents a +358% change from the current price of $11.16.
This very high appreciation potential results in an appreciation score of 93 (only 7% of the universe has greater appreciation potential.)
Notwithstanding this high Appreciation Score of 93, the low Power Rating of 11 results in an Value Trend Rating of C.
Hawaiian Electric Industries’ current Price Target is $51 (-7% from the 2022 Target of $55 but +358% from the 03/13/24 price of $11.16). This slight fall in the Target is the result of a +3% increase in the equity base and a -10% decrease in the price/equity multiple. The forecasted increase in cost of equity has a large negative impact on the price/equity multiple and the forecasted decline in growth has a large negative impact as well. Partially offsetting these Drivers, the forecasted increase in return on equity has a very large positive impact.
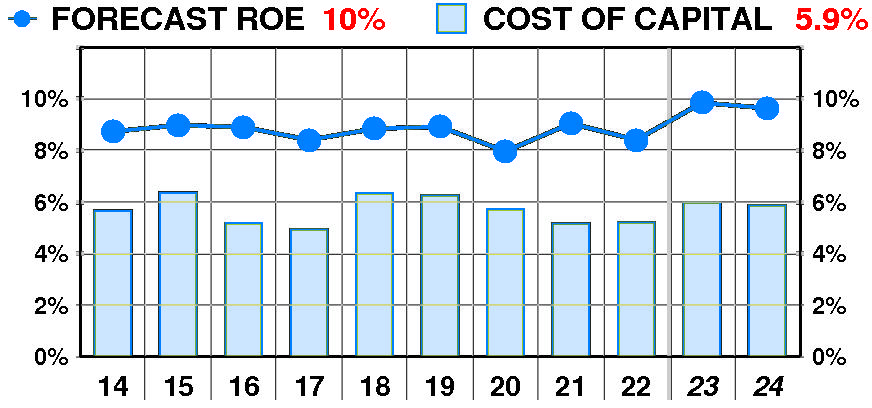
PTR’s return on equity forecast is 9.6% — in line with our recent forecasts. Forecasted return on equity erratic but little changed between 2014 and 2022. The current forecast is steady at the 2014 peak of 9%.
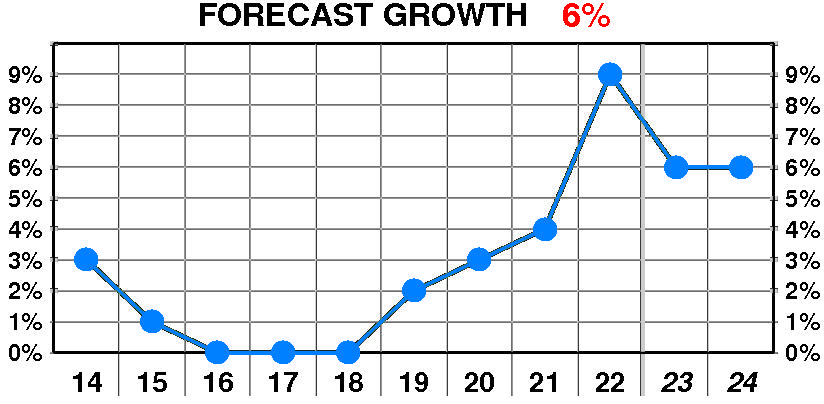
PTR’s growth forecast is 6.0% — above our recent forecasts. Forecasted growth enjoyed a dramatic, erratic increase between 2014 and 2022. The current forecast is well above the 2018 low of 0%.
PTR’s cost of equity forecast is 5.9% — in line with recent levels. Forecasted cost of equity exhibited a slight, erratic decline between 2014 and 2022. The current forecast is steady at the 2017 low of 4.9%.
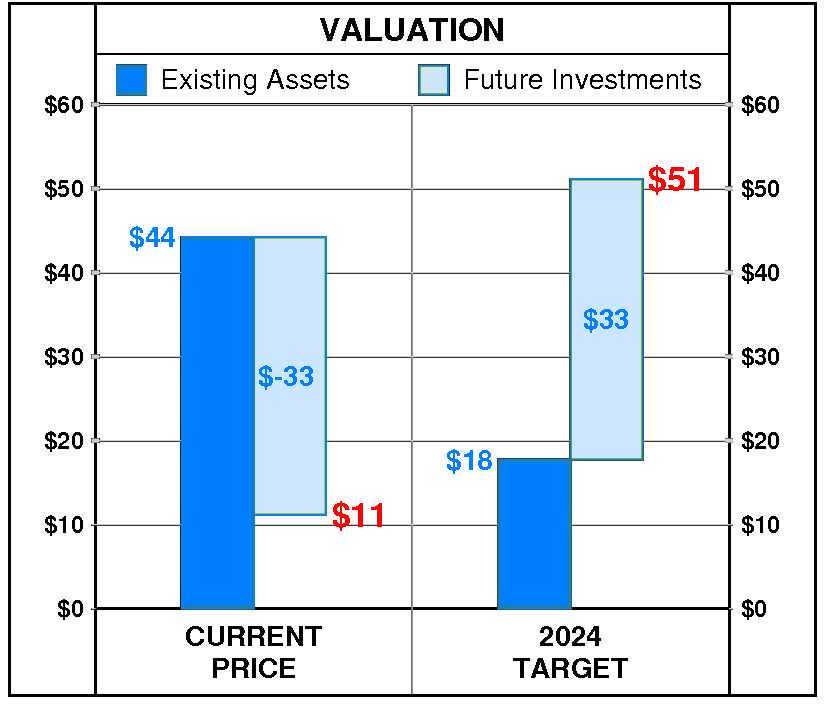
At Hawaiian Electric Industries’ current price of $11.16, investors are placing a negative value of $-33 on its future investments. This view is not supported by the company’s most recent performance that reflected a growth rate of 9.0% per year, and a return on equity of 8.4% versus a cost of equity of 5.2%.
PTR’s 2024 Price Target of $51 is based on these forecasts and reflects an estimated value of existing assets of $18 and a value of future investments of $33.
Be the first to comment