![]()
BUSINESS
Healthcare Services Group, Inc. provides management, administrative, and operating services to the housekeeping, laundry, linen, facility maintenance, and dietary service departments of nursing homes, retirement complexes, rehabilitation centers, and hospitals in the United States. It operates through two segments, Housekeeping and Dietary. The Housekeeping segment engages in the cleaning, disinfecting, and sanitizing of resident rooms and common areas of the client’s facility, as well as laundering and processing of the bed linens, uniforms, resident personal clothing, and other assorted linen items utilized at a client’s facility. The Dietary segment provides food purchasing, meal preparation, and professional dietitian services, which include the development of menus that meet the dietary needs of residents.
INVESTMENT RATING
HCSG’s future returns on capital are forecasted to exceed the cost of capital. Accordingly, the company is expected to continue to be an important Value Builder.
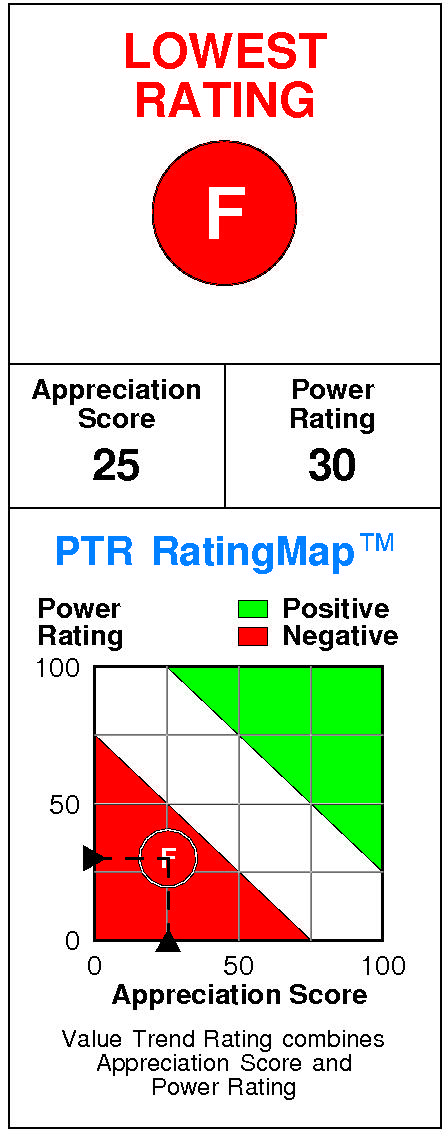
Healthcare Services Group has a current Value Trend Rating of F (Lowest Rating).
With this rating, PTR’s two proprietary measures of a stock’s current attractiveness are providing highly consistent signals. Healthcare Services Group has a poor Power Rating of 30 and a poor Appreciation Score of 25, with the Lowest Value Trend Rating the result.
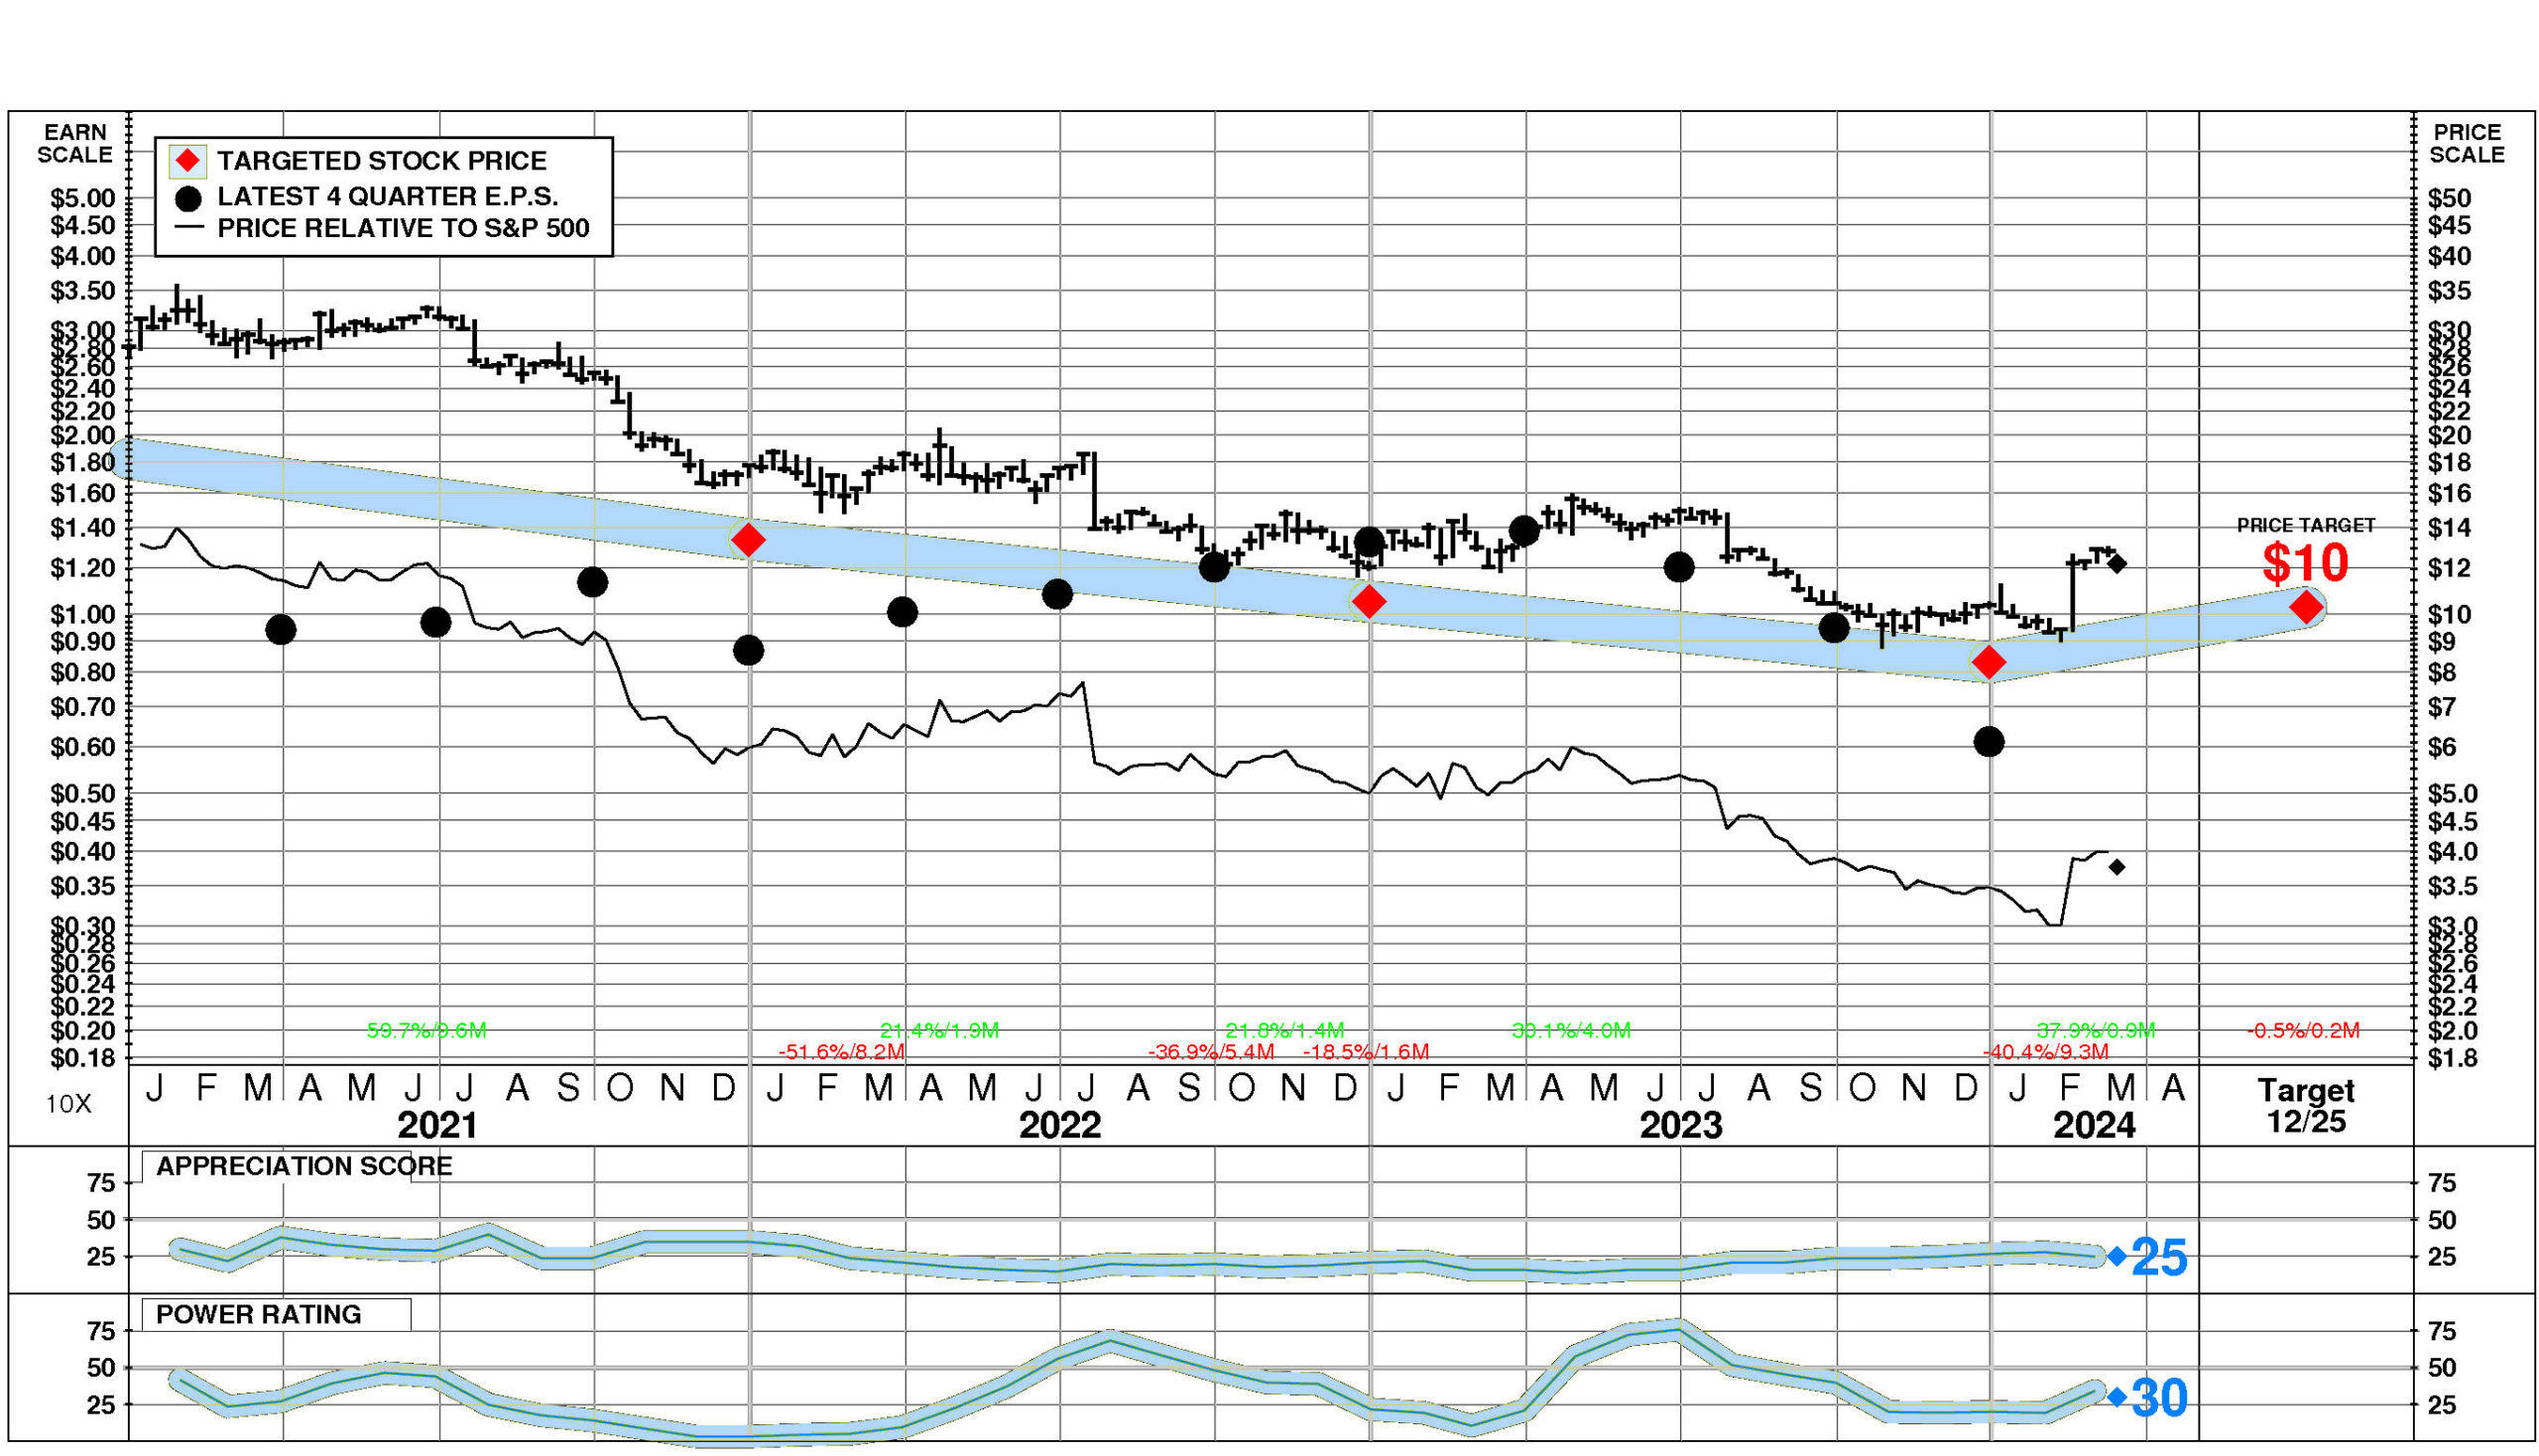
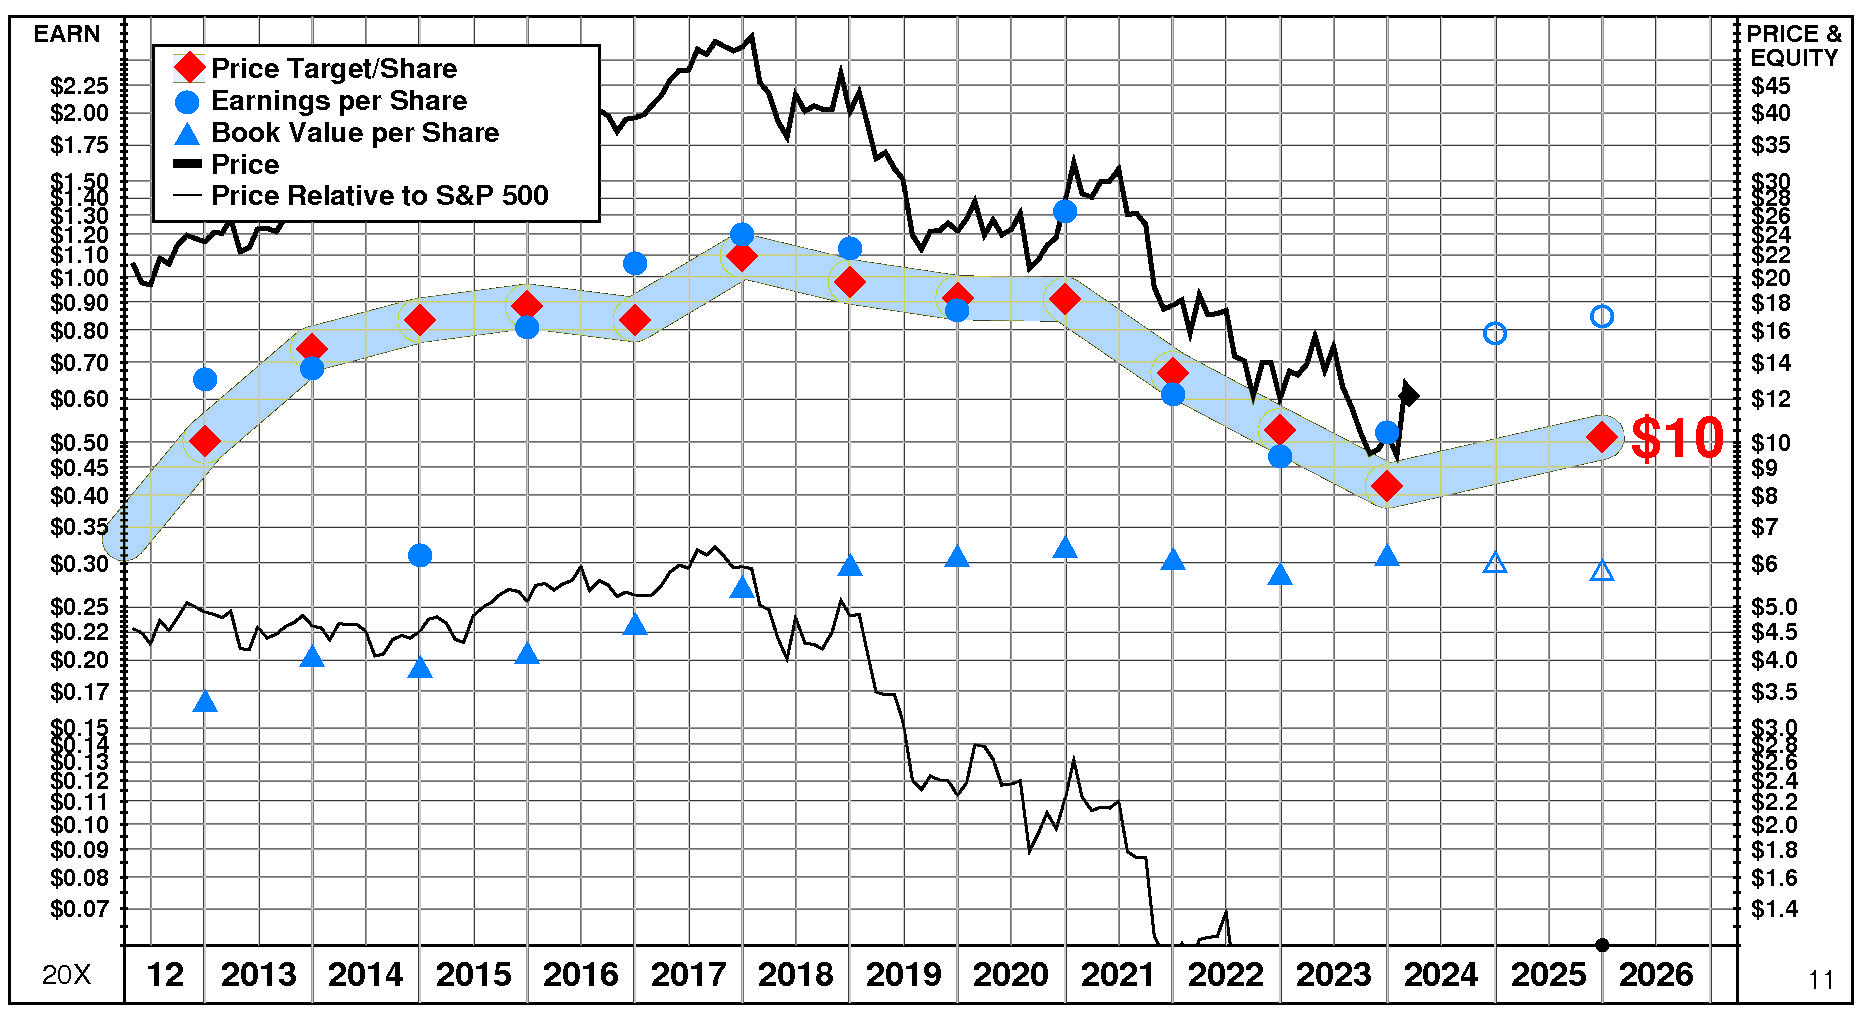
Healthcare Services Group’s stock is selling above targeted value. The current stock price of $12.16 compares to targeted value 12 months forward of $10.
Healthcare Services Group’s low appreciation potential results in an appreciation score of 25 (75% of the universe has greater appreciation potential.)
Healthcare Services Group has a Power Rating of 30. (HCSG’s poor Power Rating indicates that it only has a higher likelihood of achieving favorable investment performance over the near to intermediate term than 30% of companies in the universe.)
Factors contributing to this poor Power Rating include: the Services to Dwellings, Other Buildings comparison group is in an extremely unfavorable position currently; and recent price action has been unfavorable. An offsetting factor is the recent trend in HCSG’s earnings estimates has been favorable.
INVESTMENT PROFILE
HCSG’s financial strength is high. Financial strength rating is 90.
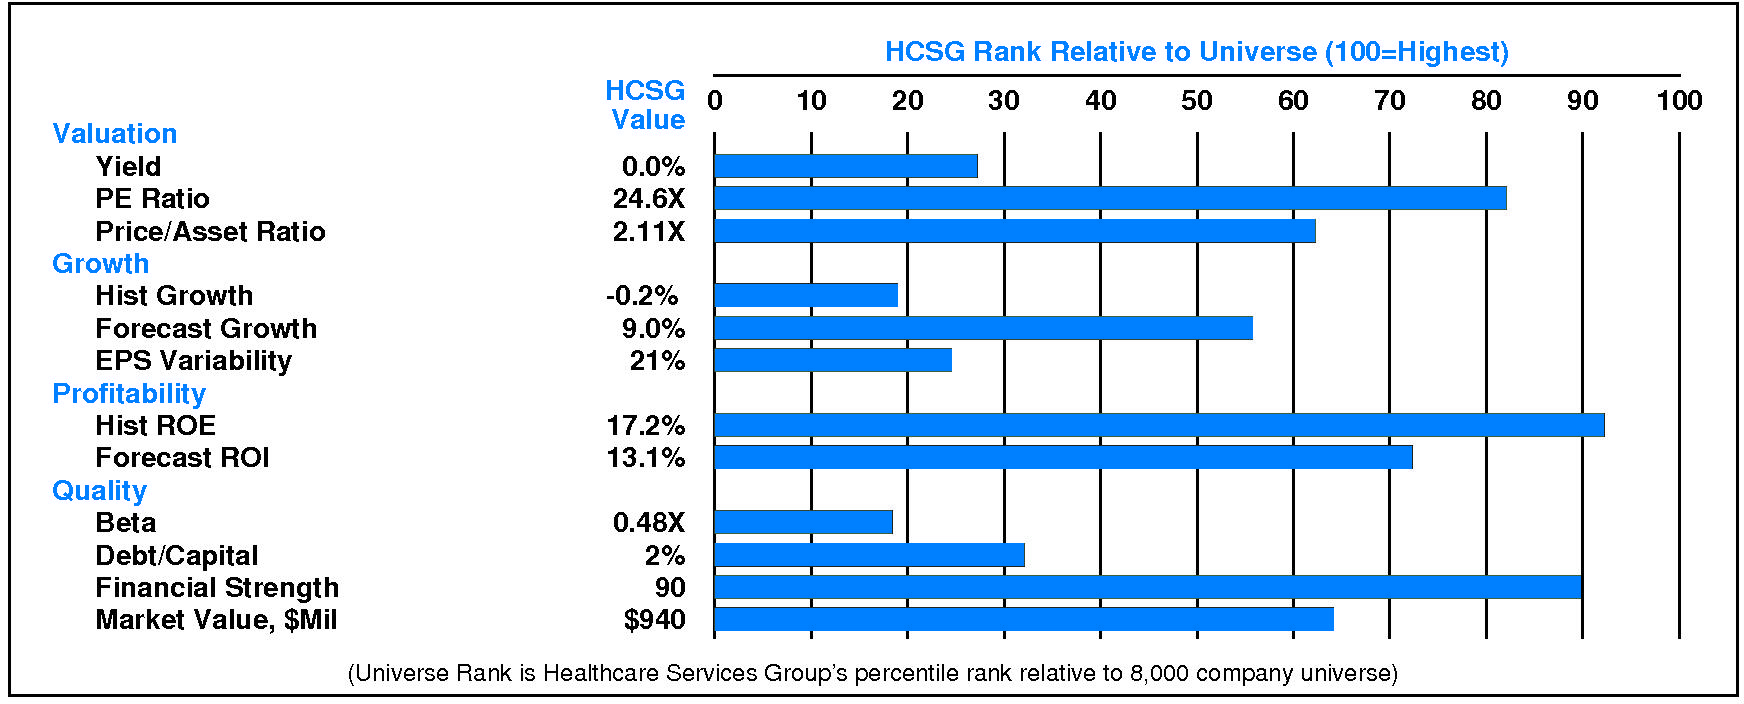
Relative to the S&P 500 Composite, Healthcare Services Group Inc has moderate Value characteristics; its appeal is likely to be to Capital Gain-oriented investors; the perception is that HCSG is extremely low risk. Low historical growth is a relative weakness for HCSG. HCSG’s valuation is moderate: low dividend yield, moderate P/E ratio, and low price/book ratio. HCSG has unusually low market capitalization.
CURRENT SIGNALS
Healthcare Services Group’s current operations are eroding. Return on equity is falling, reflecting: declining pretax margin; falling tax keep rate; and falling leverage.
Healthcare Services Group’s current technical position is mixed. The stock price is in a 0.9 month up move. The stock has appreciated 37.9% from its prior low. The 200 day moving average is in a downtrend. The stock price is above its 200 day moving average.
ALERTS
Healthcare Services Group Inc (NASDAQ: HCSG) suffers from minimal negative changes in fundamentals: significant quarterly earnings deceleration occurred.
The stock is currently rated F.
On 3/13/24, Healthcare Services Group Inc (NASDAQ: HCSG) stock declined modestly by -1.1%, closing at $12.16. However, this decline was accompanied by below average trading volume at 67% of normal. Relative to the market the stock has been weak over the last nine months and has declined -4.0% during the last week.
CASH FLOW
In 2023, Healthcare Services Group generated a significant increase in cash of +$25.98 million (+21%). Sources of cash were larger than uses. Cash generated from 2023 EBITDA totaled +$77.70 million. Non-operating uses consumed -$8.84 million (-11% of EBITDA). Cash taxes consumed -$14.67 million (-19% of EBITDA). Re-investment in the business amounted to -$17.64 million (-23% of EBITDA). On a net basis, debt investors pulled out -$2.62 million (-3% of EBITDA) while equity investors removed -$7.94 million (-10% of EBITDA).
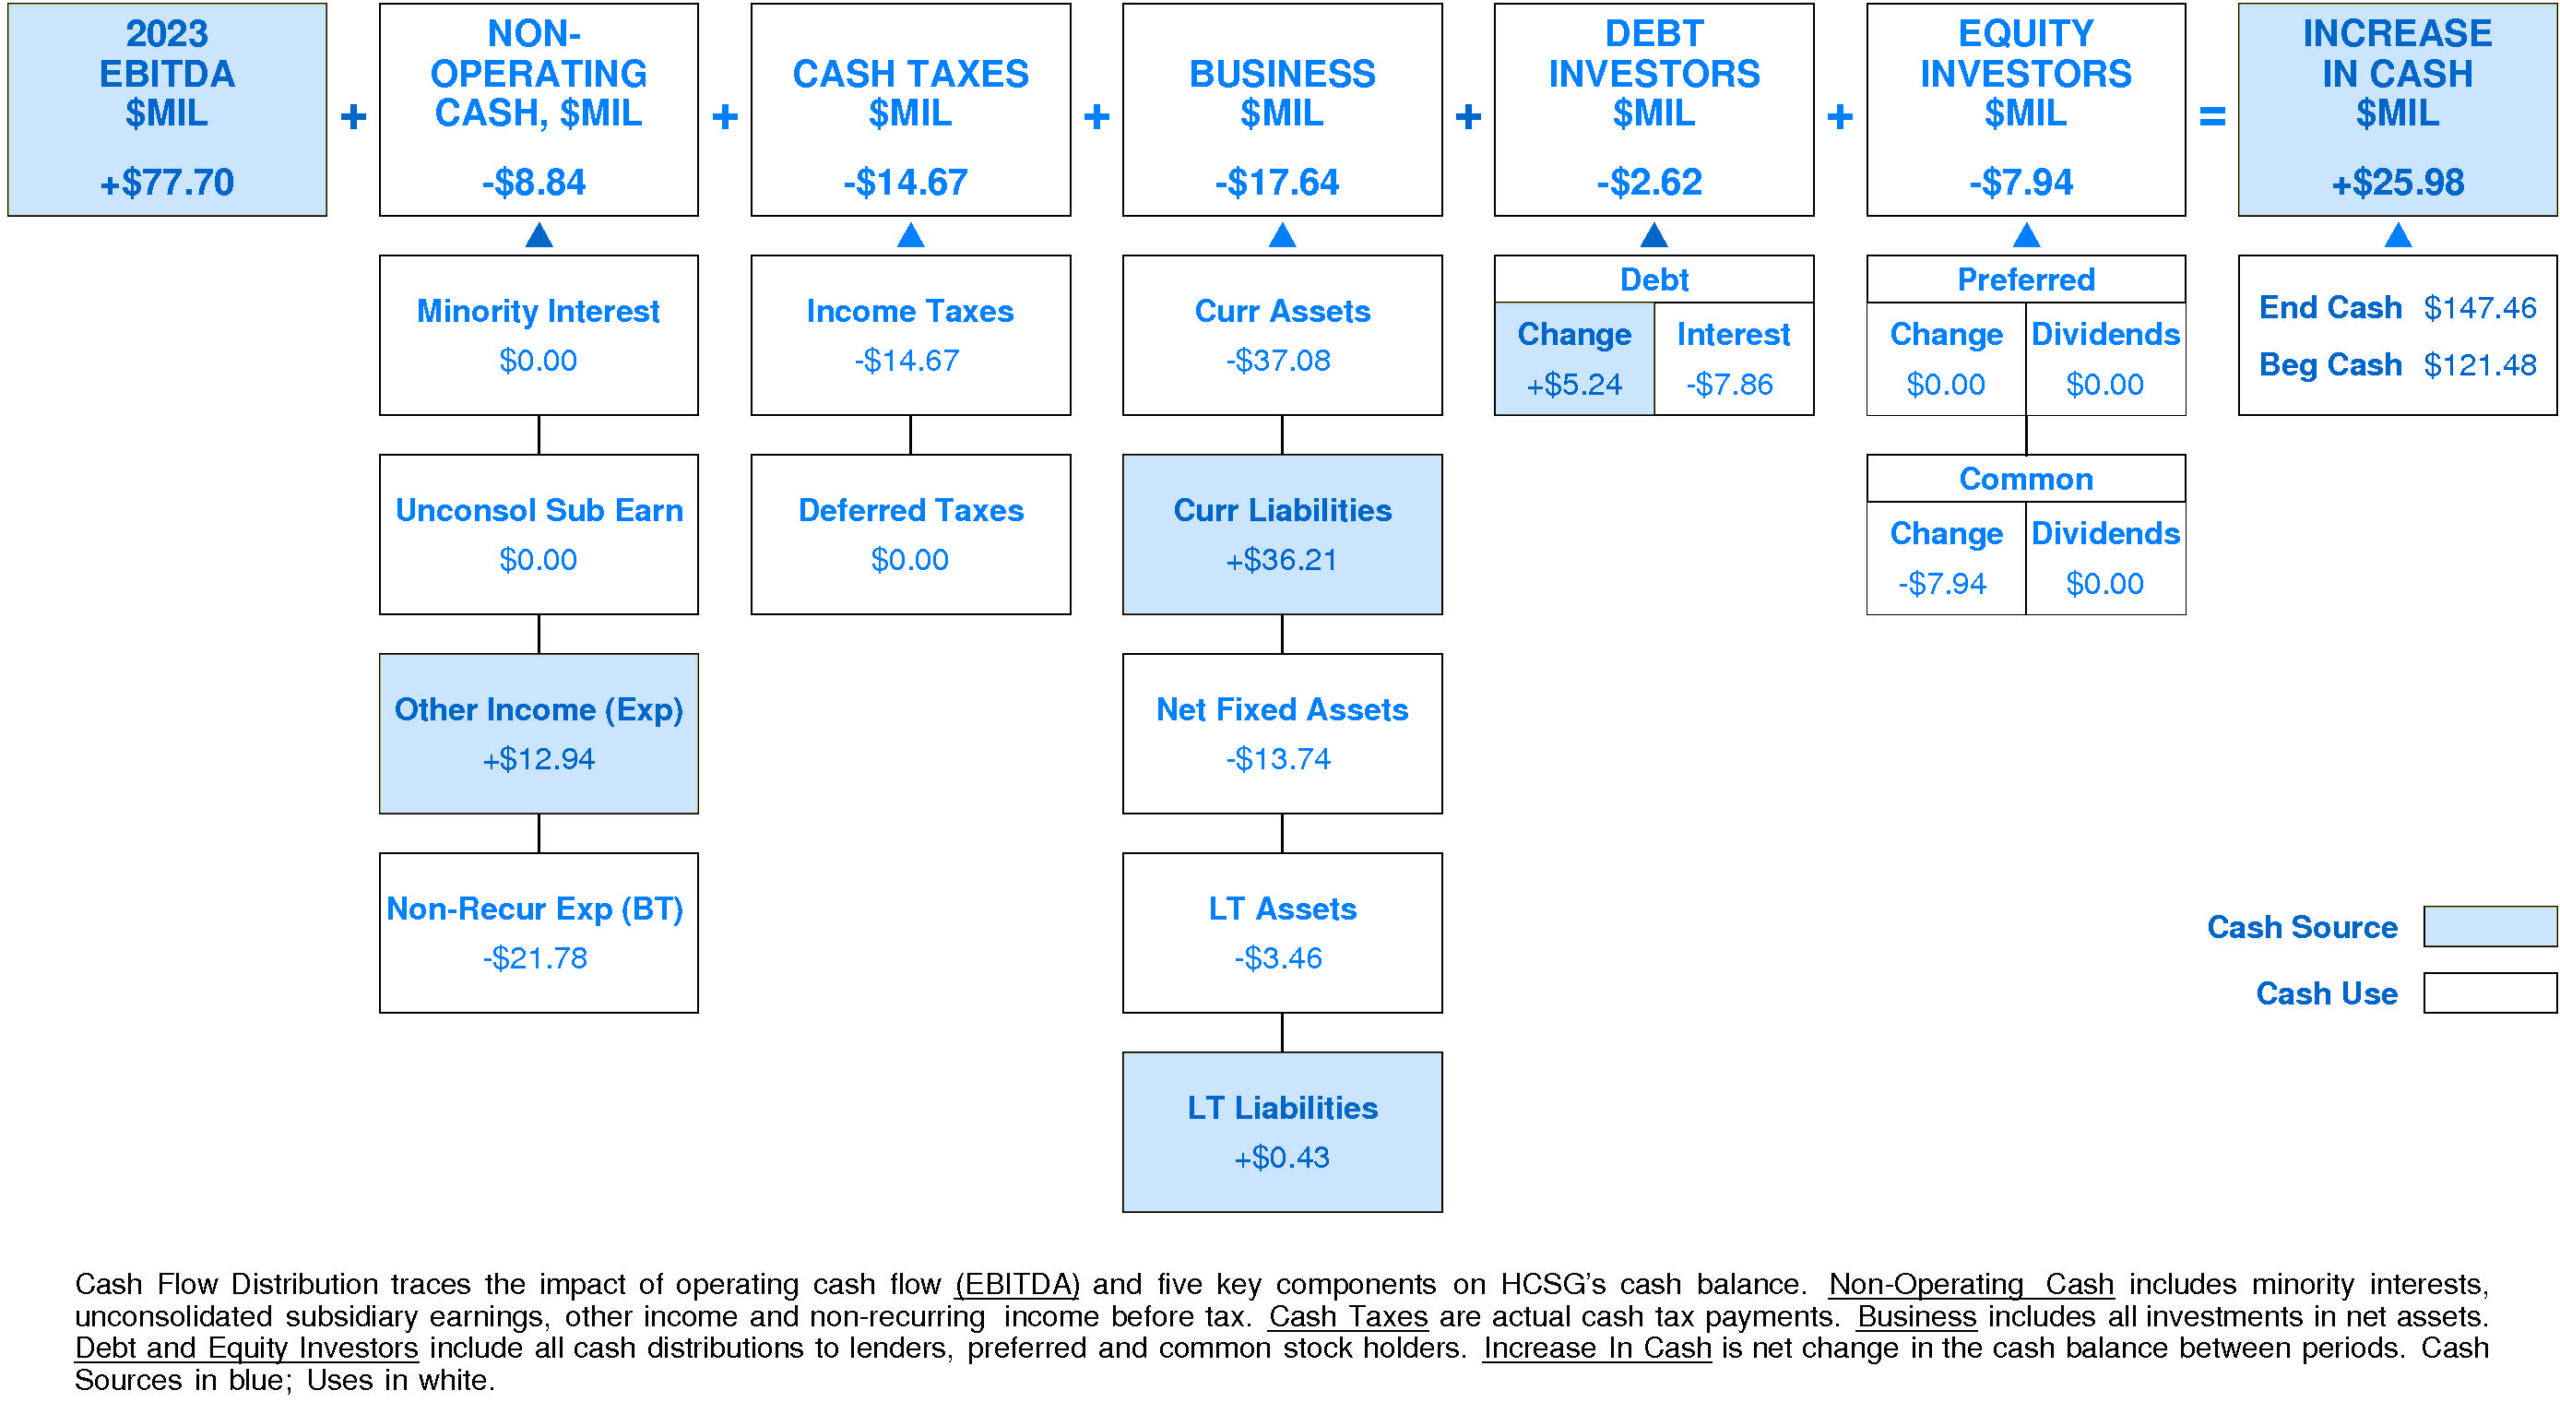
HCSG’s Non-operating Income, %EBITDA has experienced a downtrend over the period. This downtrend was accompanied by stability for the Healthcare Services Group Peer Group. In most years, Healthcare Services Group was in the top quartile. Currently, Healthcare Services Group is substantially below median at -11% of EBITDA (-$8.84 million).
HCSG’s Cash Taxes, %EBITDA has exhibited a minor overall uptrend over the period. This improvement was accompanied by a similar trend for the Healthcare Services Group Peer Group. In most years, Healthcare Services Group was in the lower quartile and third quartile. Currently, Healthcare Services Group is at the lower quartile at -19% of EBITDA (-$14.67 million).
HCSG’s Business Re-investment, %EBITDA has suffered a volatile overall downtrend over the period. This downtrend was accompanied by a similar trend for the Healthcare Services Group Peer Group. In most years, Healthcare Services Group was in the top quartile and lower quartile. Currently, Healthcare Services Group is slightly above median at -23% of EBITDA (-$17.64 million).
HCSG’s Debt Investors, %EBITDA has exhibited little to no overall change over the period. This stability was accompanied by an uptrend for the Healthcare Services Group Peer Group. In most years, Healthcare Services Group was in the third quartile and top quartile. Currently, Healthcare Services Group is below median at -3% of EBITDA (-$2.62 million).
HCSG’s Equity Investors, %EBITDA has experienced a downtrend over the period. This downtrend was accompanied by stability for the Healthcare Services Group Peer Group. (Since 2021 Equity Investors, %EBITDA has experienced a very sharp recovery.) In most years, Healthcare Services Group was in the third quartile and lower quartile. Currently, Healthcare Services Group is upper quartile at -10% of EBITDA (-$7.94 million).
HCSG’s Change in Cash, %EBITDA has experienced a volatile overall downtrend over the period. This downtrend was accompanied by stability for the Healthcare Services Group Peer Group. (Since 2021 Change in Cash, %EBITDA has experienced a very sharp recovery.) In most years, Healthcare Services Group was in the top quartile and lower quartile. Currently, Healthcare Services Group is upper quartile at +33% of EBITDA (+$25.98 million).
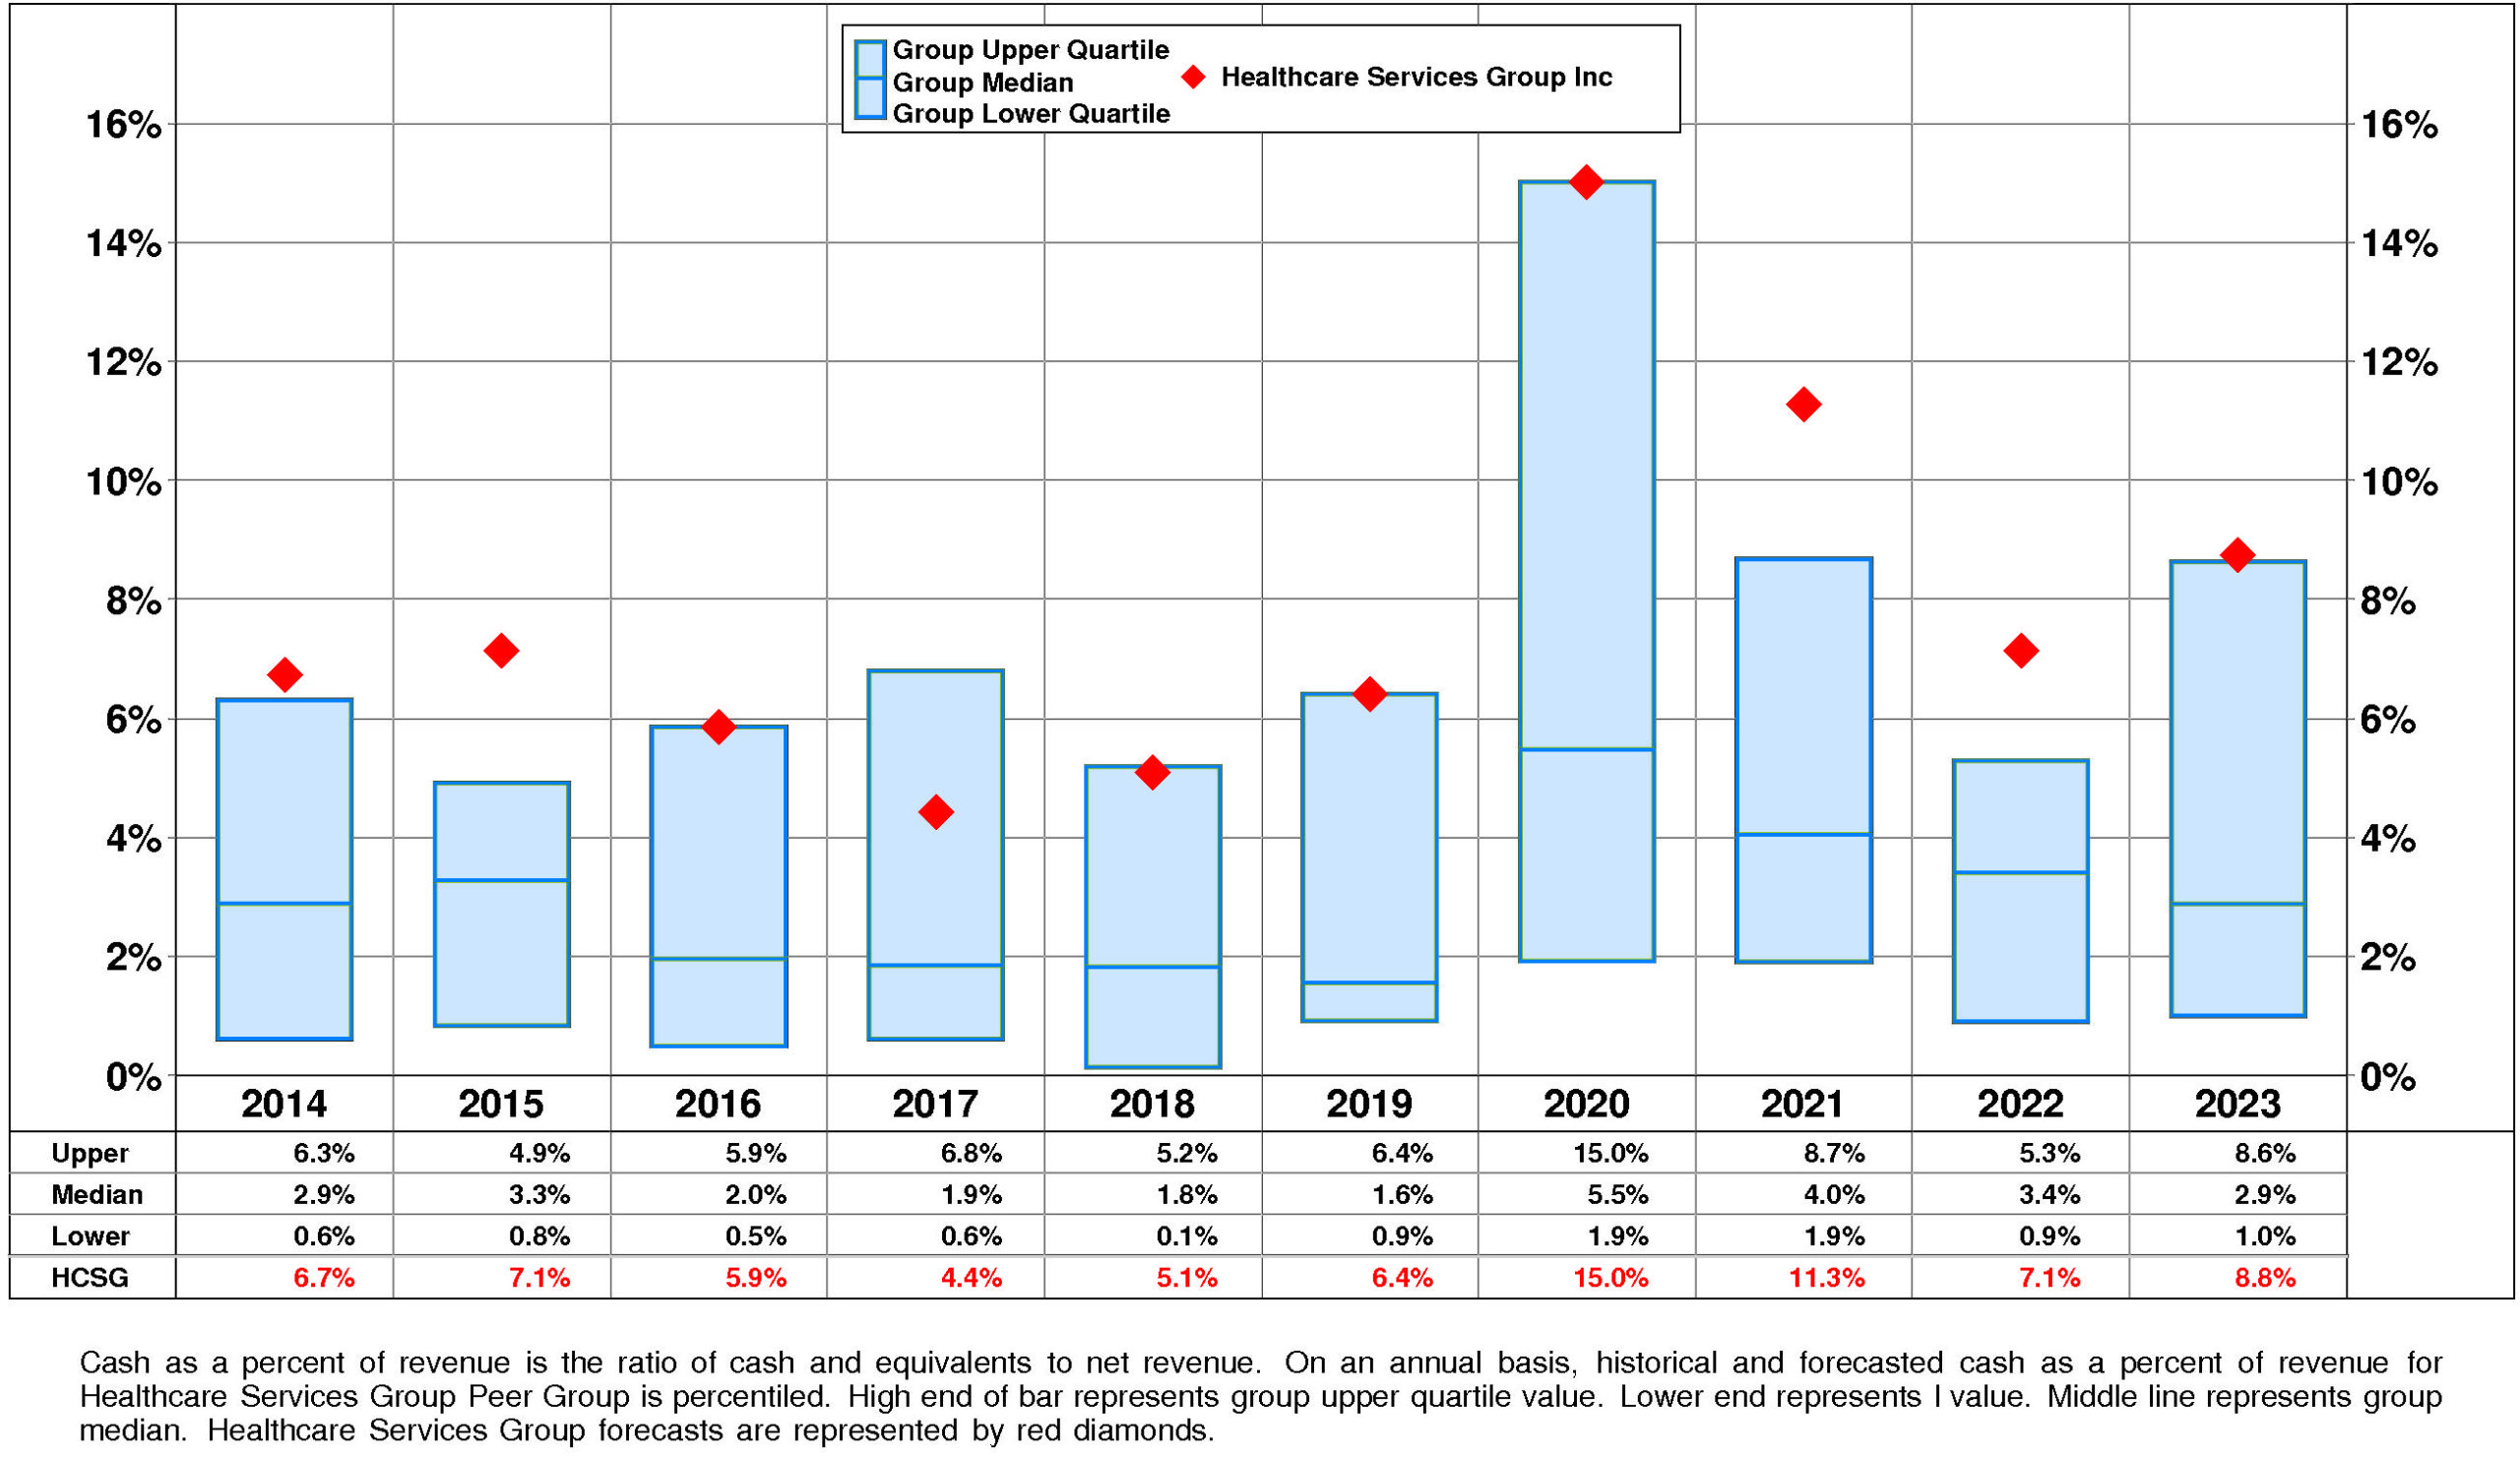
HCSG’s Cash, %Revenue has exhibited little to no overall change over the period. This stability was accompanied by stability for the Healthcare Services Group Peer Group as well. In most years, Healthcare Services Group was in the top quartile. Currently, Healthcare Services Group is at the upper quartile at +9%.
PROFITABILITY
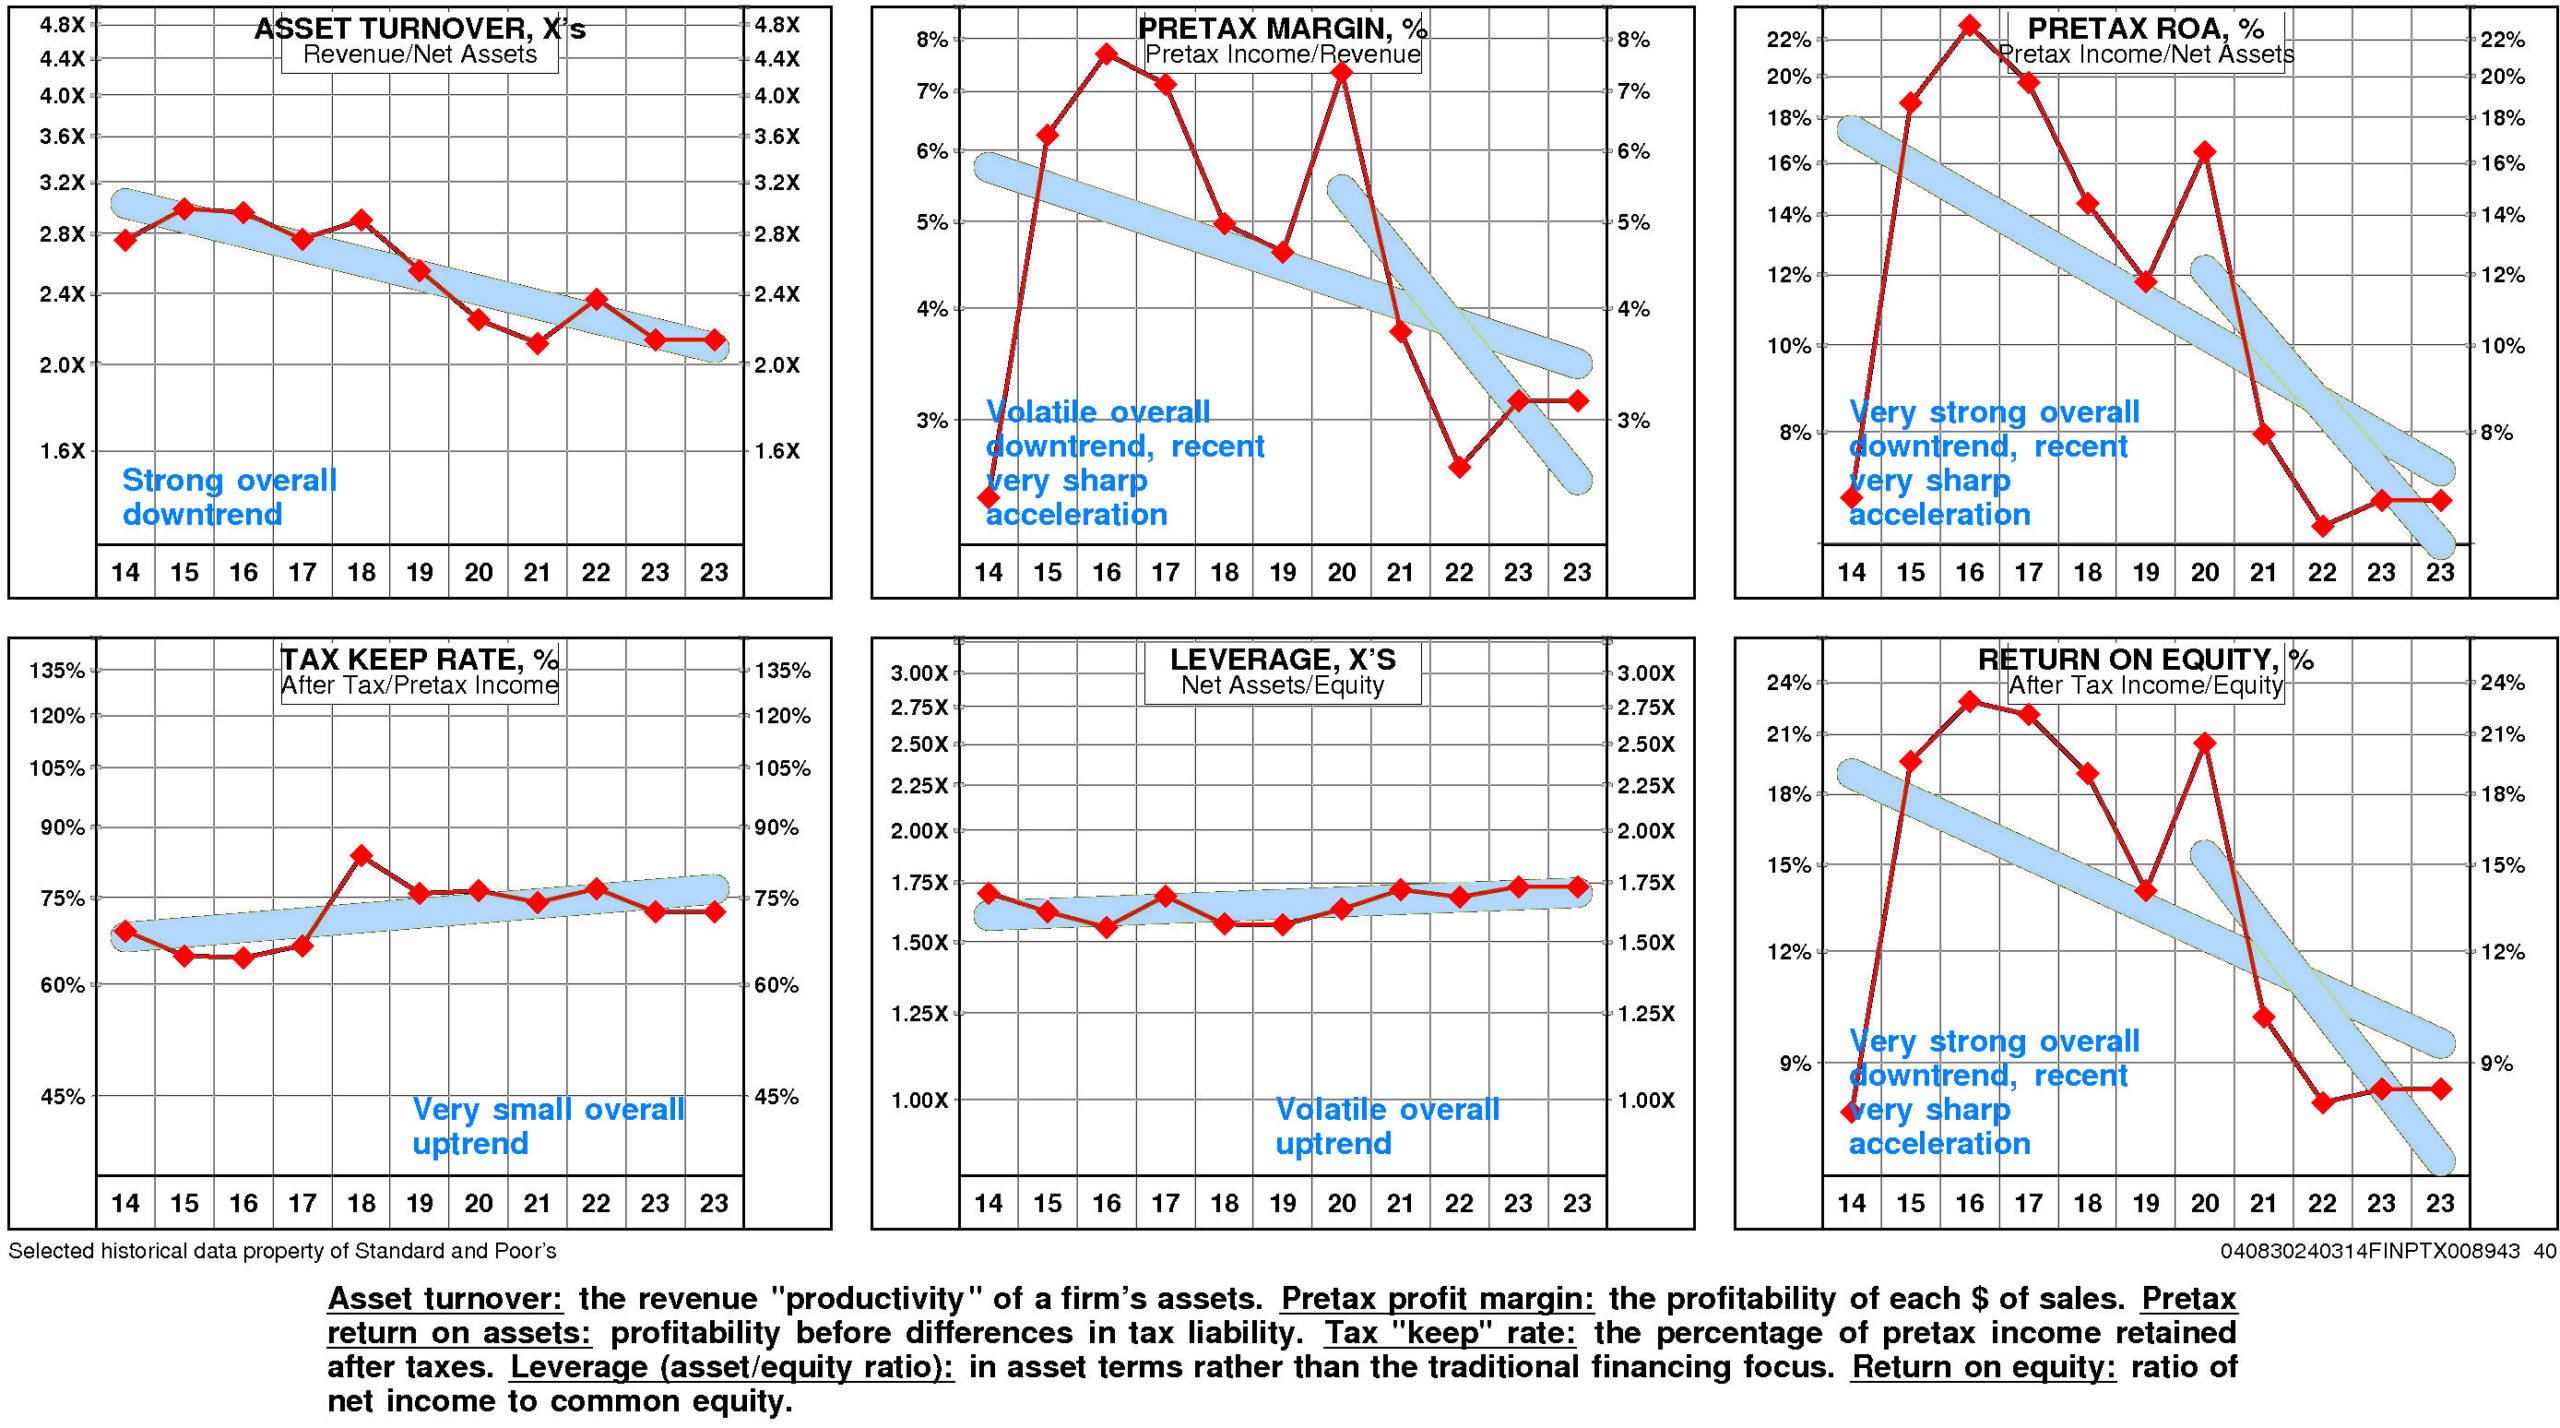
HCSG’s return on equity has eroded very significantly since 2014. The current level of 8.4% is 1.06X the low for the period and is -57.0% from the high.
This very significant erosion was due to very strong negative trend in pretax operating return and small positive trend in non-operating factors.
The productivity of HCSG’s assets declined over the full period 2014-2023: asset turnover has suffered a strong overall downtrend.
Reinforcing this trend, pretax margin experienced a strong overall downtrend that accelerated very sharply from the 2020 level.
Non-operating factors (income taxes and financial leverage) had a minor positive influence on return on equity.
HCSG’s return on equity is lower quartile (8.4%) for the four quarters ended December, 2023.
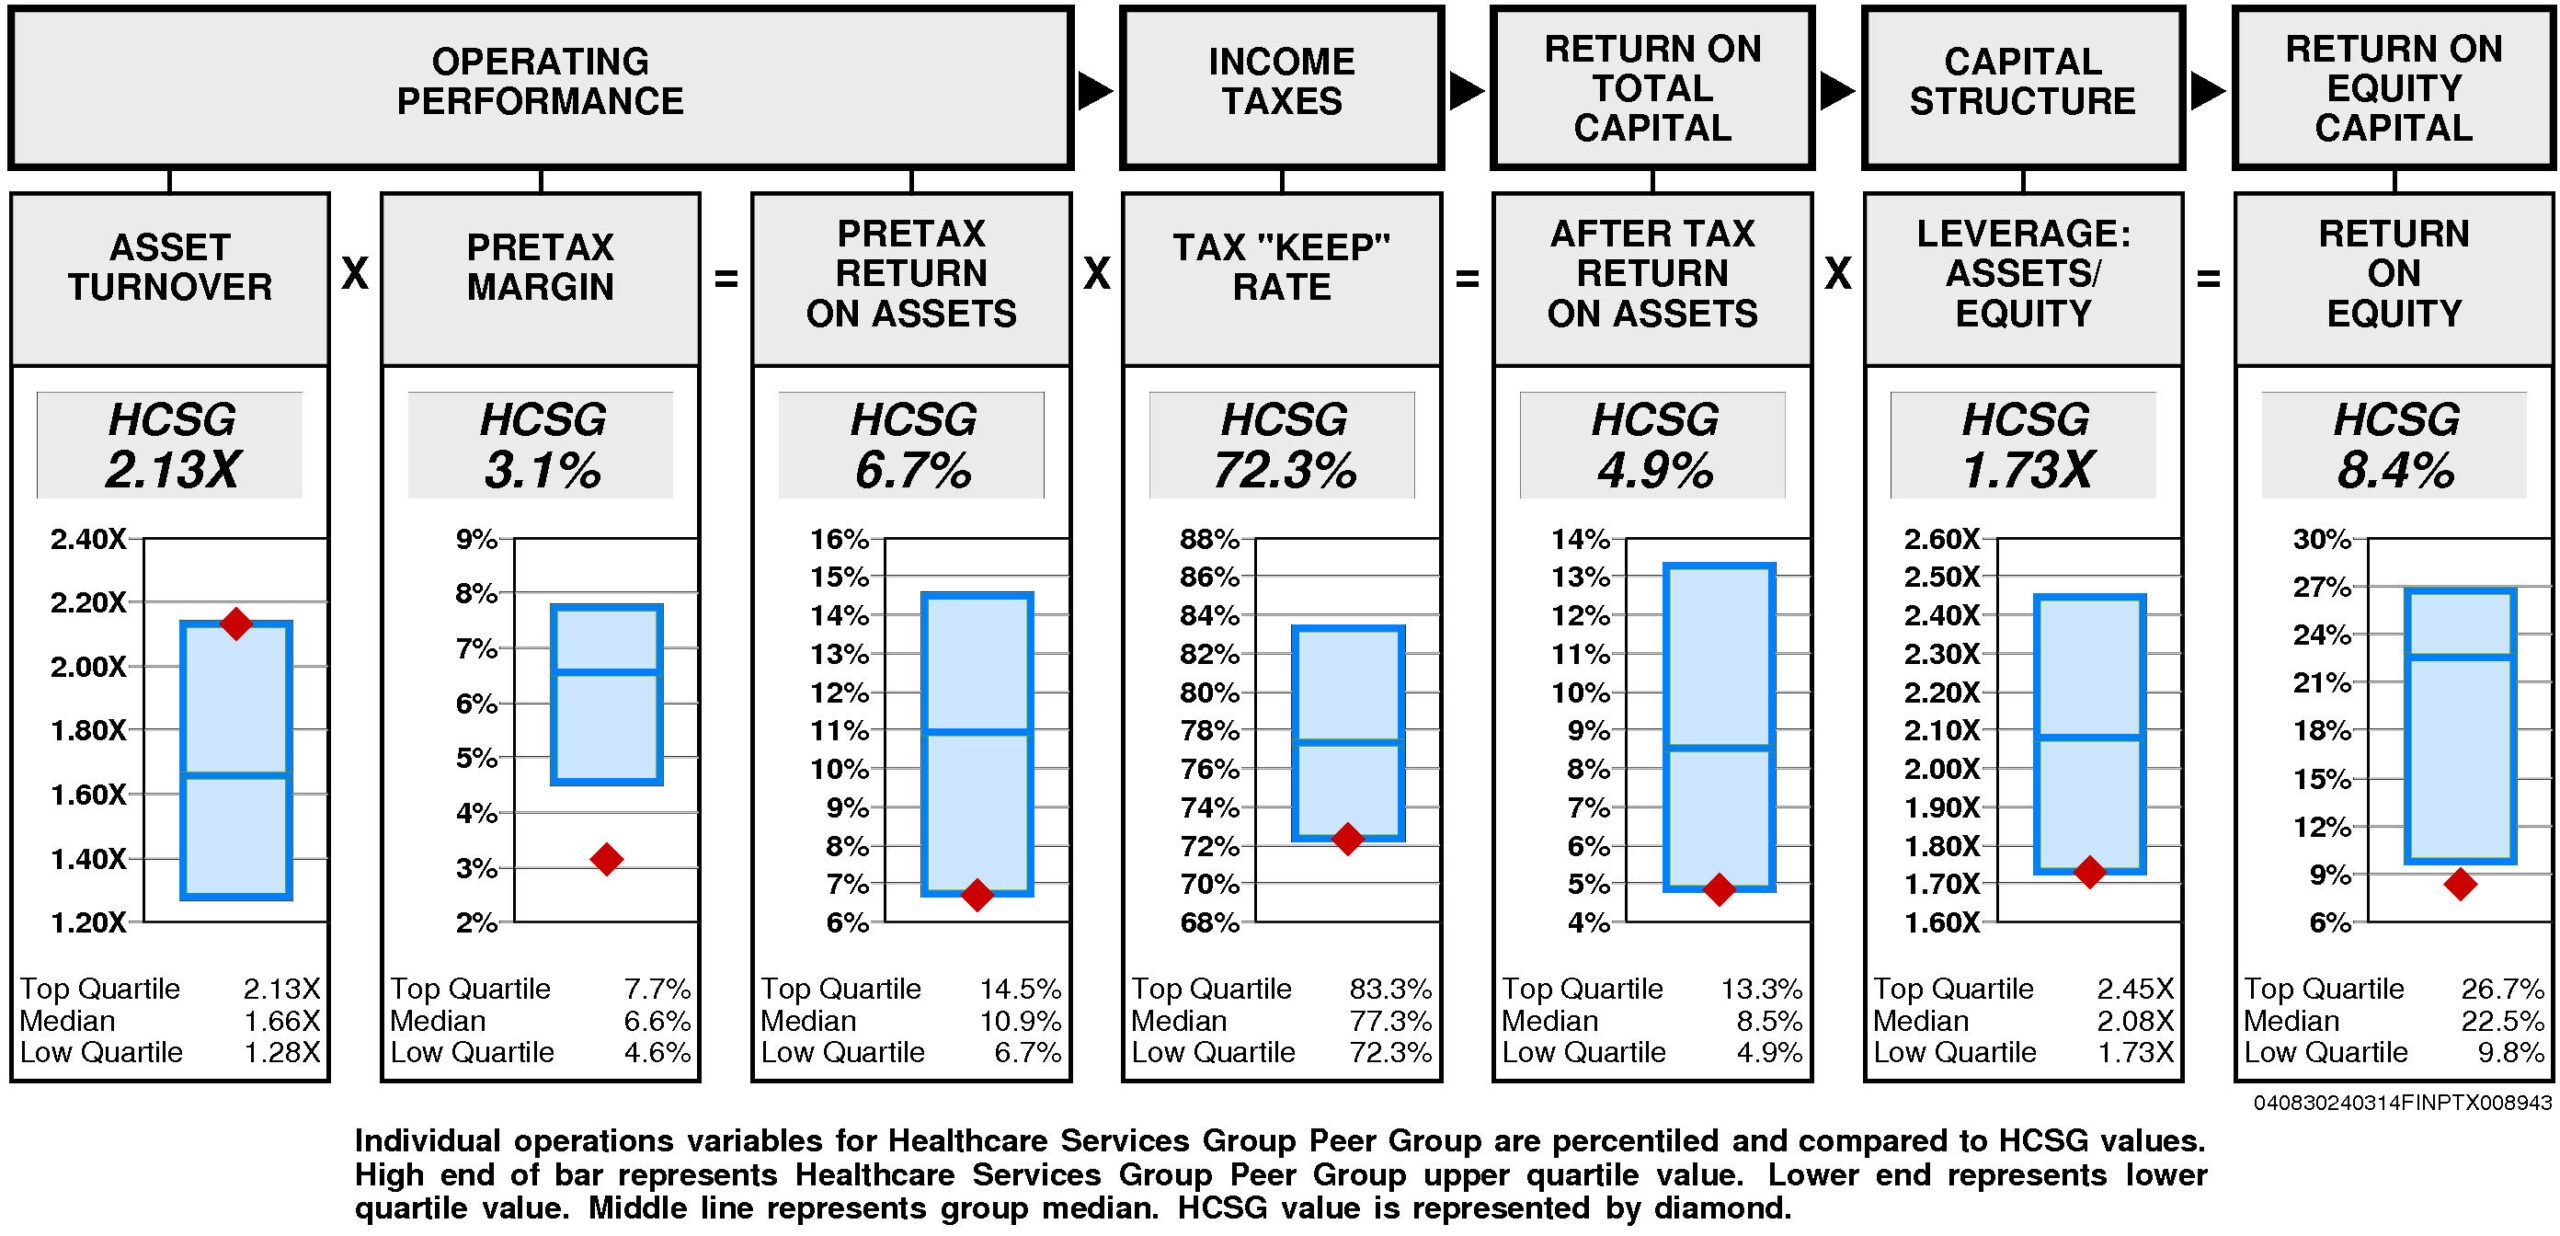
Operating performance (pretax return on assets) is at the lower quartile (6.7%) reflecting asset turnover that is at the upper quartile (2.13X) and lower quartile pretax margin (3.1%).
Tax “keep” rate (income tax management) is at the lower quartile (72.3%) resulting in after tax return on assets that is at the lower quartile.
Financial leverage (leverage) is at the lower quartile (1.73X).
GROWTH RATES
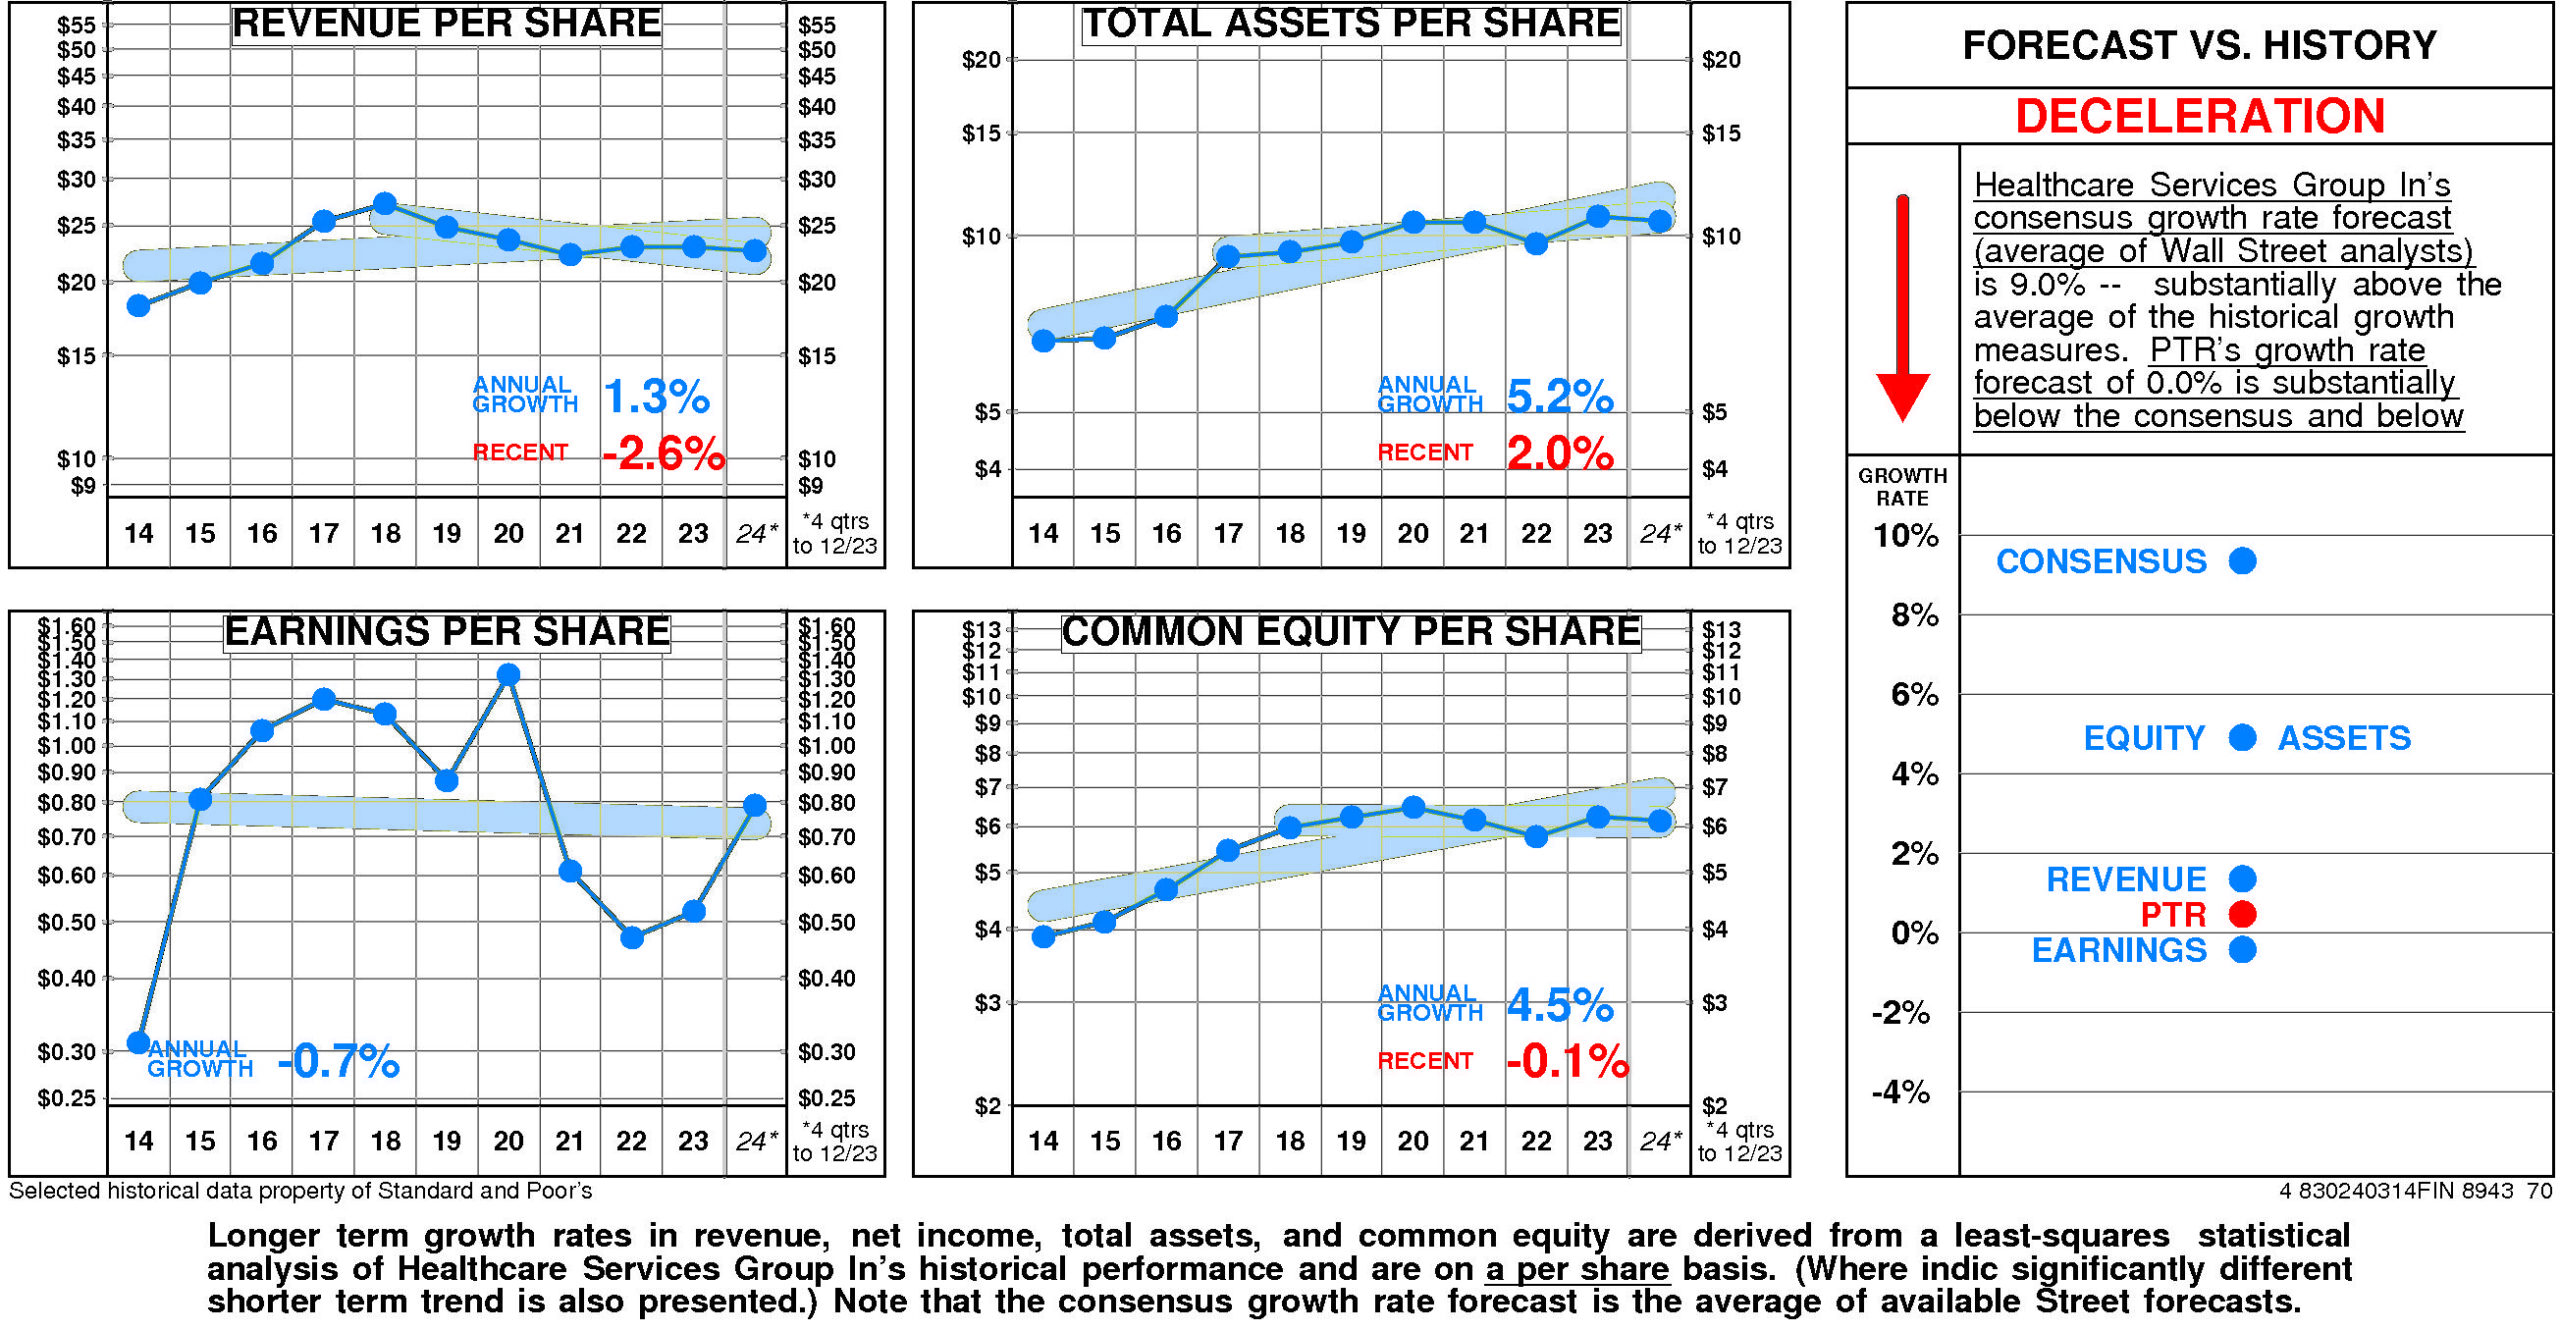
Overall, Healthcare Services Group In’s growth rate has slowed very considerably in recent years.
Healthcare Services Group In’s historical income statement growth has been in line with balance sheet growth. Revenue growth has paralleled asset growth; earnings growth has paralleled equity growth.
Annual revenue growth has been 1.3% per year. (More recently it has been -2.6%.)
Total asset growth has been 5.2% per year. (More recently it has been 2.0%.)
Annual E.P.S. growth has been -0.7% per year.
Equity growth has been 4.5% per year. (More recently it has been -0.1%.)
Healthcare Services Group In’s consensus growth rate forecast (average of Wall Street analysts) is 9.0% — substantially above the average of the historical growth measures.
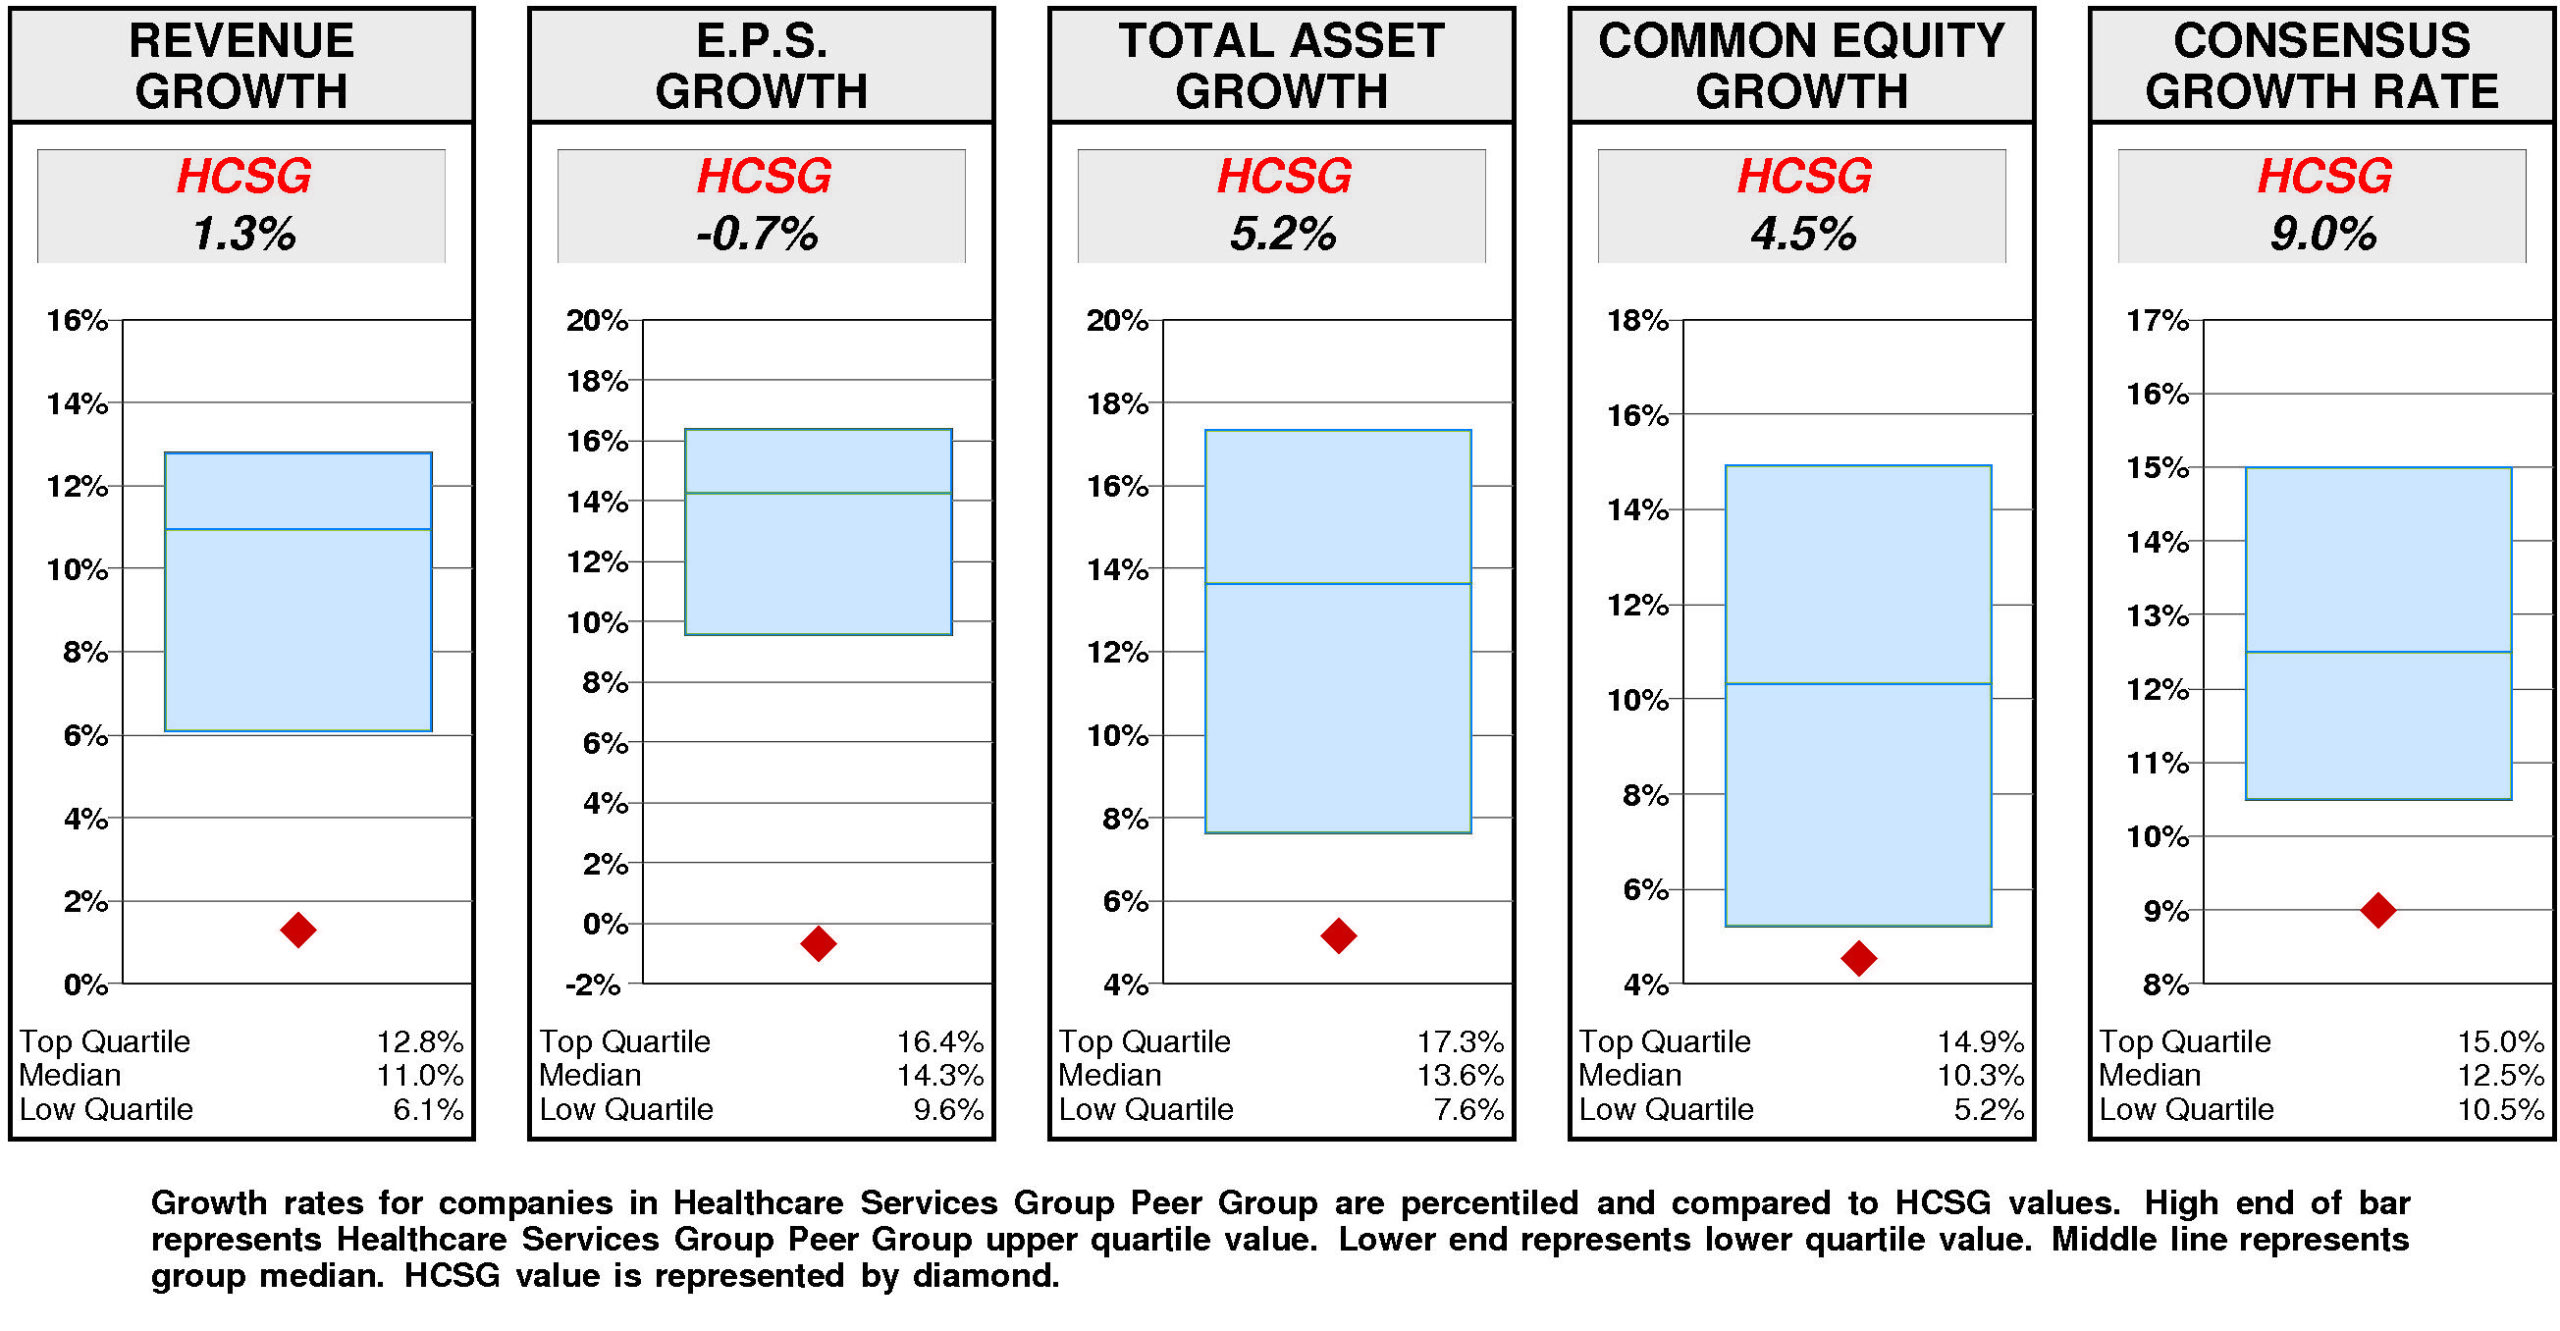
Relative to the Healthcare Services Group Peer Group, Healthcare Services Group’s historical growth measures are consistently lower quartile. Revenue growth (1.3%) has been lower quartile. Total asset growth (5.2%) has been lower quartile. E.P.S. growth (-0.7%) has been lower quartile. Equity growth (4.5%) has been lower quartile.
Consistent with this pattern, consensus growth forecast (9.0%) is also lower quartile.
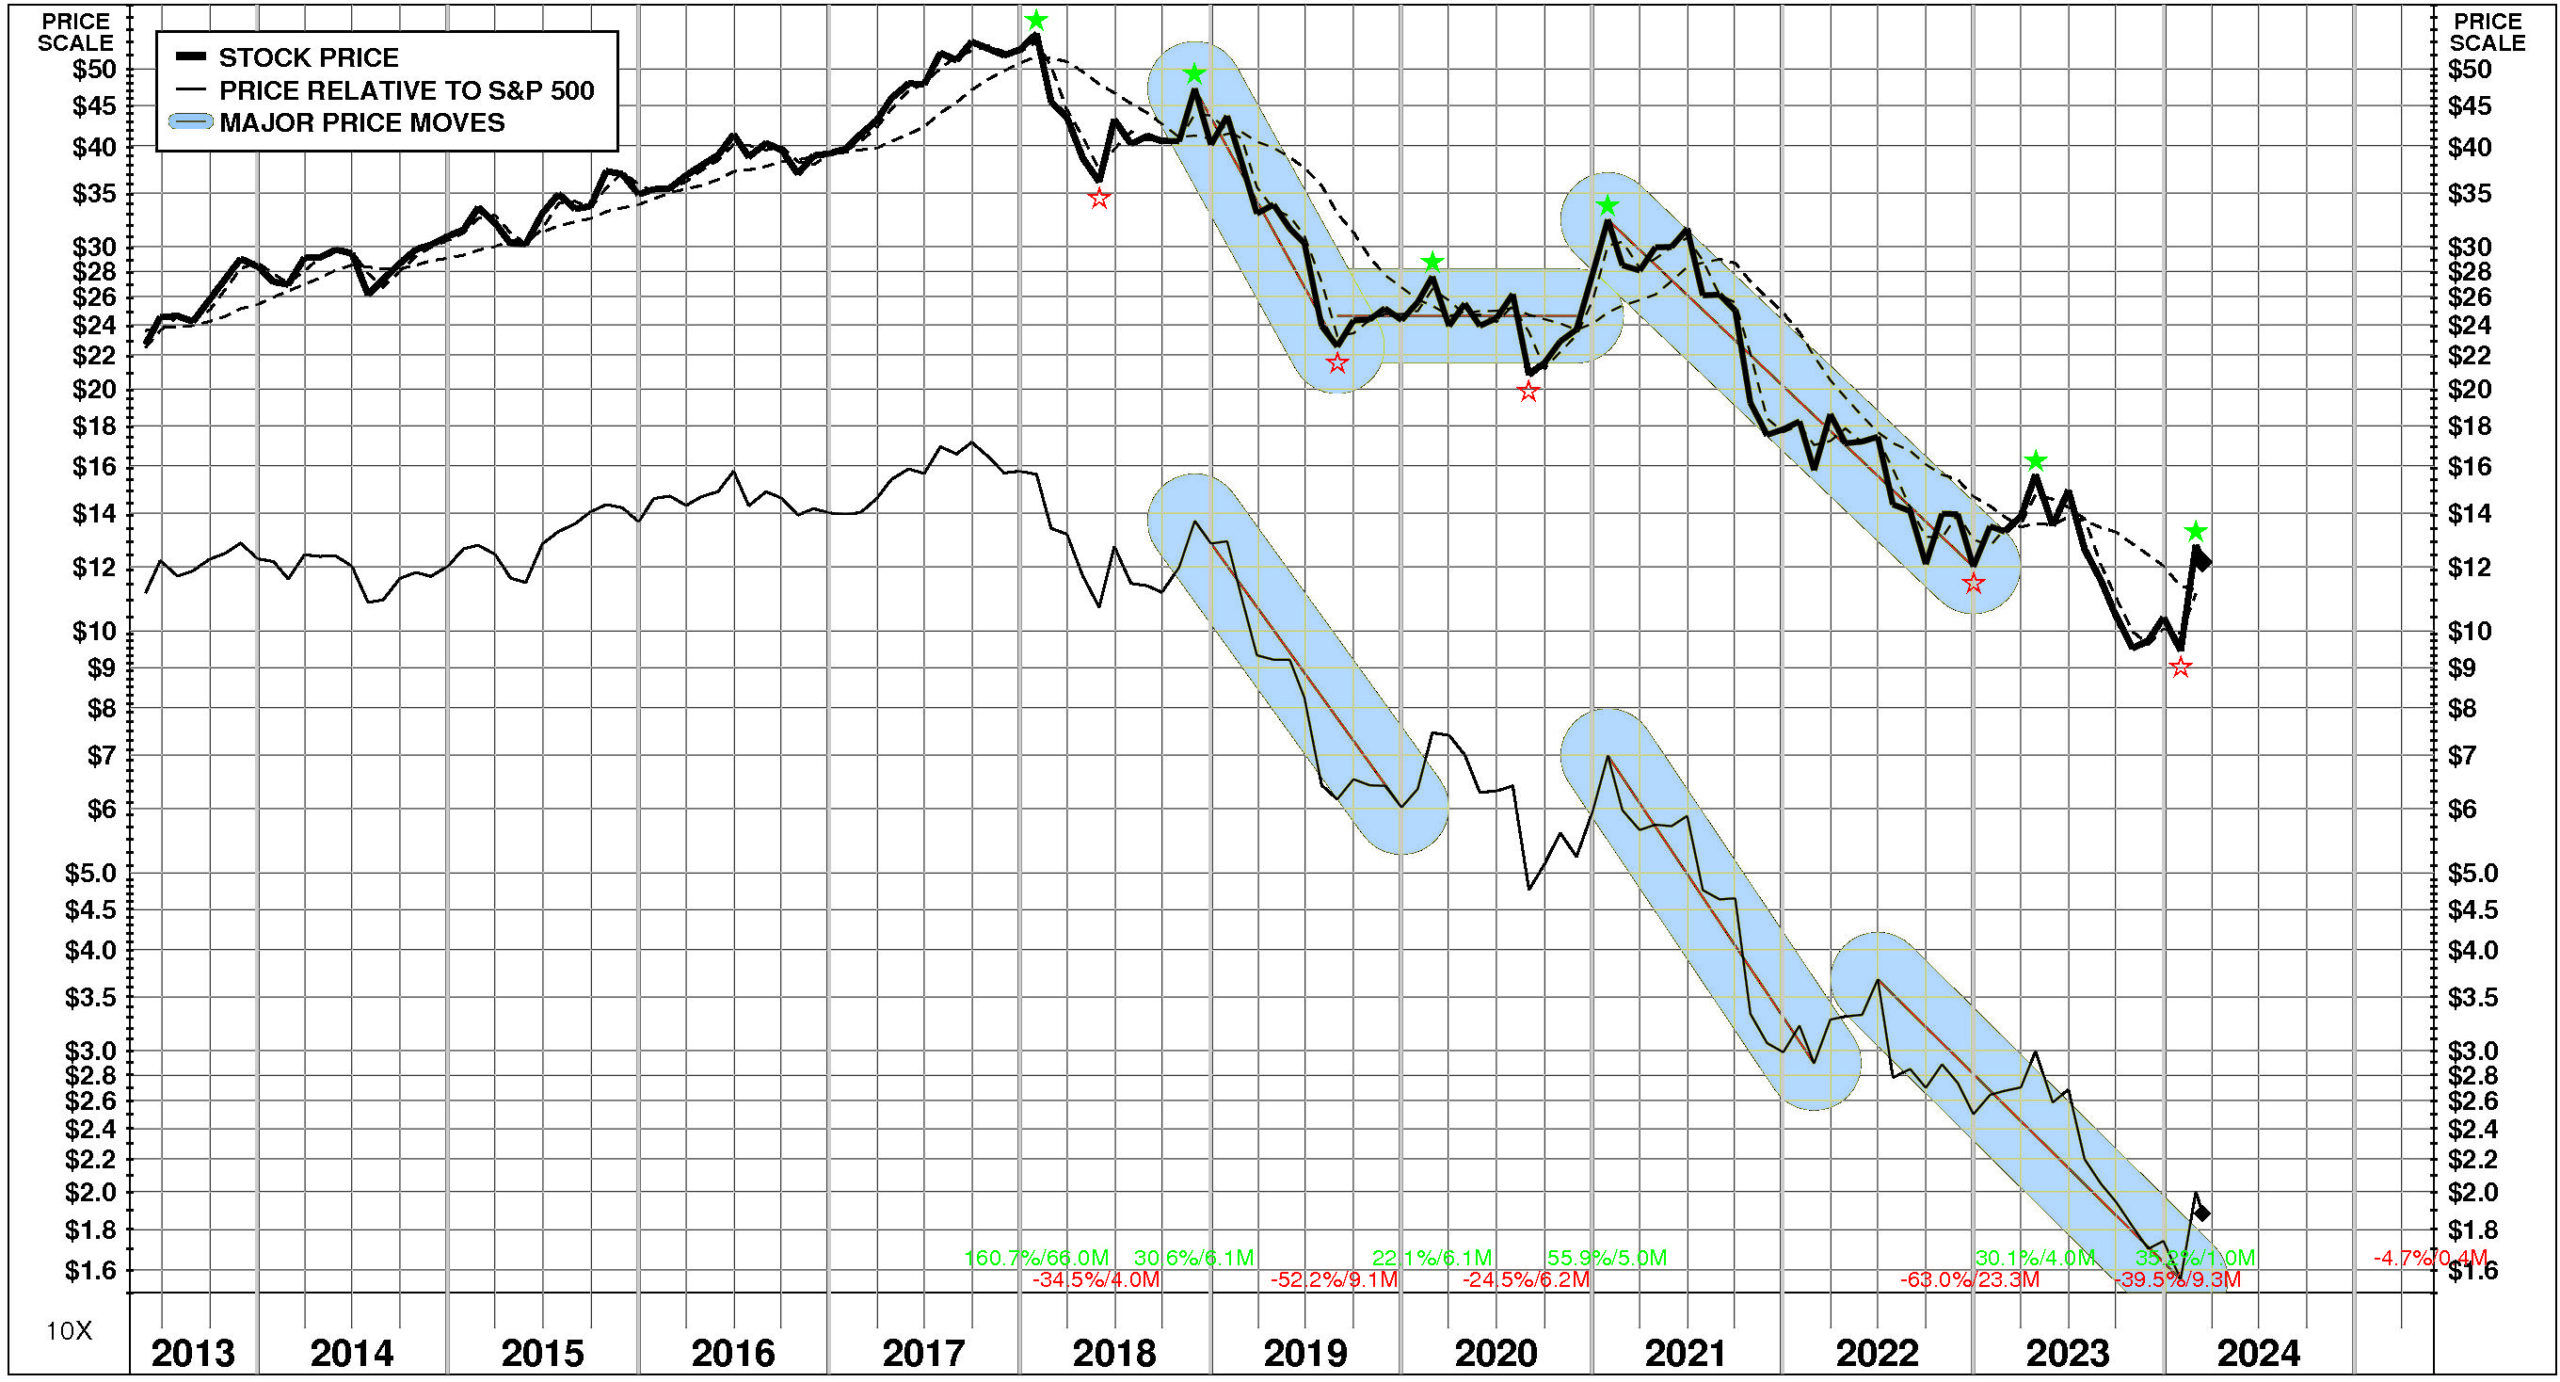
PRICE HISTORY
Over the full time period, Healthcare Services Group’s stock price performance has been variable and significantly below market. Between May, 2013 and March, 2024, Healthcare Services Group’s stock price fell -46%; relative to the market, this was a -83% loss. Significant price moves during the period: 1) January, 2021 – December, 2022: -63%; and 2) November, 2018 – August, 2019: -52%.
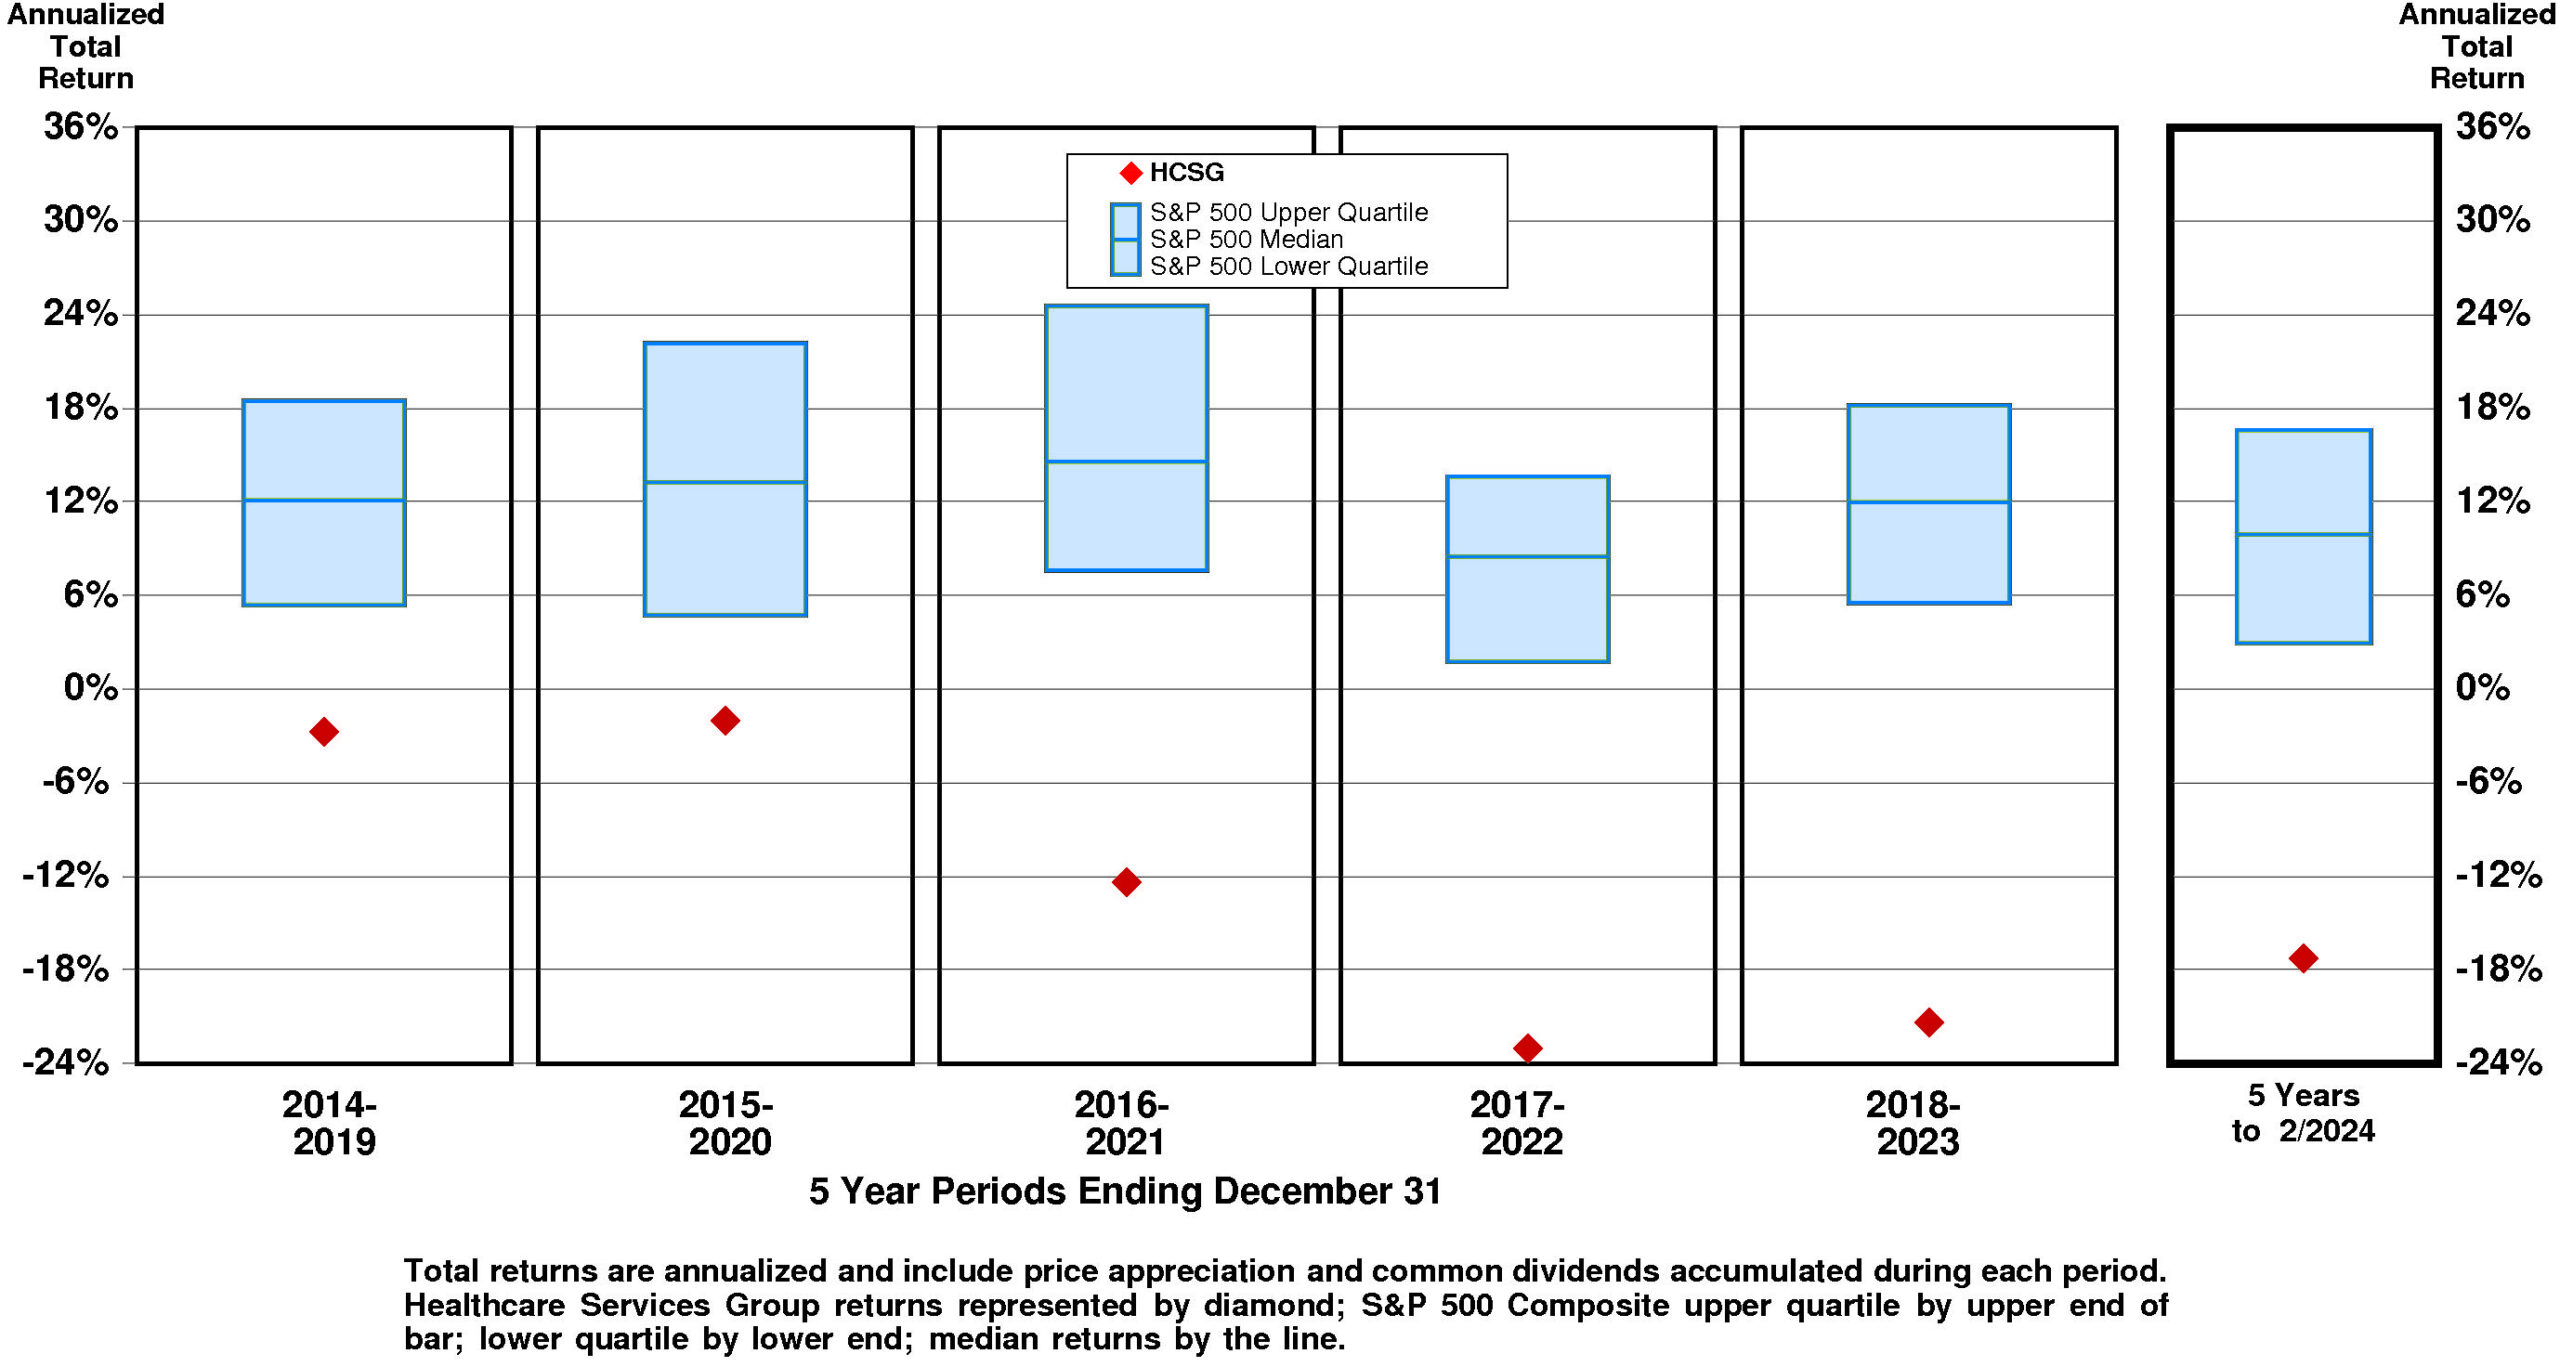
TOTAL INVESTMENT RETURNS
Current annual total return performance of -3.8% is substantially below median relative to the S&P 500 Composite.
In addition to being substantially below median relative to S&P 500 Composite, current annual total return performance through February, 2024 of -3.8% is substantially below median relative to Healthcare Services Group Inc Peer Group.
Current 5-year total return performance of -17.3% is lower quartile relative to the S&P 500 Composite.
Through February, 2024, with lower quartile current 5-year total return of -17.3% relative to S&P 500 Composite, Healthcare Services Group’s total return performance is lower quartile relative to Healthcare Services Group Inc Peer Group.
VALUATION BENCHMARKS
Relative to S&P 500 Composite, HCSG’s overall valuation is quite low. The highest factor, the price/earnings ratio, is slightly below median. Ratio of enterprise value/assets is below median. Price/equity ratio is near the lower quartile. Ratio of enterprise value/earnings before interest and taxes is lower quartile. The lowest factor, the ratio of enterprise value/revenue, is lower quartile.
Relative to Healthcare Services Group Peer Group, HCSG’s overall valuation is exceptionally low. Four of five factors are lower quartile. The highest factor is the price/earnings ratio, followed by the ratio of enterprise value/earnings before interest and taxes, then by the ratio of enterprise value/assets, then by the ratio of enterprise value/revenue. The lowest factor, price/equity ratio, is lower quartile.
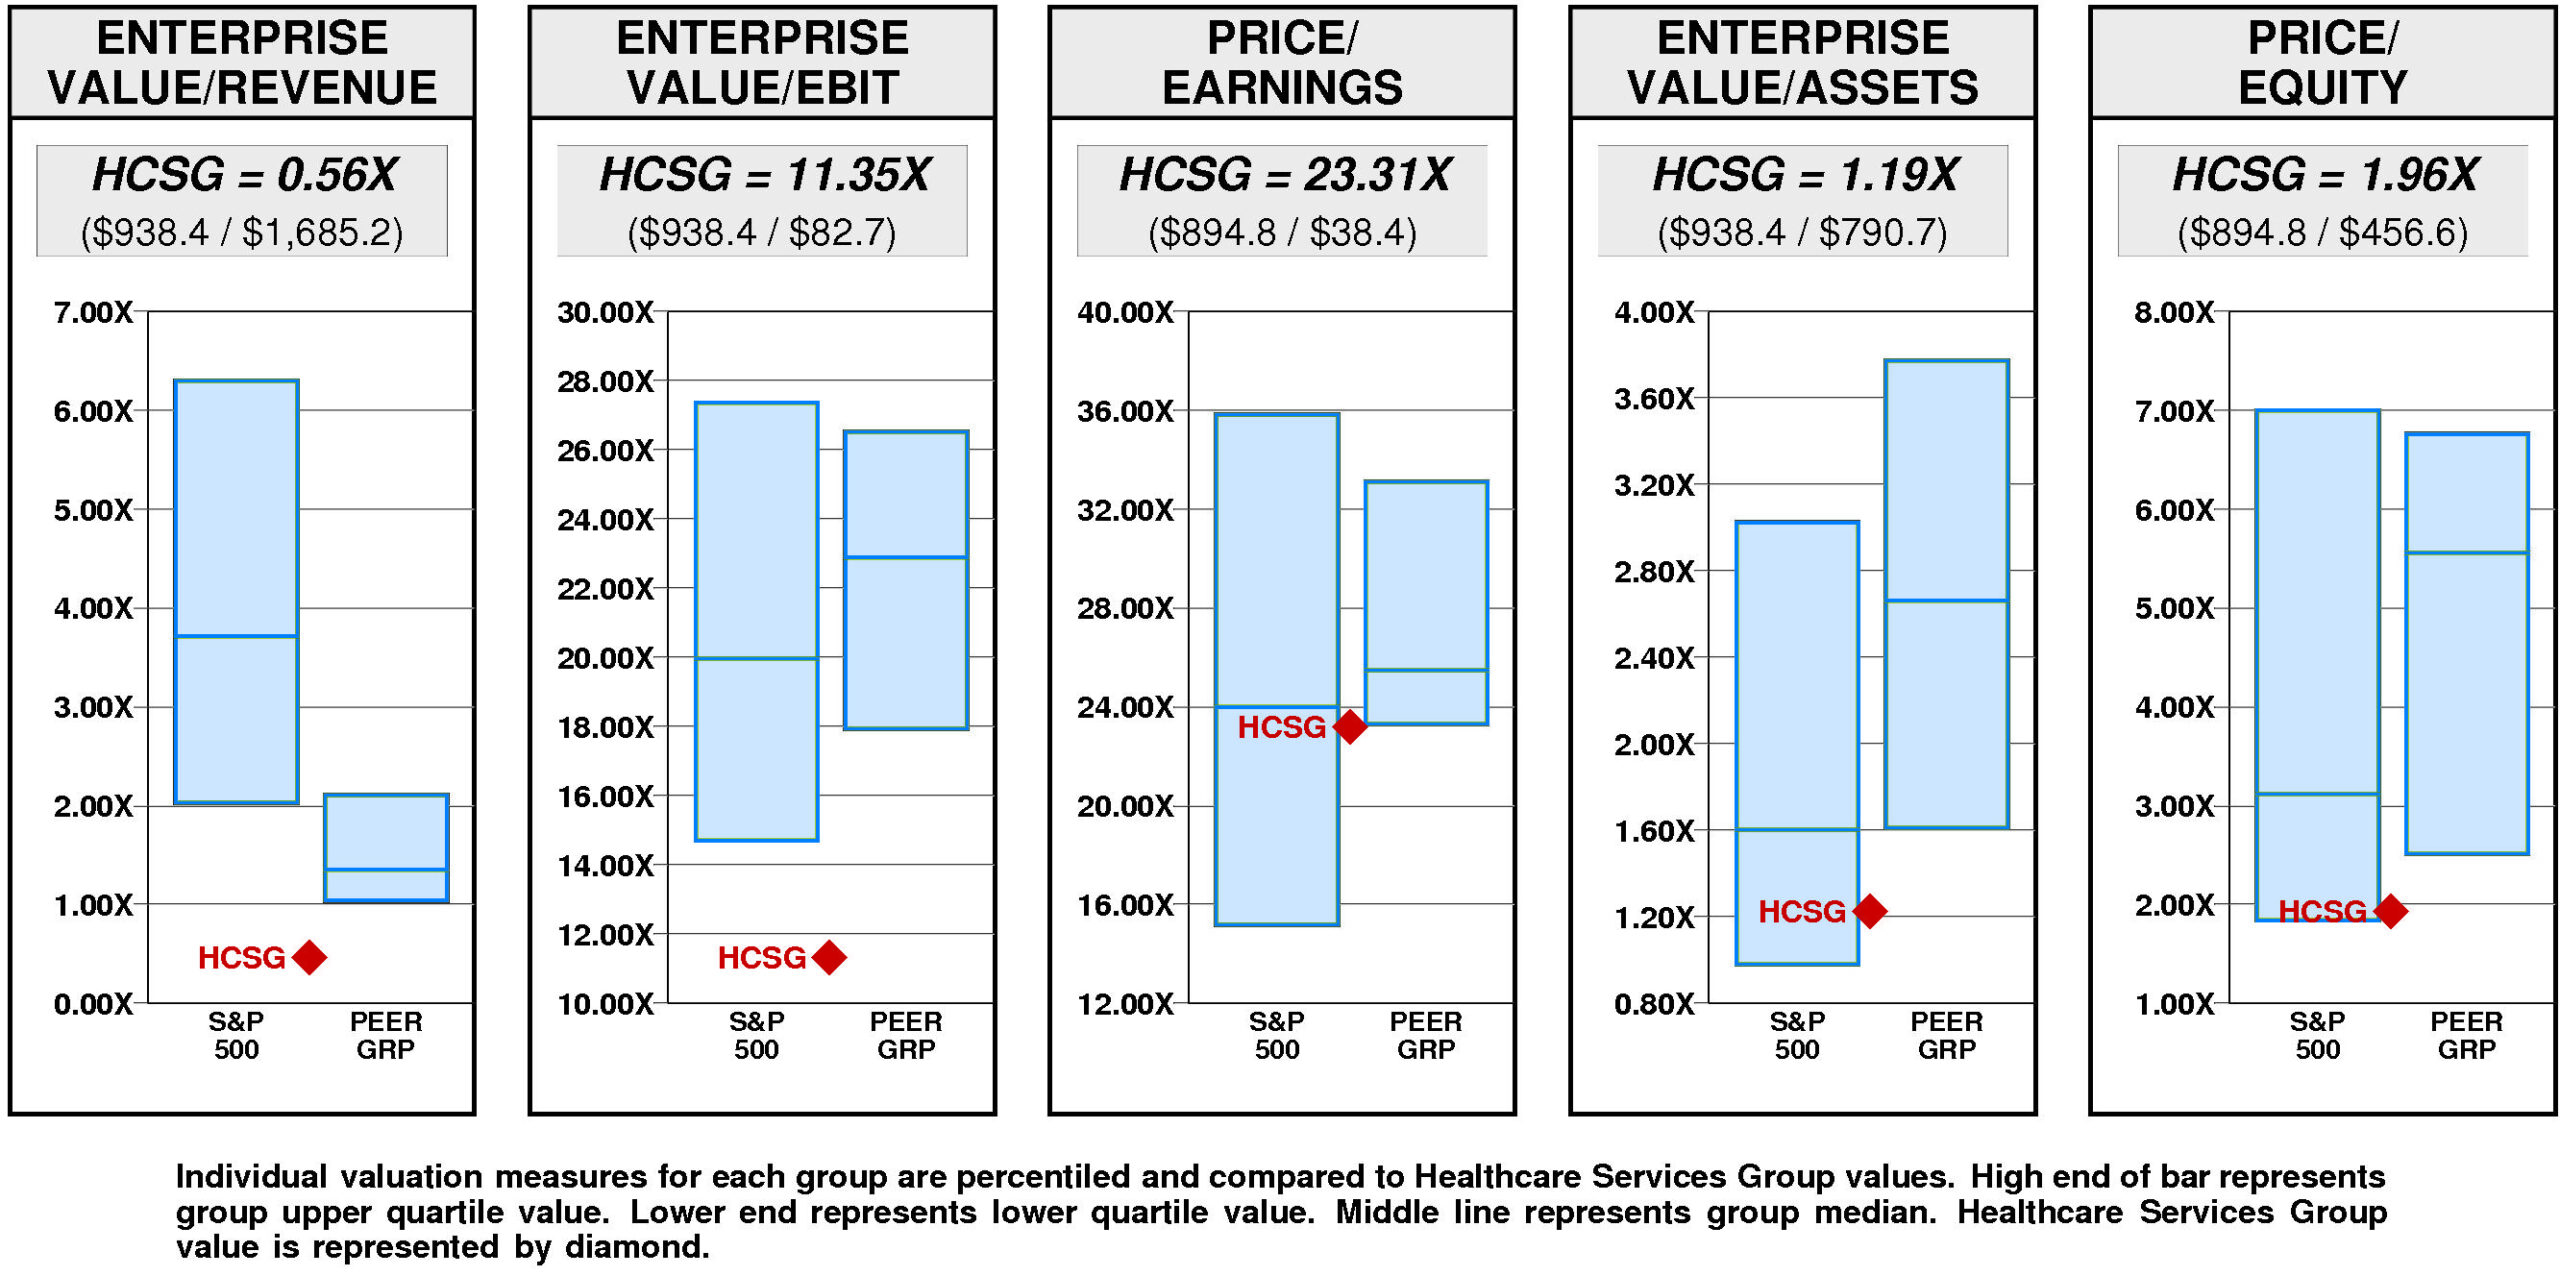
Healthcare Services Group has a major value gap compared to the median. For HCSG to hit median valuation, its current ratio of enterprise value/revenue would have to rise from the current level of 0.56X to 1.35X. If HCSG’s ratio of enterprise value/revenue were to rise to 1.35X, its stock price would be higher by $18 to $30.
For HCSG to achieve upper quartile valuation relative to the Healthcare Services Group Peer Group, its current ratio of enterprise value/revenue would have to rise from the current level of 0.56X to 2.11X. If HCSG’s ratio of enterprise value/revenue were to rise to 2.11X, its stock price would increase by $35 from the current level of $12.
VALUE TARGETS
HCSG’s future returns on capital are forecasted to exceed the cost of capital. Accordingly, the company is expected to continue to be an important Value Builder.
Healthcare Services Group’s current Price Target of $10 represents a -16% change from the current price of $12.16.
Healthcare Services Group’s low appreciation potential results in an appreciation score of 25 (75% of the universe has greater appreciation potential.)
Reinforcing this low Appreciation Score of 25, the low Power Rating of 30 contributes to an Value Trend Rating of F.
Healthcare Services Group’s current Price Target is $10 (+23% from the 2023 Target of $8 but -16% from the 03/13/24 price of $12.16). This rise in the Target is the result of a -2% decrease in the equity base and a +25% increase in the price/equity multiple. One Driver has a positive impact on the price/equity multiple, one has a negative impact, and one has no effect. The forecasted increase in return on equity has a very large positive impact on the price/equity multiple. The forecasted growth has no impact. The forecasted increase in cost of equity has a very large negative impact.
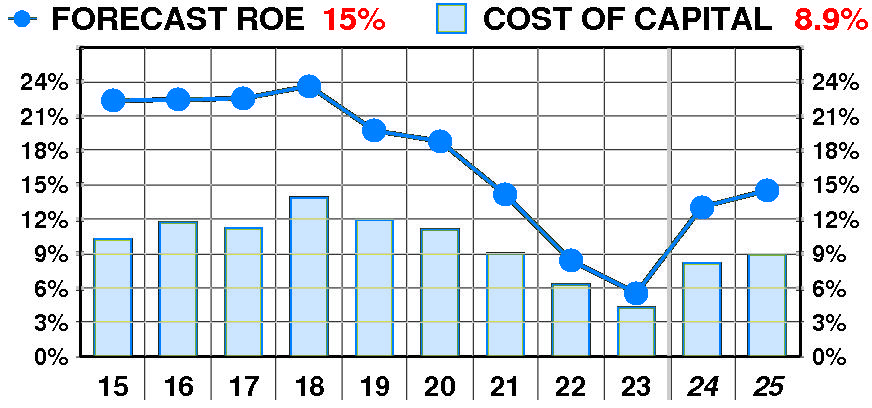
PTR’s return on equity forecast is 14.5% — above our recent forecasts. Forecasted return on equity suffered a dramatic, variable decline between 2015 and 2023. The current forecast is well below the 2018 peak of 24%.
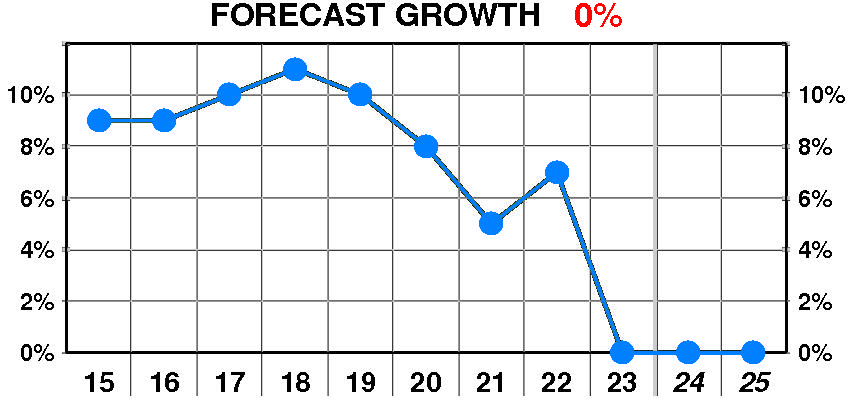
PTR’s growth forecast is 0.0% — in line with our recent forecasts. Forecasted growth suffered a dramatic, erratic decline between 2015 and 2023. The current forecast is significantly below the 2018 peak of 11%.
PTR’s cost of equity forecast is 8.9% — slightly above recent levels. Forecasted cost of equity enjoyed a dramatic, erratic decline between 2015 and 2023. The current forecast is below the 2018 peak of 13.9%.
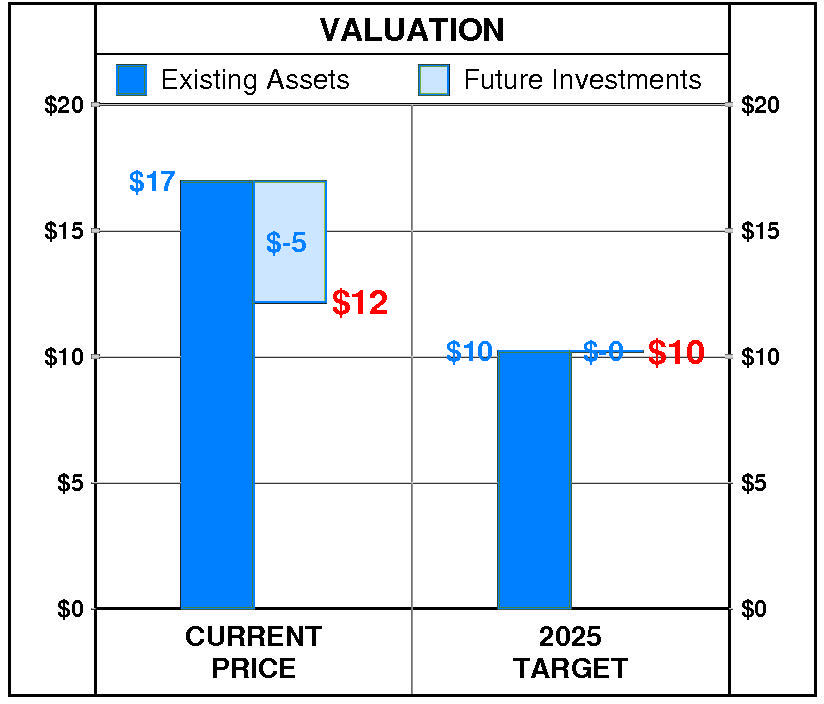
At Healthcare Services Group’s current price of $12.16, investors are placing a negative value of $-5 on its future investments. This view is not supported by the company’s most recent performance that reflected a growth rate of 0.0% per year, and a return on equity of 5.6% versus a cost of equity of 4.3%.
PTR’s 2025 Price Target of $10 is based on these forecasts and reflects an estimated value of existing assets of $10 and a value of future investments of $-0.
Be the first to comment