![]()
BUSINESS
Steelcase Inc. provides a portfolio of furniture and architectural products in the United States and internationally. It operates through Americas, EMEA, and Other segments. The company’s furniture portfolio includes furniture systems, seating, storage, fixed and height-adjustable desks, benches, and tables, as well as complementary products, such as work accessories, lighting, and mobile power and screens. Its seating products comprise task chairs; seating for collaborative environments and casual settings; and specialty seating for specific vertical markets, including education and healthcare. The company’s interior architectural products comprise full and partial height walls and architectural pods.
INVESTMENT RATING
Reflecting future returns on capital that are forecasted to be above the cost of capital, SCS is expected to continue to be an important Value Builder.
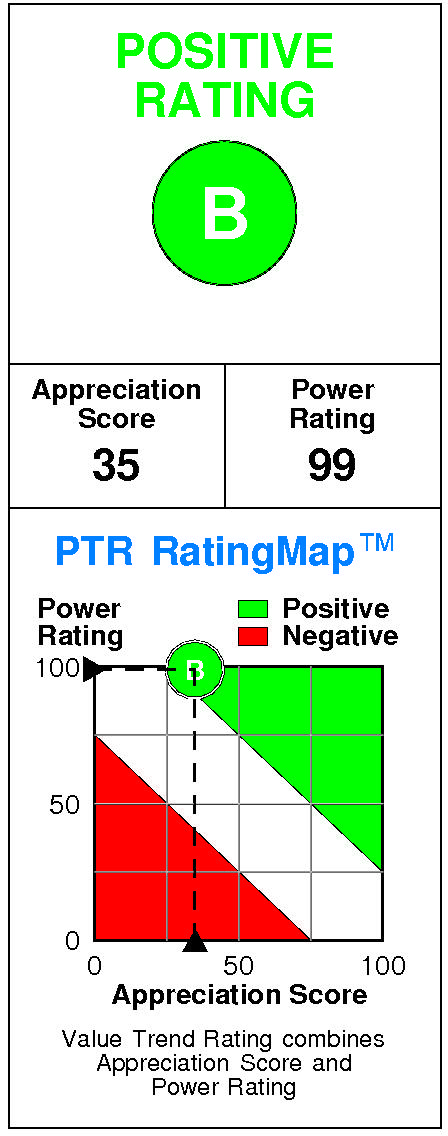
Steelcase has a current Value Trend Rating of B (Positive).
With this rating, PTR’s two proprietary measures of a stock’s current attractiveness are providing very contradictory signals. Steelcase has a slightly negative Appreciation Score of 35 but a very high Power Rating of 99, leading to the Positive Value Trend Rating.
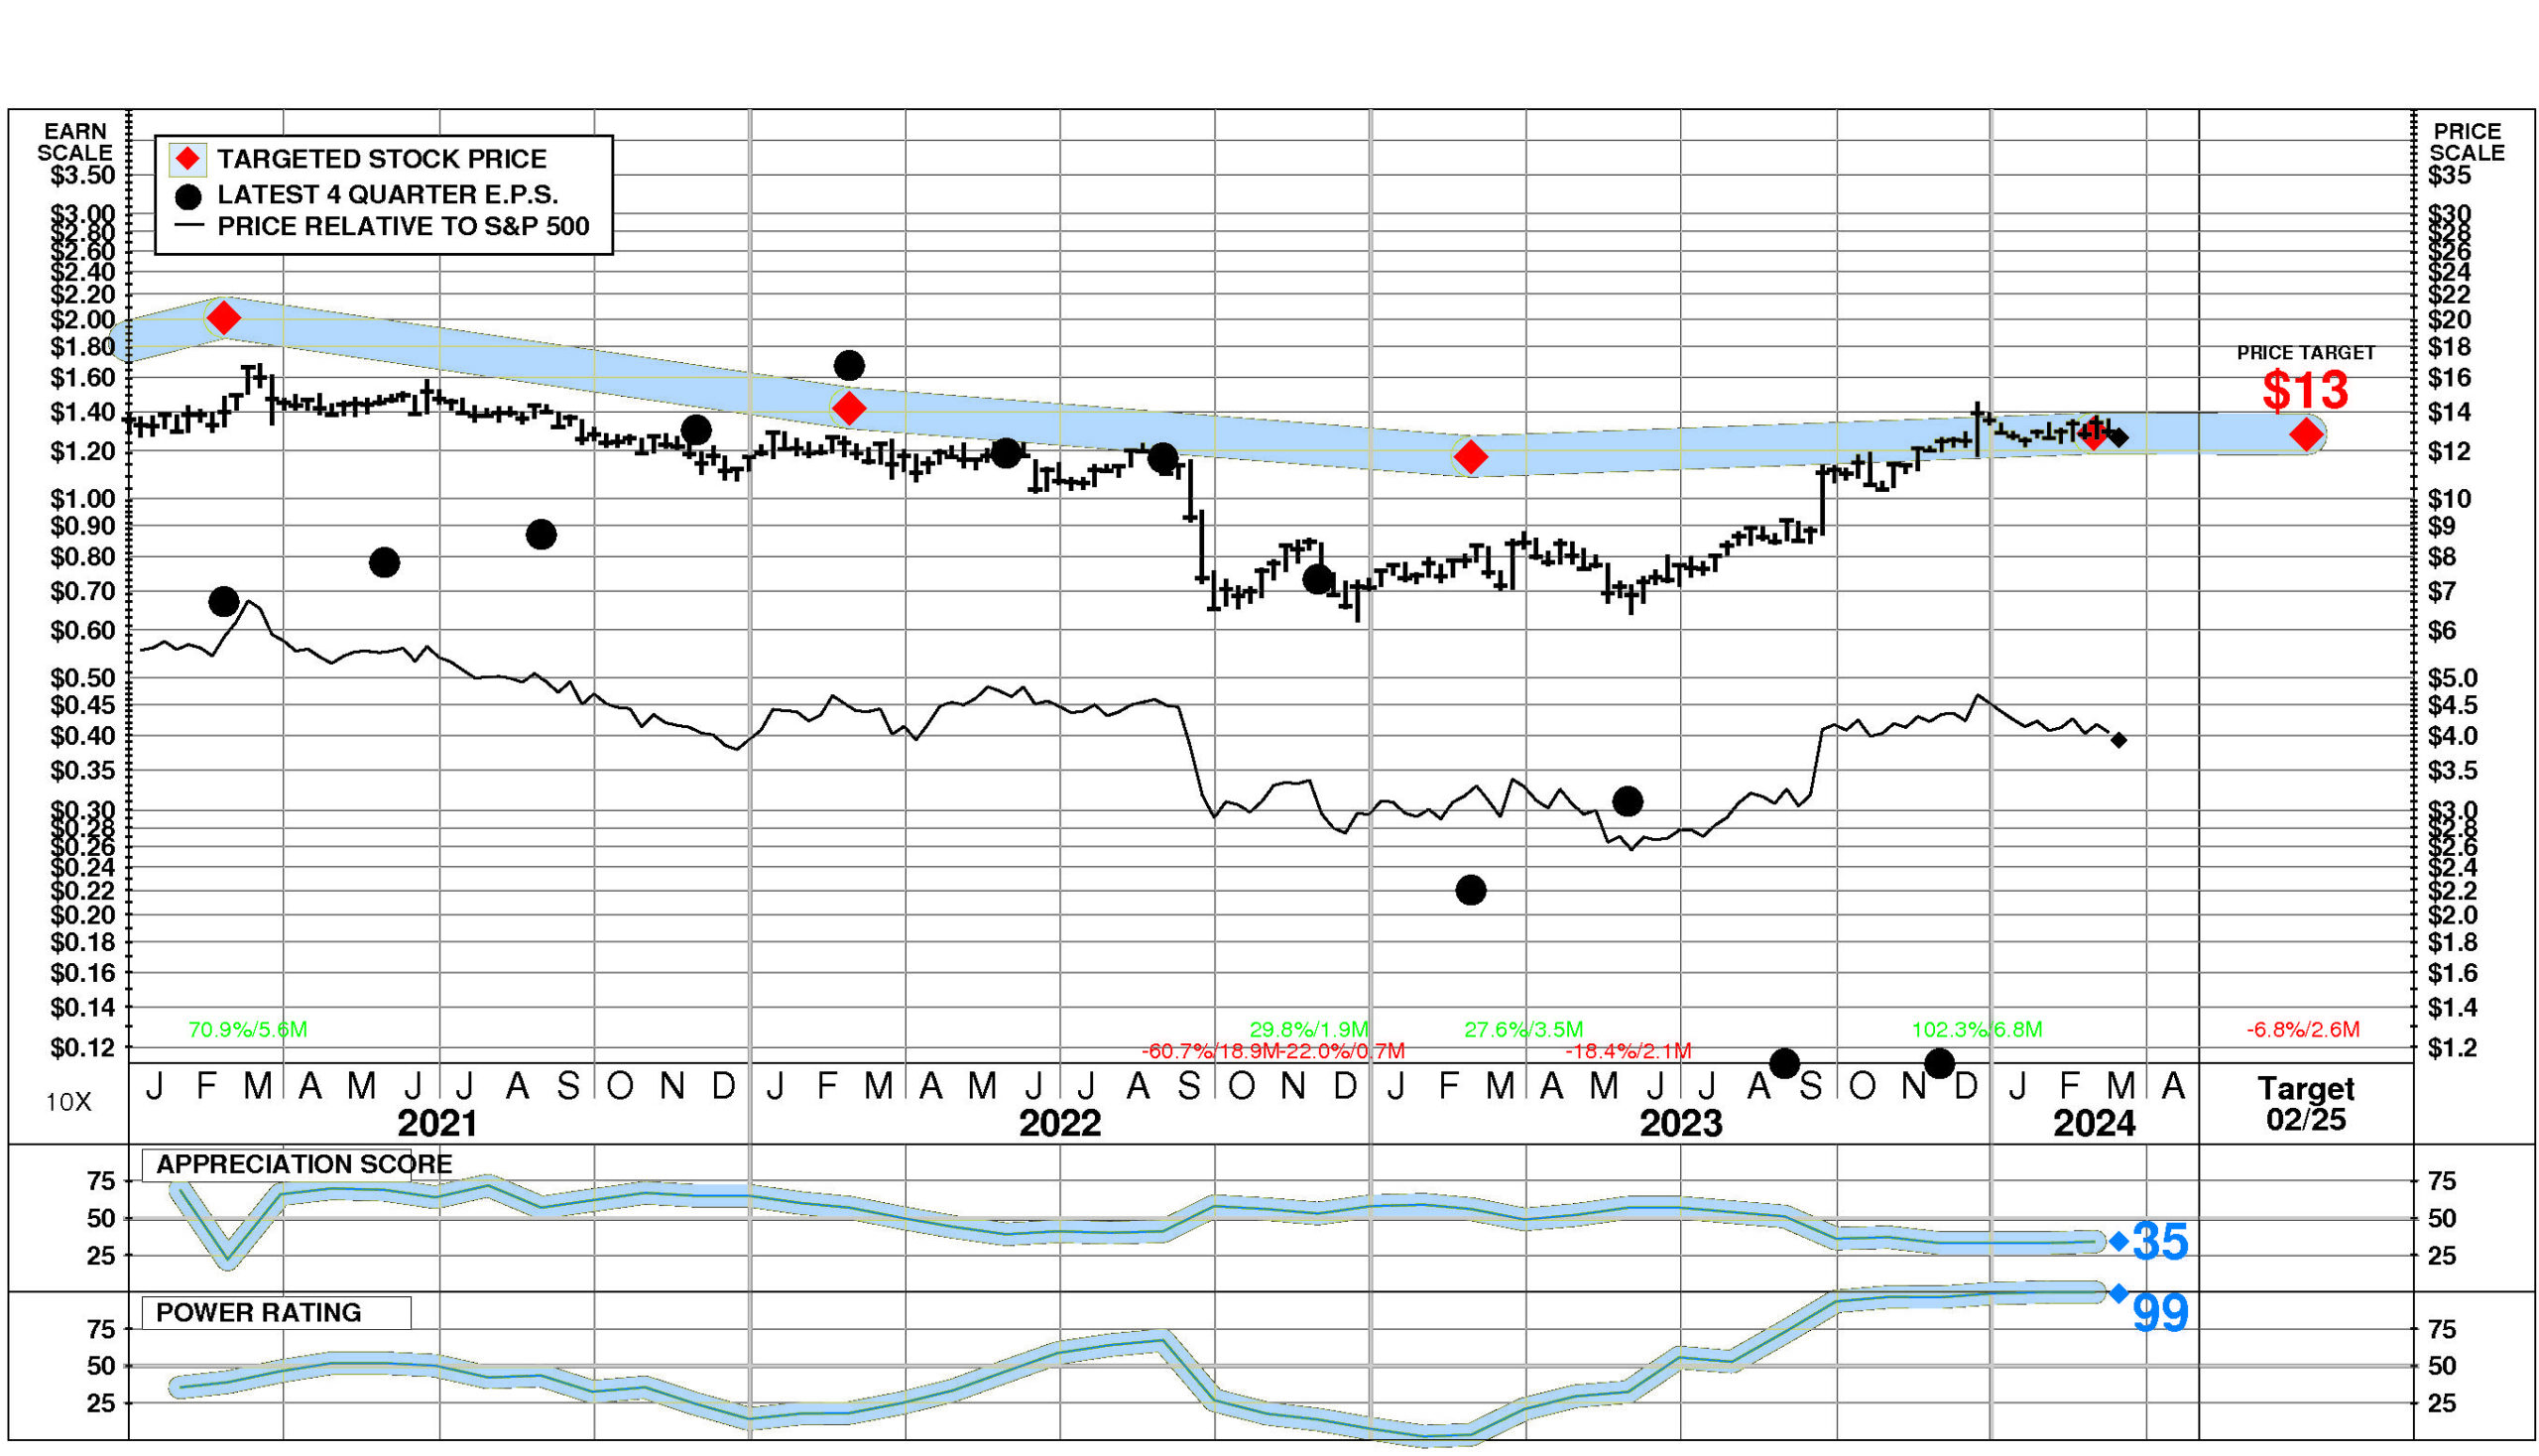
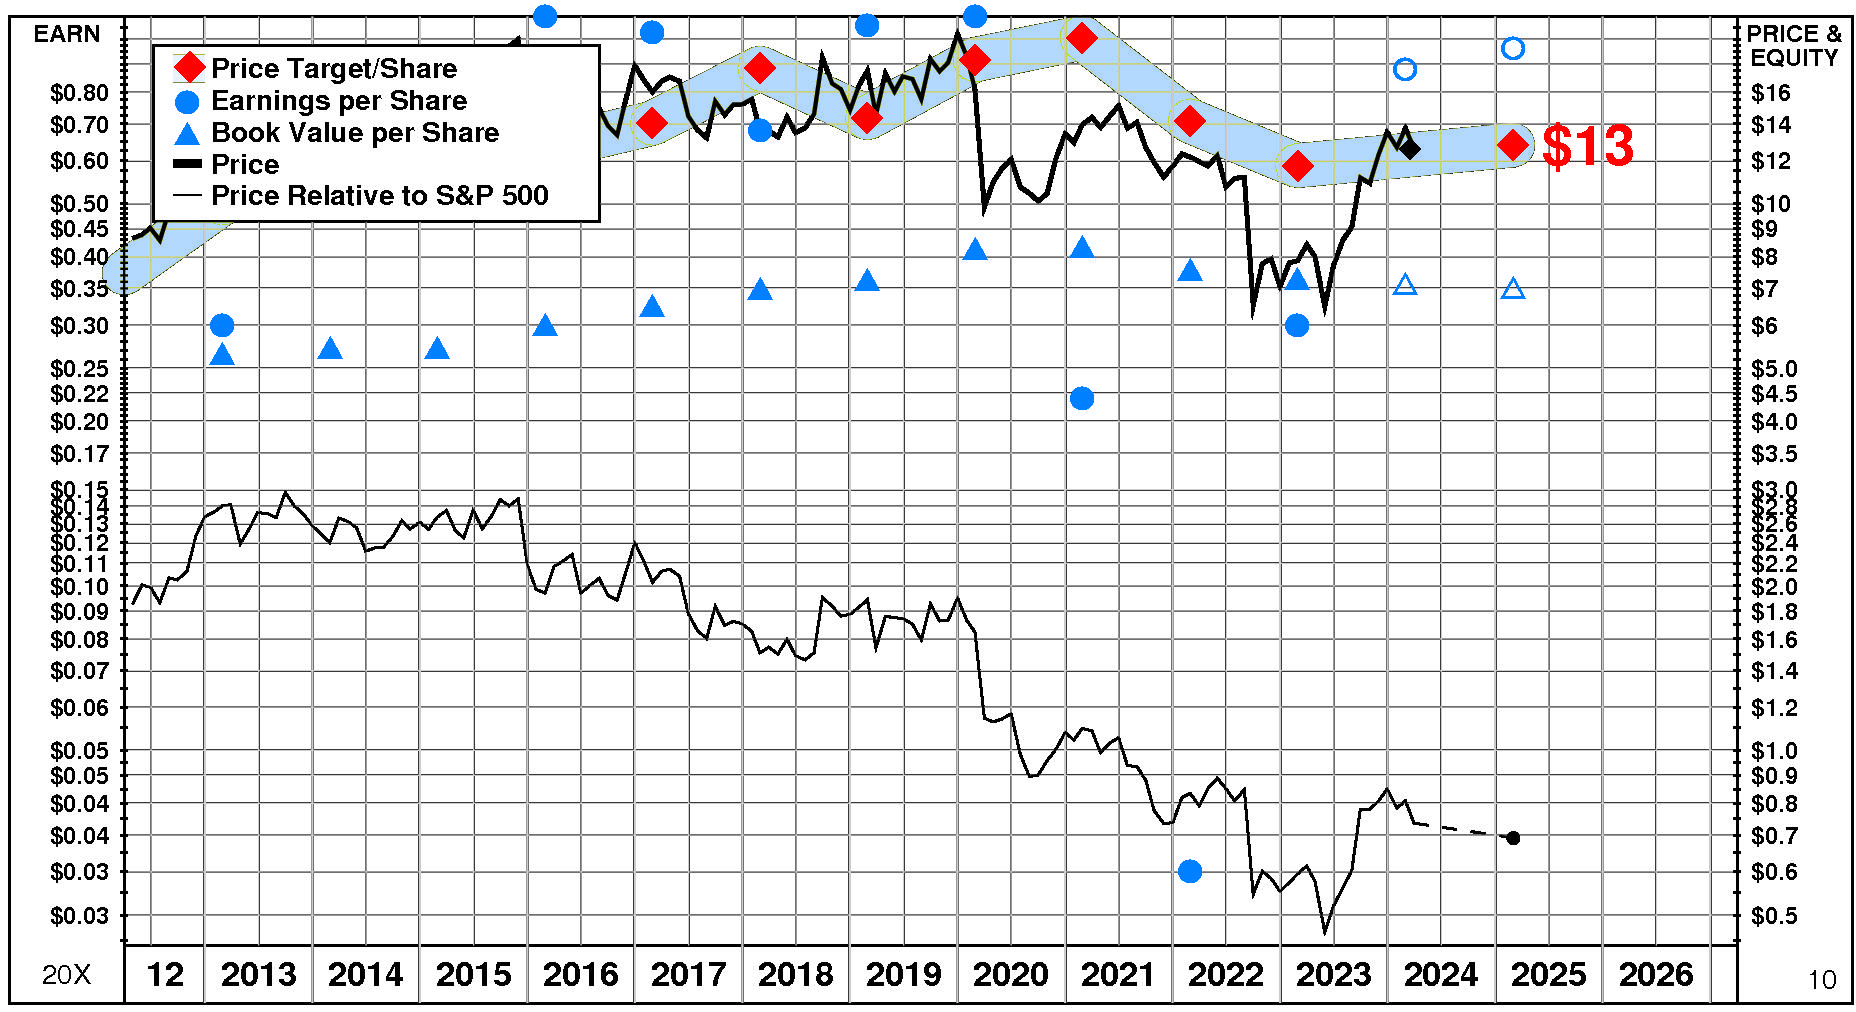
Steelcase’s stock is selling at targeted value. The current stock price of $12.64 compares to targeted value 12 months forward of $13.
This moderately low appreciation potential results in an appreciation score of 35 (65% of the universe has greater appreciation potential.)
Steelcase has a Power Rating of 99. (This very high Power Rating indicates that SCS has a better chance of achieving attractive investment performance over the near to intermediate term than all but 1% of companies in the universe.)
Factors contributing to this very high Power Rating include: recent price action has been extremely favorable; the Office Furniture, Excluding Wood comparison group is in an extremely strong phase currently; and earnings estimate behavior for SCS has been slightly favorable recently.
INVESTMENT PROFILE
Steelcase’s financial strength is average. Financial strength rating is 42.
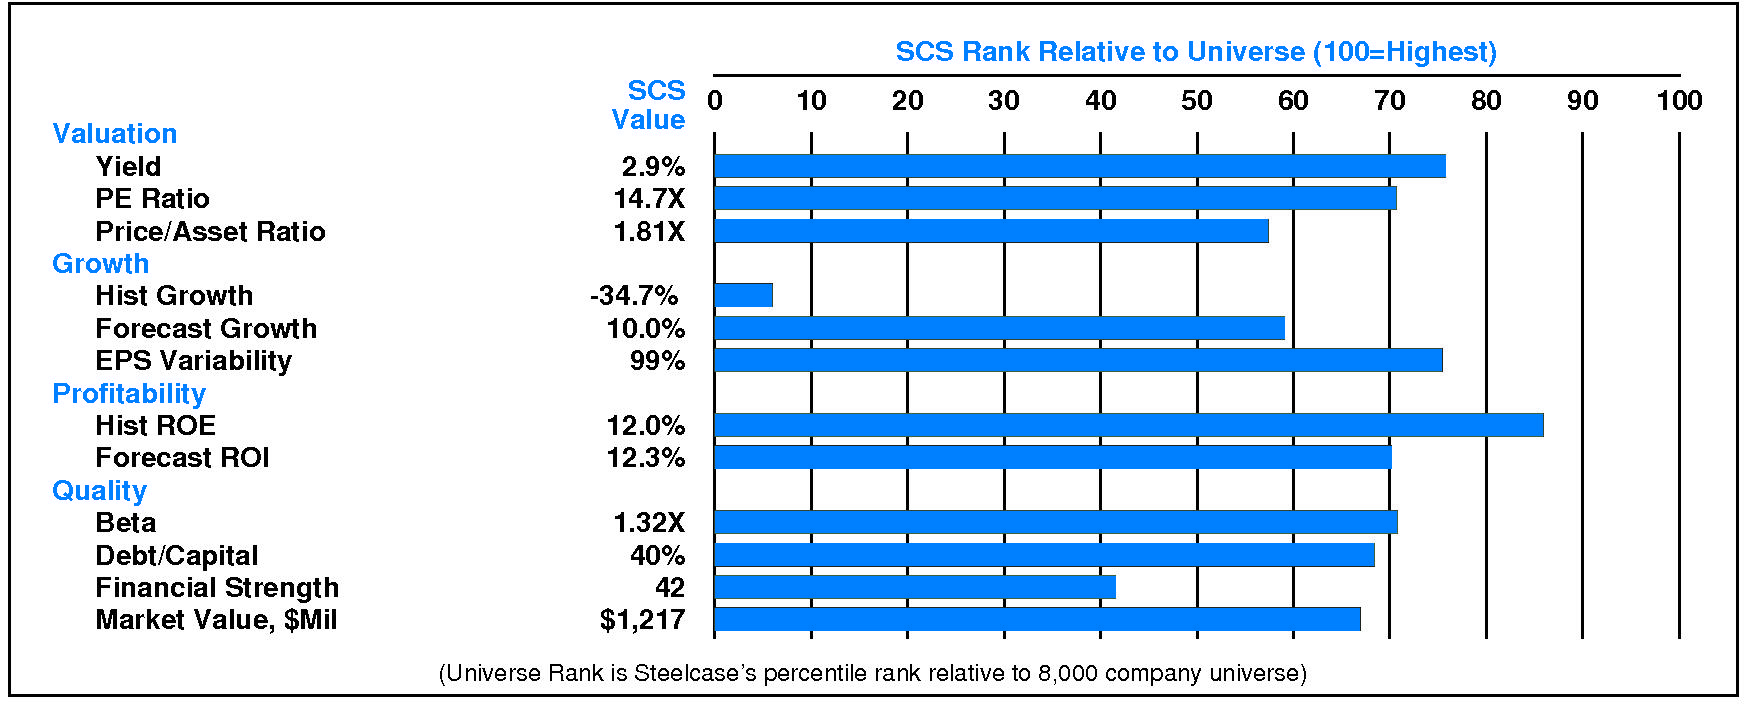
Relative to the S&P 500 Composite, Steelcase Inc. has moderate Value characteristics; its appeal is likely to be to Income-oriented investors; the perception is that SCS is higher risk. All factors are relative weaknesses. Relative weaknesses for Steelcase include: low financial strength, high stock price volatility, low historical growth, and high earnings variability. Steelcase’s valuation is low: moderate dividend yield, low P/E ratio, and low price/book ratio. SCS has unusually low market capitalization.
CURRENT SIGNALS
Steelcase’s current operations are strong. Return on equity is rising, reflecting: improving asset utilization; widening pretax margins; and rising leverage.
Steelcase’s current technical position is very strong. The stock price is in a 6.8 month up move. The stock has appreciated 102.3% from its prior low. The stock price is above its 200 day moving average which is in an uptrend.
ALERTS
Steelcase Inc. (NYSE: SCS) suffers from meaningful negative changes in investment behavior: negative upside/downside volume developed.
Positive development: significant quarterly earnings acceleration occurred. Negative development: the consensus estimate for February, 2024 decreased significantly.
The stock is currently rated B.
Steelcase Inc. (NYSE: SCS) stock declined modestly by -1.1% on 3/14/24. The stock closed at $12.64. Trading volume in this decline was normal. The stock has been exceptionally strong relative to the market over the last nine months but has declined -1.5% during the last week.
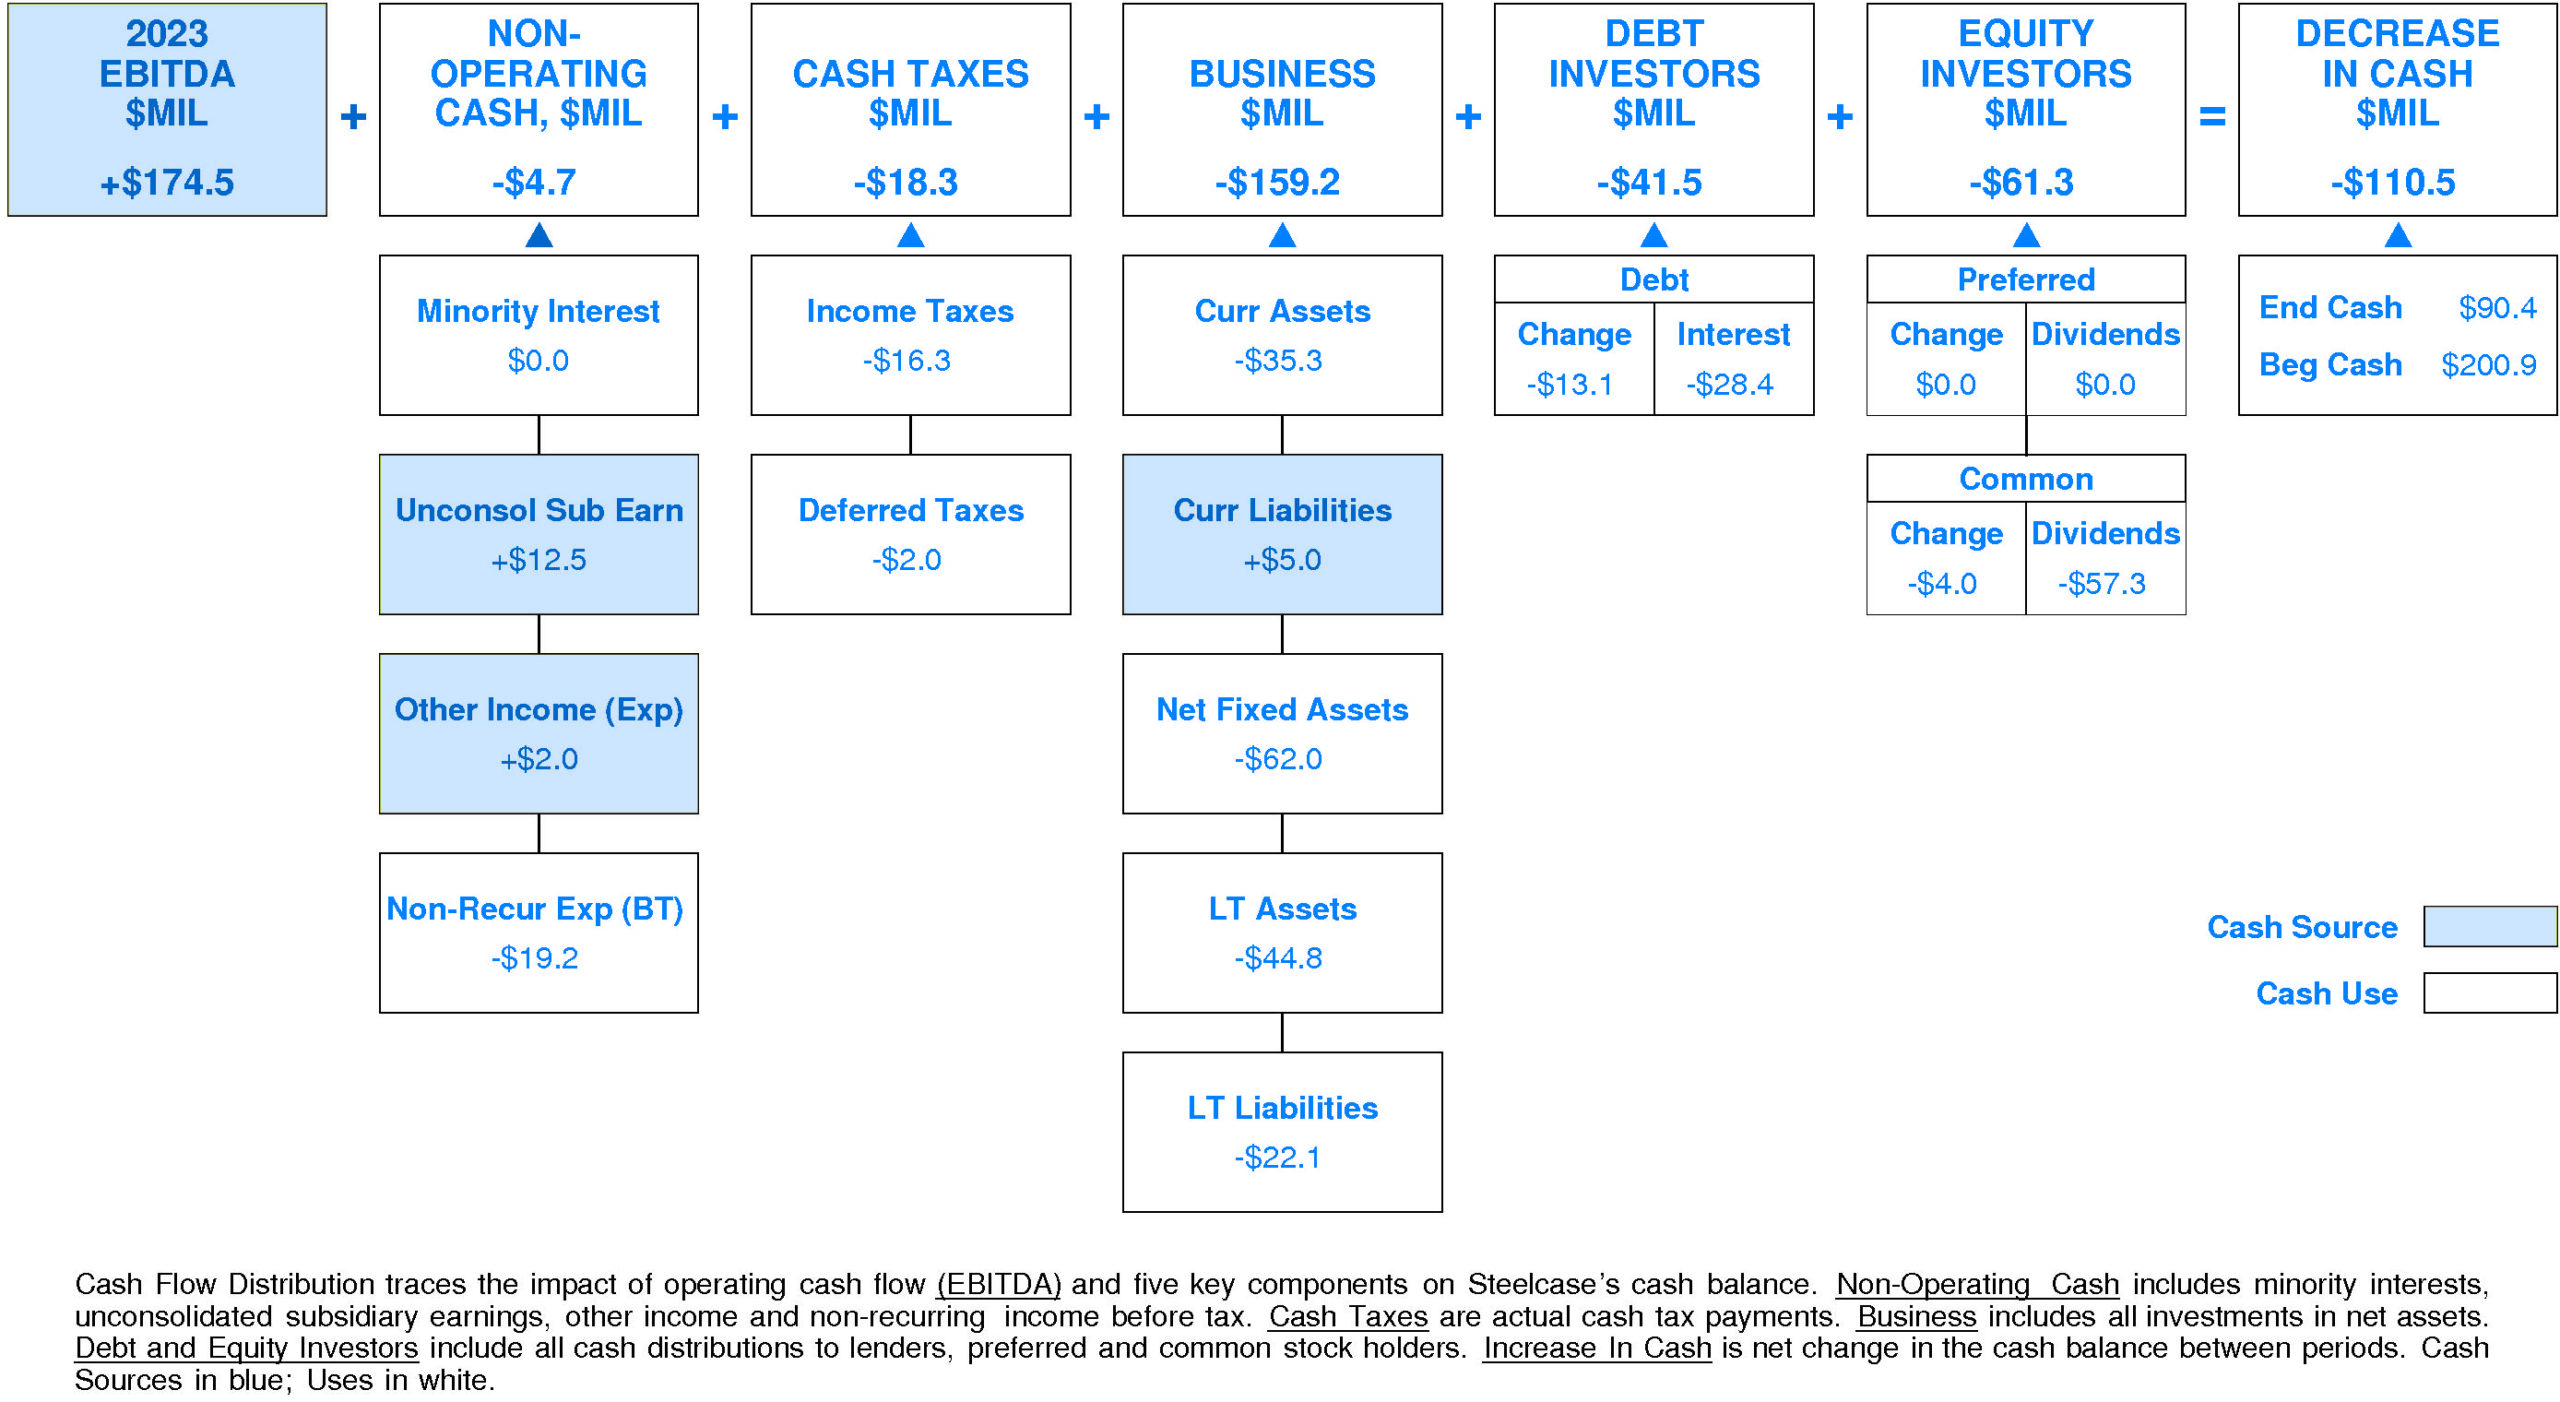
CASH FLOW
In 2023, Steelcase experienced a very significant reduction in cash of -$110.5 million (-55%). Sources of cash were much lower than uses. Cash generated from 2023 EBITDA totaled +$174.5 million. Non-operating uses consumed -$4.7 million (-3% of EBITDA). Cash taxes consumed -$18.3 million (-10% of EBITDA). Re-investment in the business amounted to -$159.2 million (-91% of EBITDA). On a net basis, debt investors withdrew -$41.5 million (-24% of EBITDA) while equity investors pulled out -$61.3 million (-35% of EBITDA).
Steelcase’s Non-operating Income, %EBITDA has exhibited a volatile overall uptrend over the period. This improvement was accompanied by stability for the Steelcase Peer Group. In most years, Steelcase was in the top quartile and third quartile. Currently, Steelcase is below median at -3% of EBITDA (-$4.7 million).
Steelcase’s Cash Taxes, %EBITDA enjoyed a strong overall uptrend over the period. This improvement was accompanied by a similar trend for the Steelcase Peer Group. In most years, Steelcase was in the top quartile and third quartile. Currently, Steelcase is upper quartile at -10% of EBITDA (-$18.3 million).
Steelcase’s Business Re-investment, %EBITDA has suffered a very strong overall downtrend over the period. This downtrend was accompanied by a similar trend for the Steelcase Peer Group. In most years, Steelcase was in the second quartile and lower quartile. Currently, Steelcase is slightly above median at -91% of EBITDA (-$159.2 million).
Steelcase’s Debt Investors, %EBITDA has experienced a downtrend over the period. This downtrend was accompanied by an opposite trend for the Steelcase Peer Group. In most years, Steelcase was in the third quartile and top quartile. Currently, Steelcase is lower quartile at -24% of EBITDA (-$41.5 million).
Steelcase’s Equity Investors, %EBITDA has suffered a volatile overall downtrend over the period. This downtrend was accompanied by stability for the Steelcase Peer Group. In most years, Steelcase was in the third quartile and second quartile. Currently, Steelcase is above median at -35% of EBITDA (-$61.3 million).
Steelcase’s Change in Cash, %EBITDA has experienced a volatile overall downtrend over the period. This downtrend was accompanied by stability for the Steelcase Peer Group. In most years, Steelcase was in the top quartile and lower quartile. Currently, Steelcase is lower quartile at -63% of EBITDA (-$110.5 million).
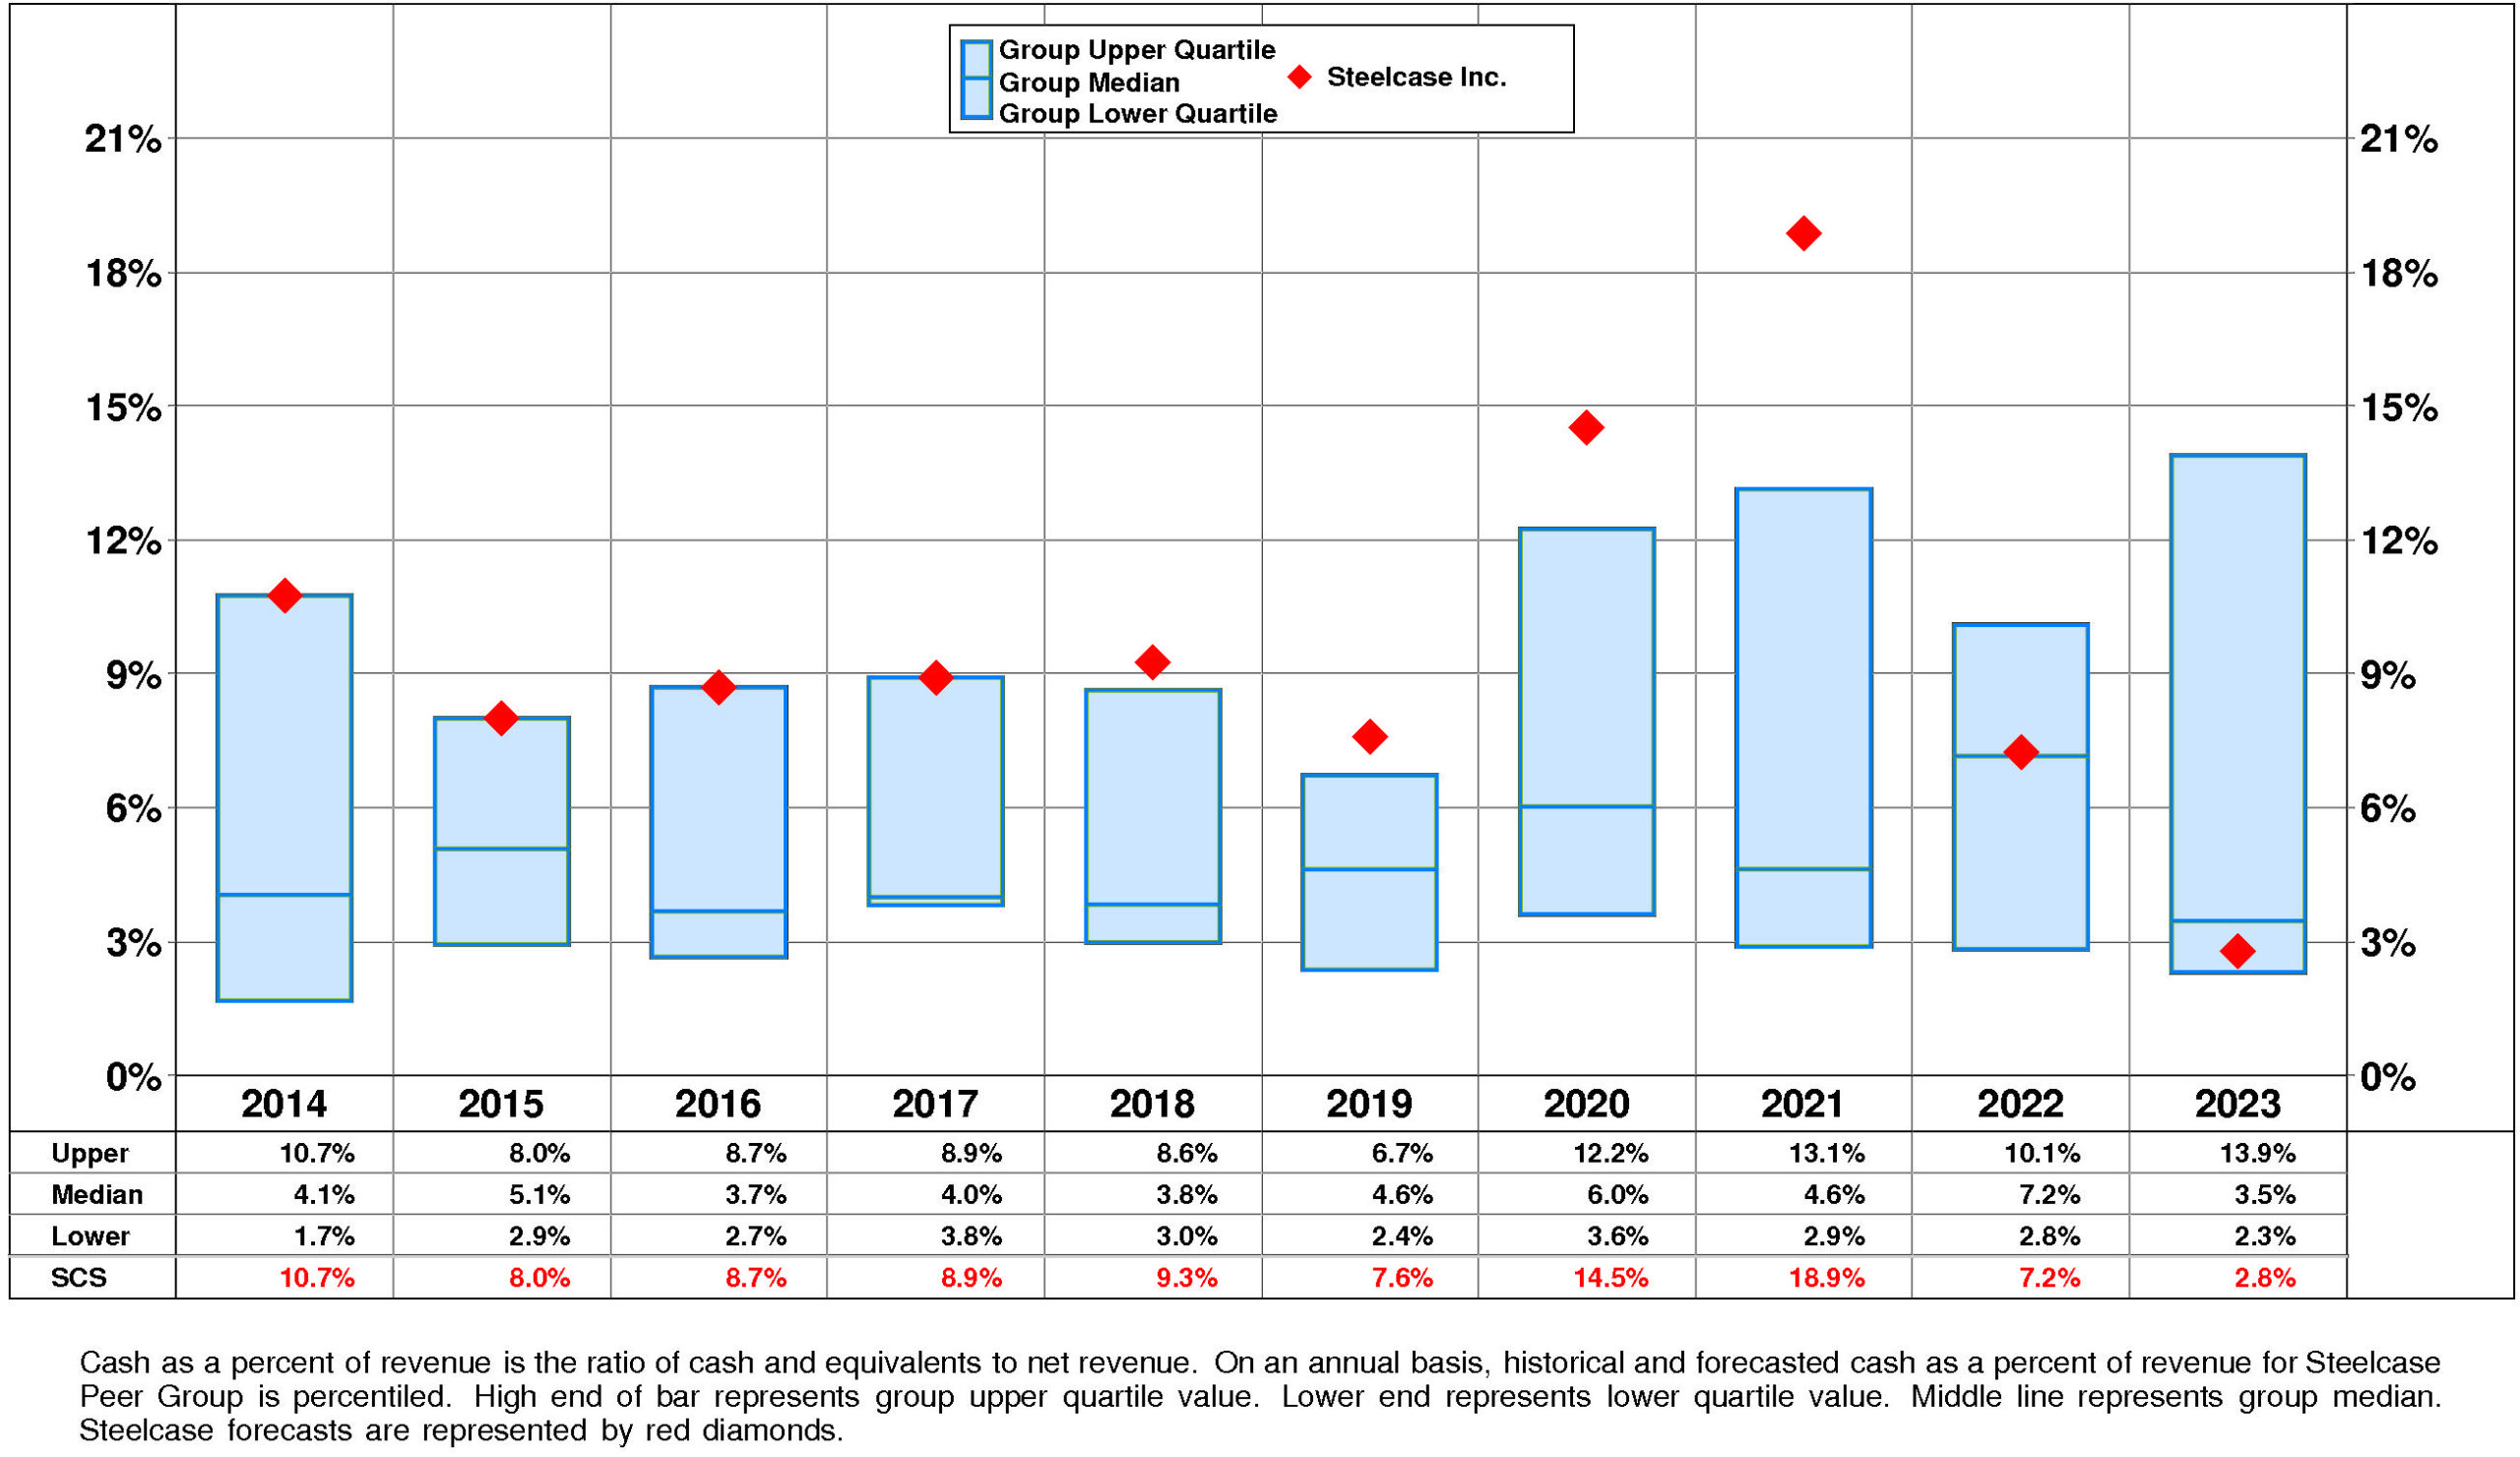
Steelcase’s Cash, %Revenue has exhibited little to no overall change over the period. This stability was accompanied by stability for the Steelcase Peer Group as well. (Since 2021 Cash, %Revenue has experienced a very sharp decline.) In most years, Steelcase was in the top quartile. Currently, Steelcase is below median at +3%.
PROFITABILITY
Steelcase’s return on equity has eroded very significantly since 2014. The current level of 8.6% is 3.17X the low for the period and is -33.5% from the high.
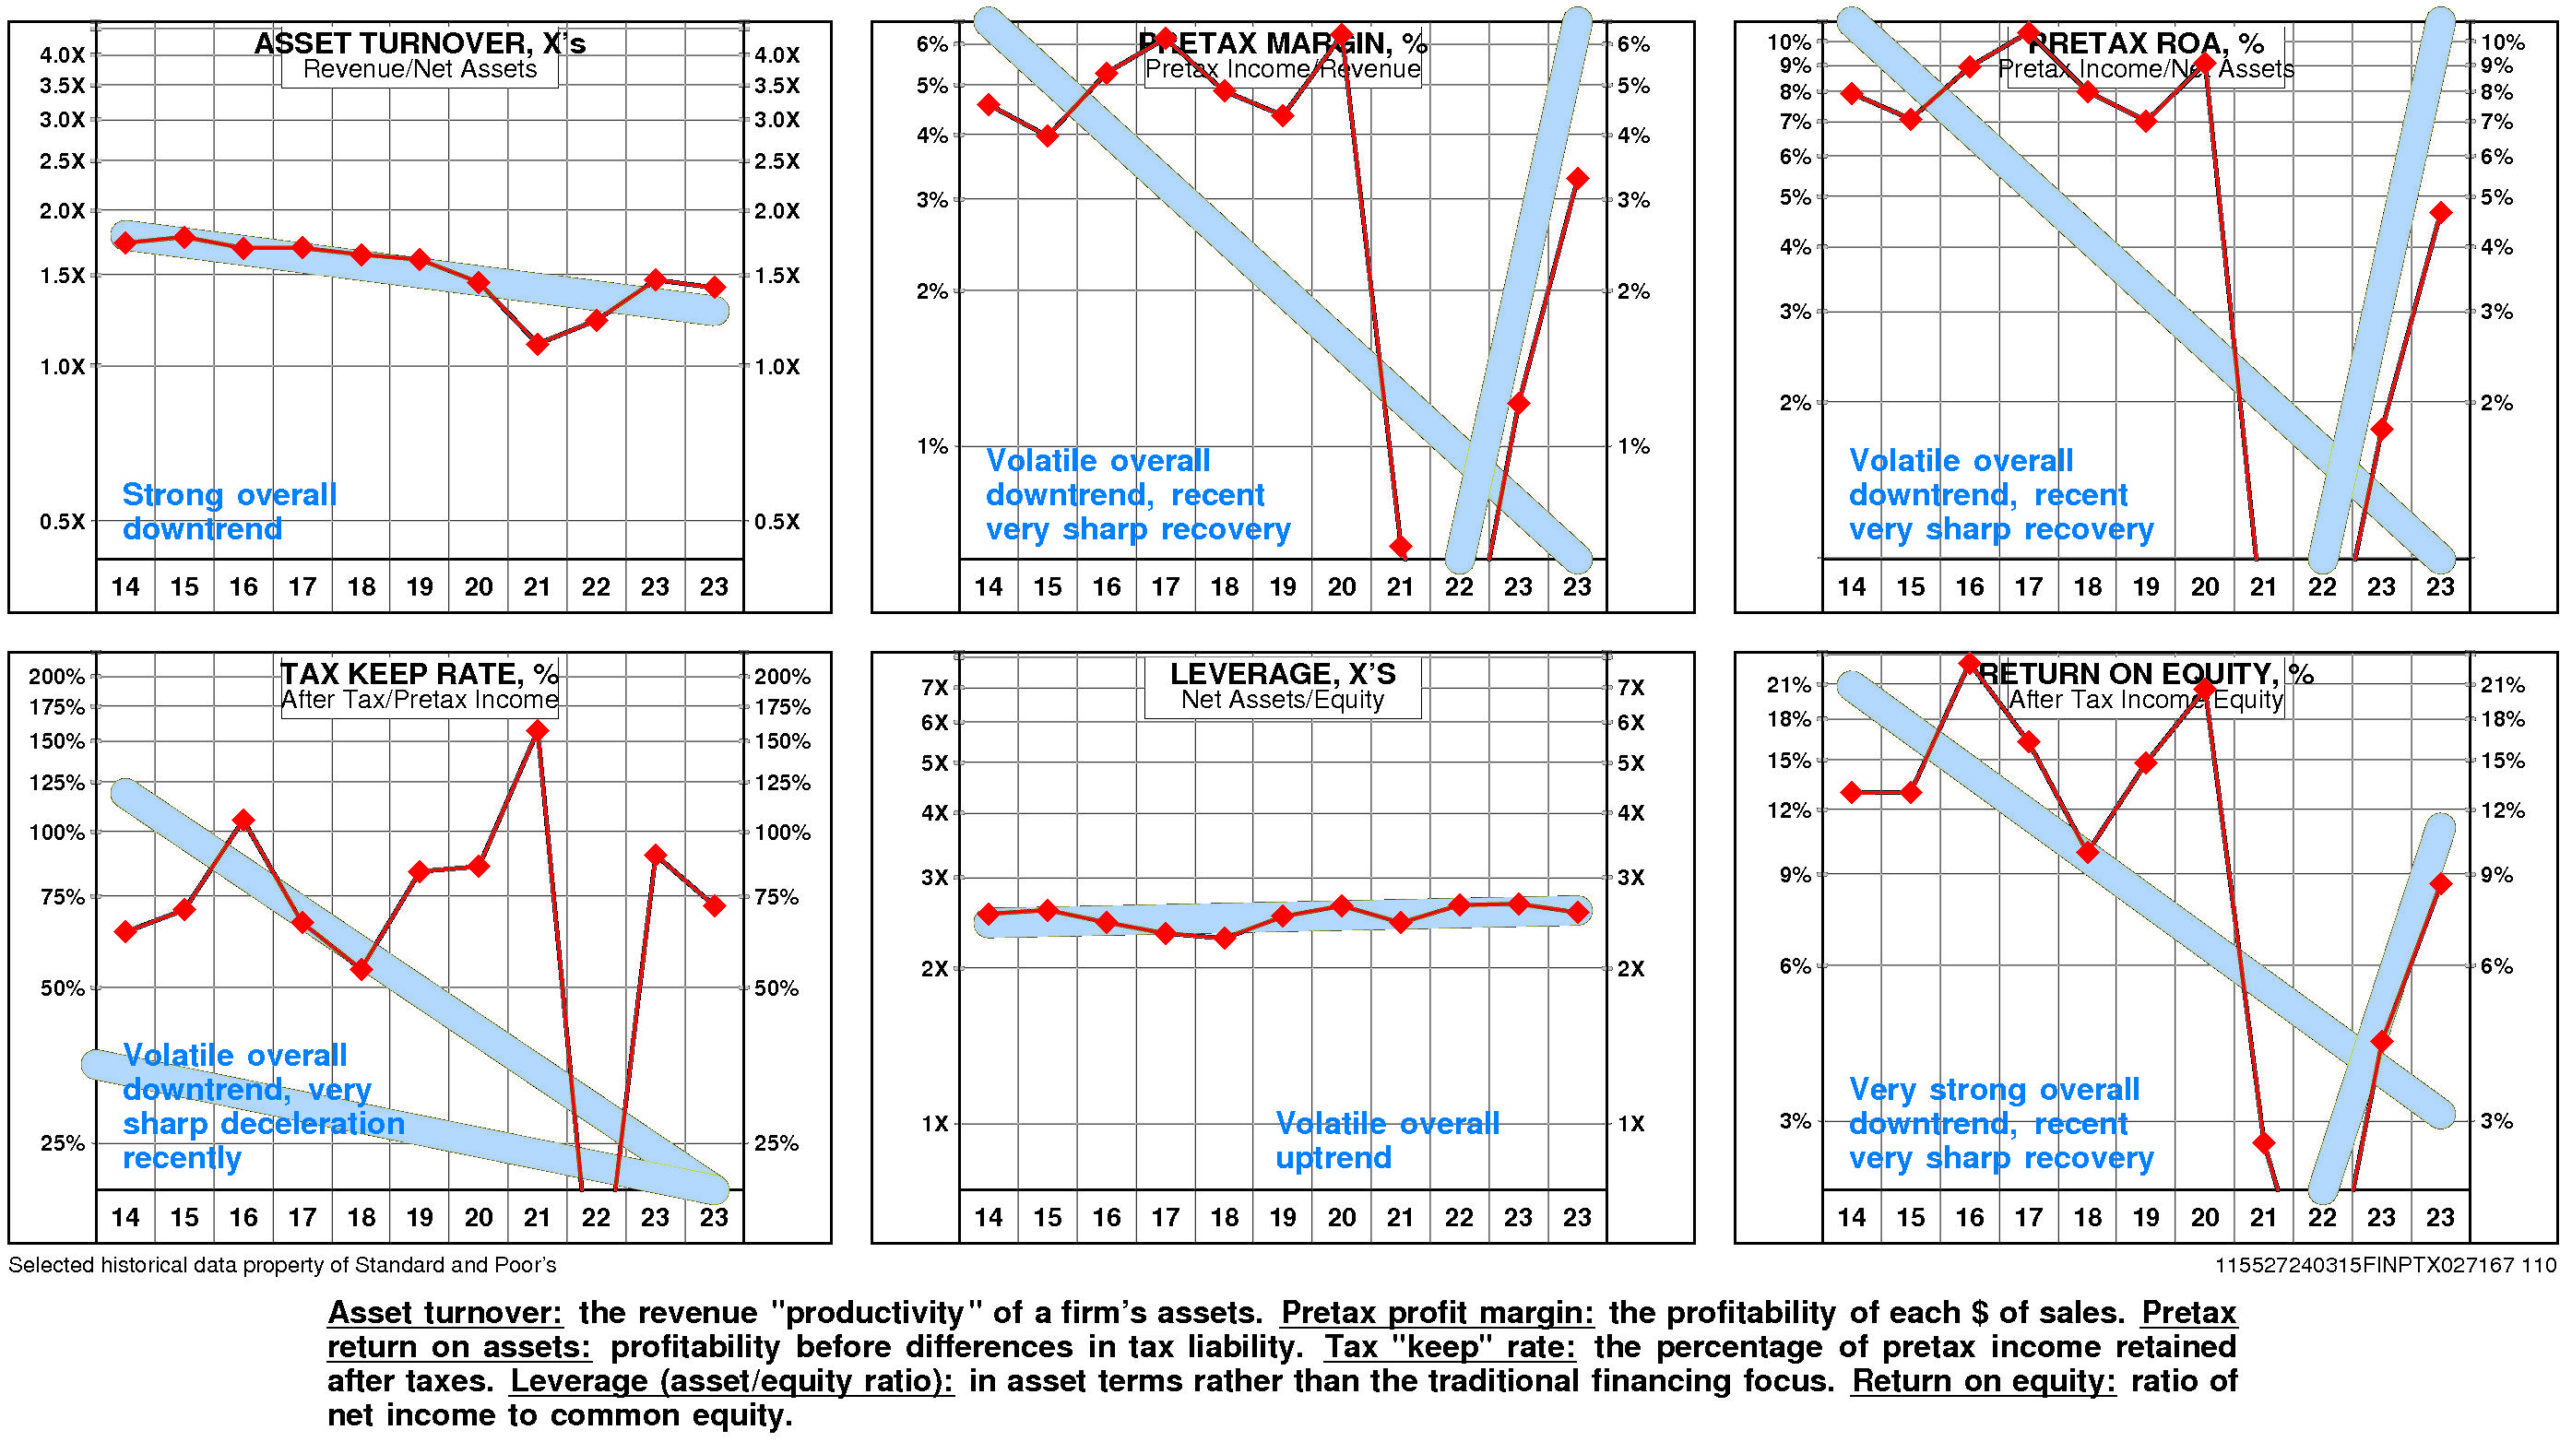
The key to the story for SCS is a very strong negative trend in pretax operating return significantly offset by a very strong positive trend in non-operating factors.
The productivity of Steelcase’s assets declined over the full period 2014-2023: asset turnover has suffered a strong overall downtrend.
Reinforcing this trend, pretax margin experienced a strong overall downtrend even as it experienced a very sharp recovery after the 2022 low.
Non-operating factors (income taxes and financial leverage) had a very significant positive influence on return on equity.
Steelcase’s return on equity is at median (8.6%) for the four quarters ended November, 2023.
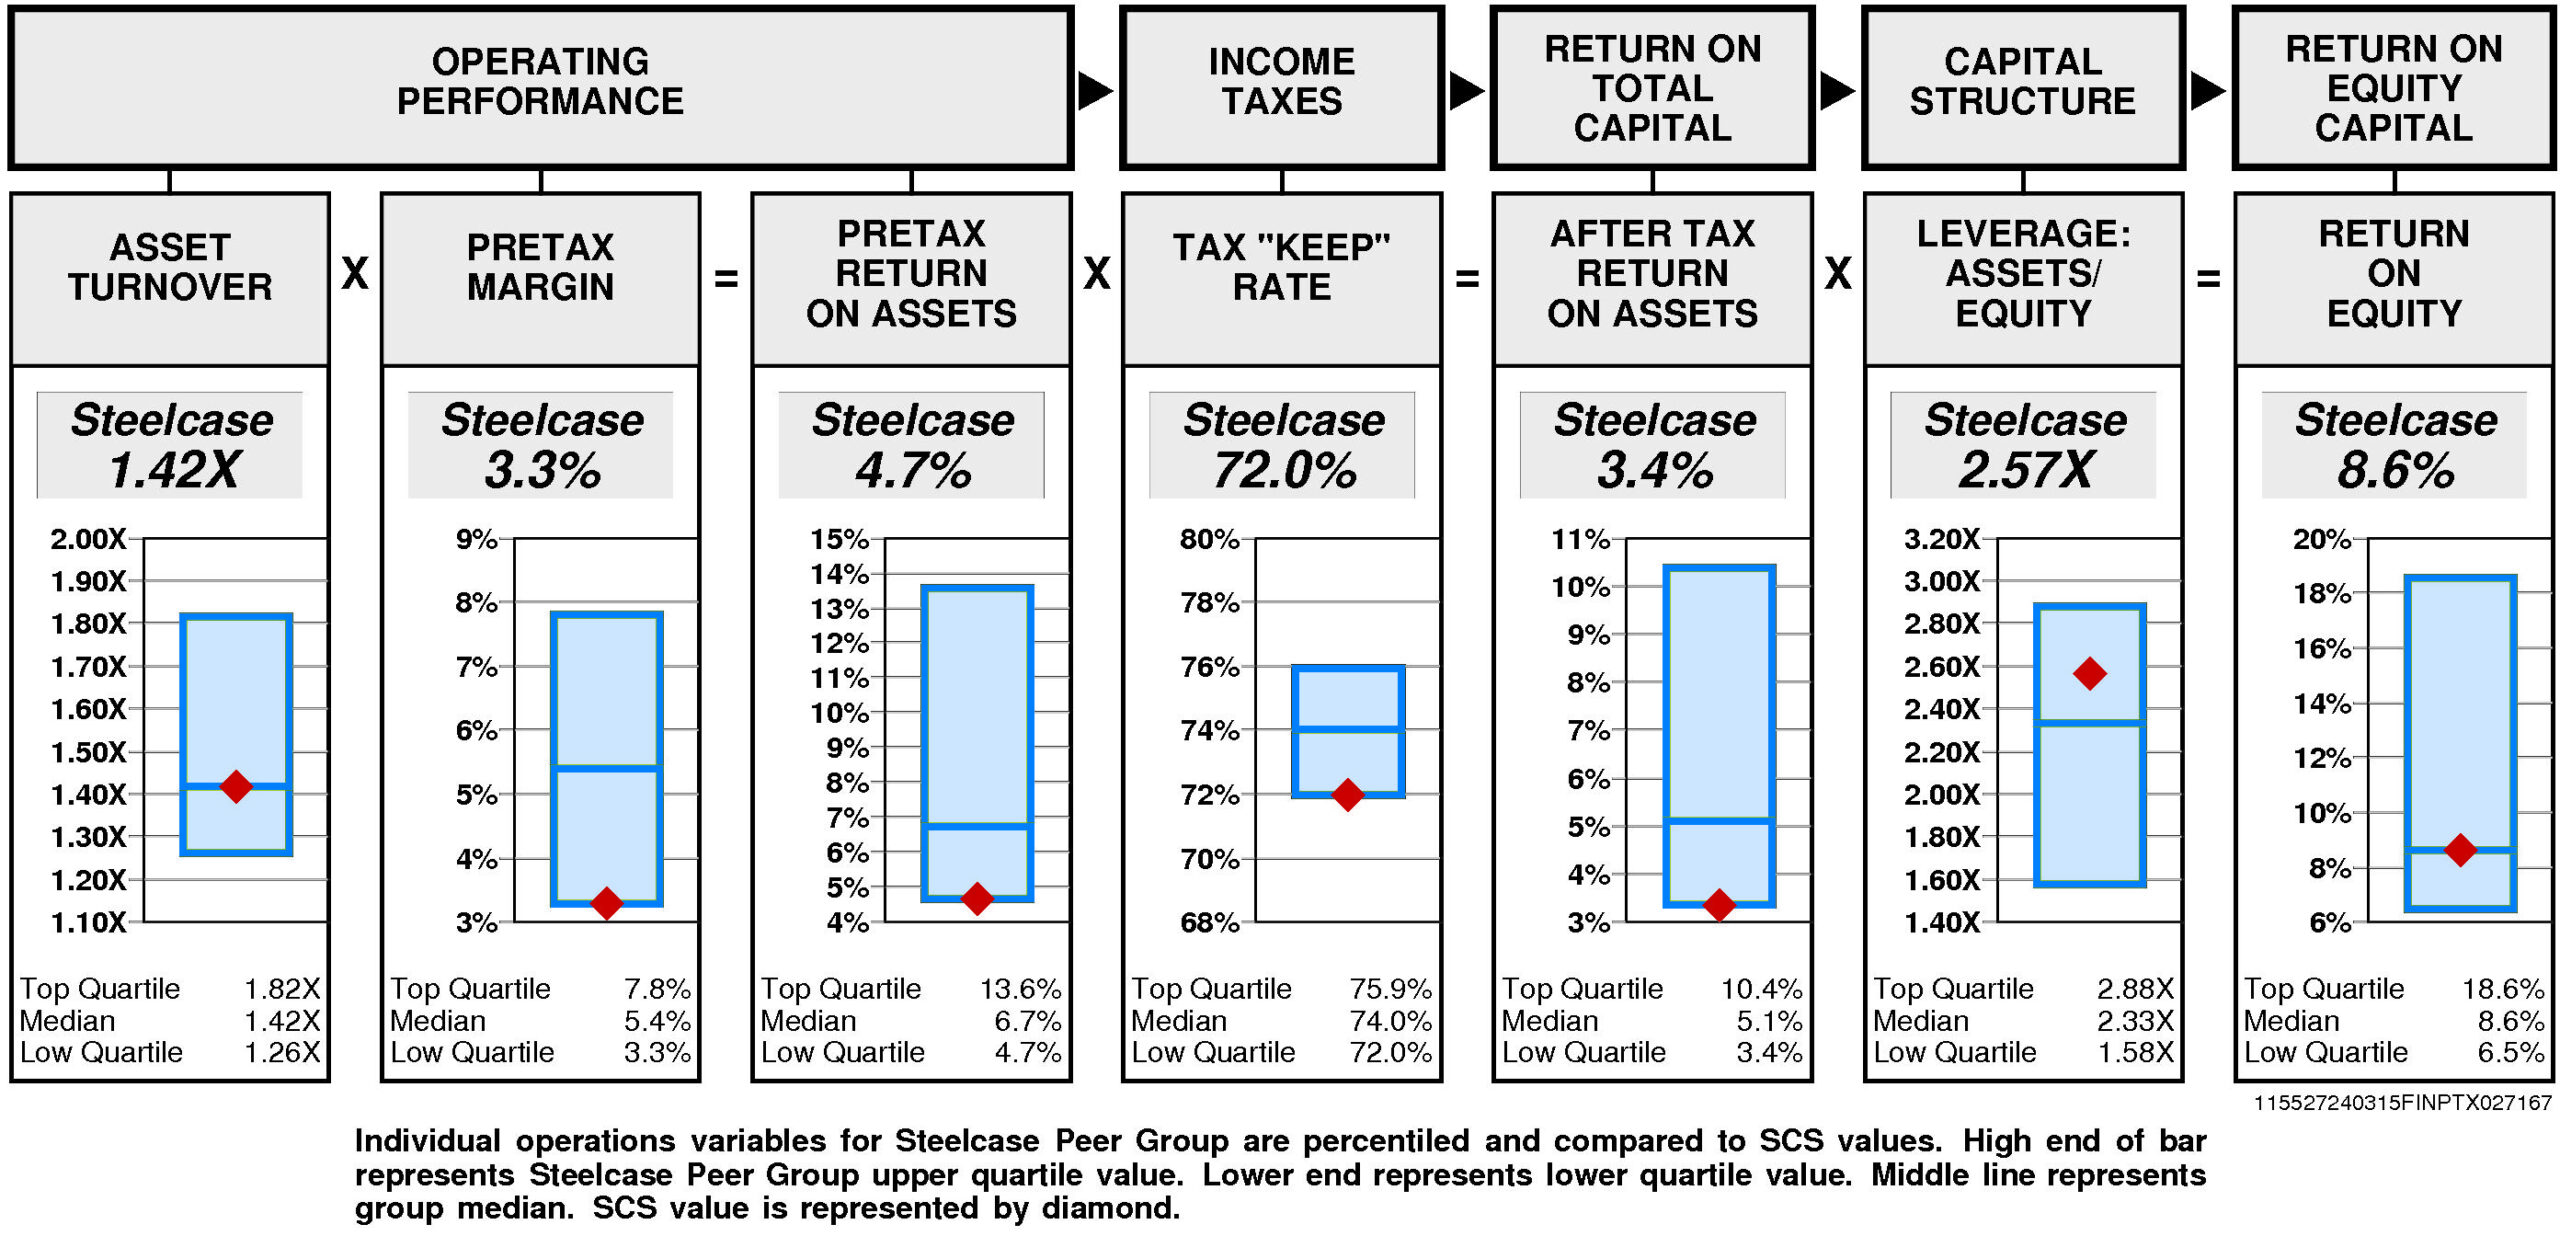
Operating performance (pretax return on assets) is at the lower quartile (4.7%) reflecting asset turnover that is at median (1.42X) and pretax margin at the lower quartile (3.3%).
Tax “keep” rate (income tax management) is at the lower quartile (72.0%) resulting in after tax return on assets that is at the lower quartile.
Financial leverage (leverage) is above median (2.57X).
GROWTH RATES
There are no significant differences between Steelcase’s longer term growth and growth in recent years.
Steelcase’s historical income statement growth and balance sheet growth have diverged. Revenue growth has paralleled asset growth; earnings growth has fallen short of equity growth.
Annual revenue growth has been 1.1% per year.
Total asset growth has been 4.6% per year.
Annual E.P.S. growth has been -13.4% per year.
Equity growth has been 4.0% per year.
Steelcase’s consensus growth rate forecast (average of Wall Street analysts) is 10.0% — substantially above the average of the historical growth measures.
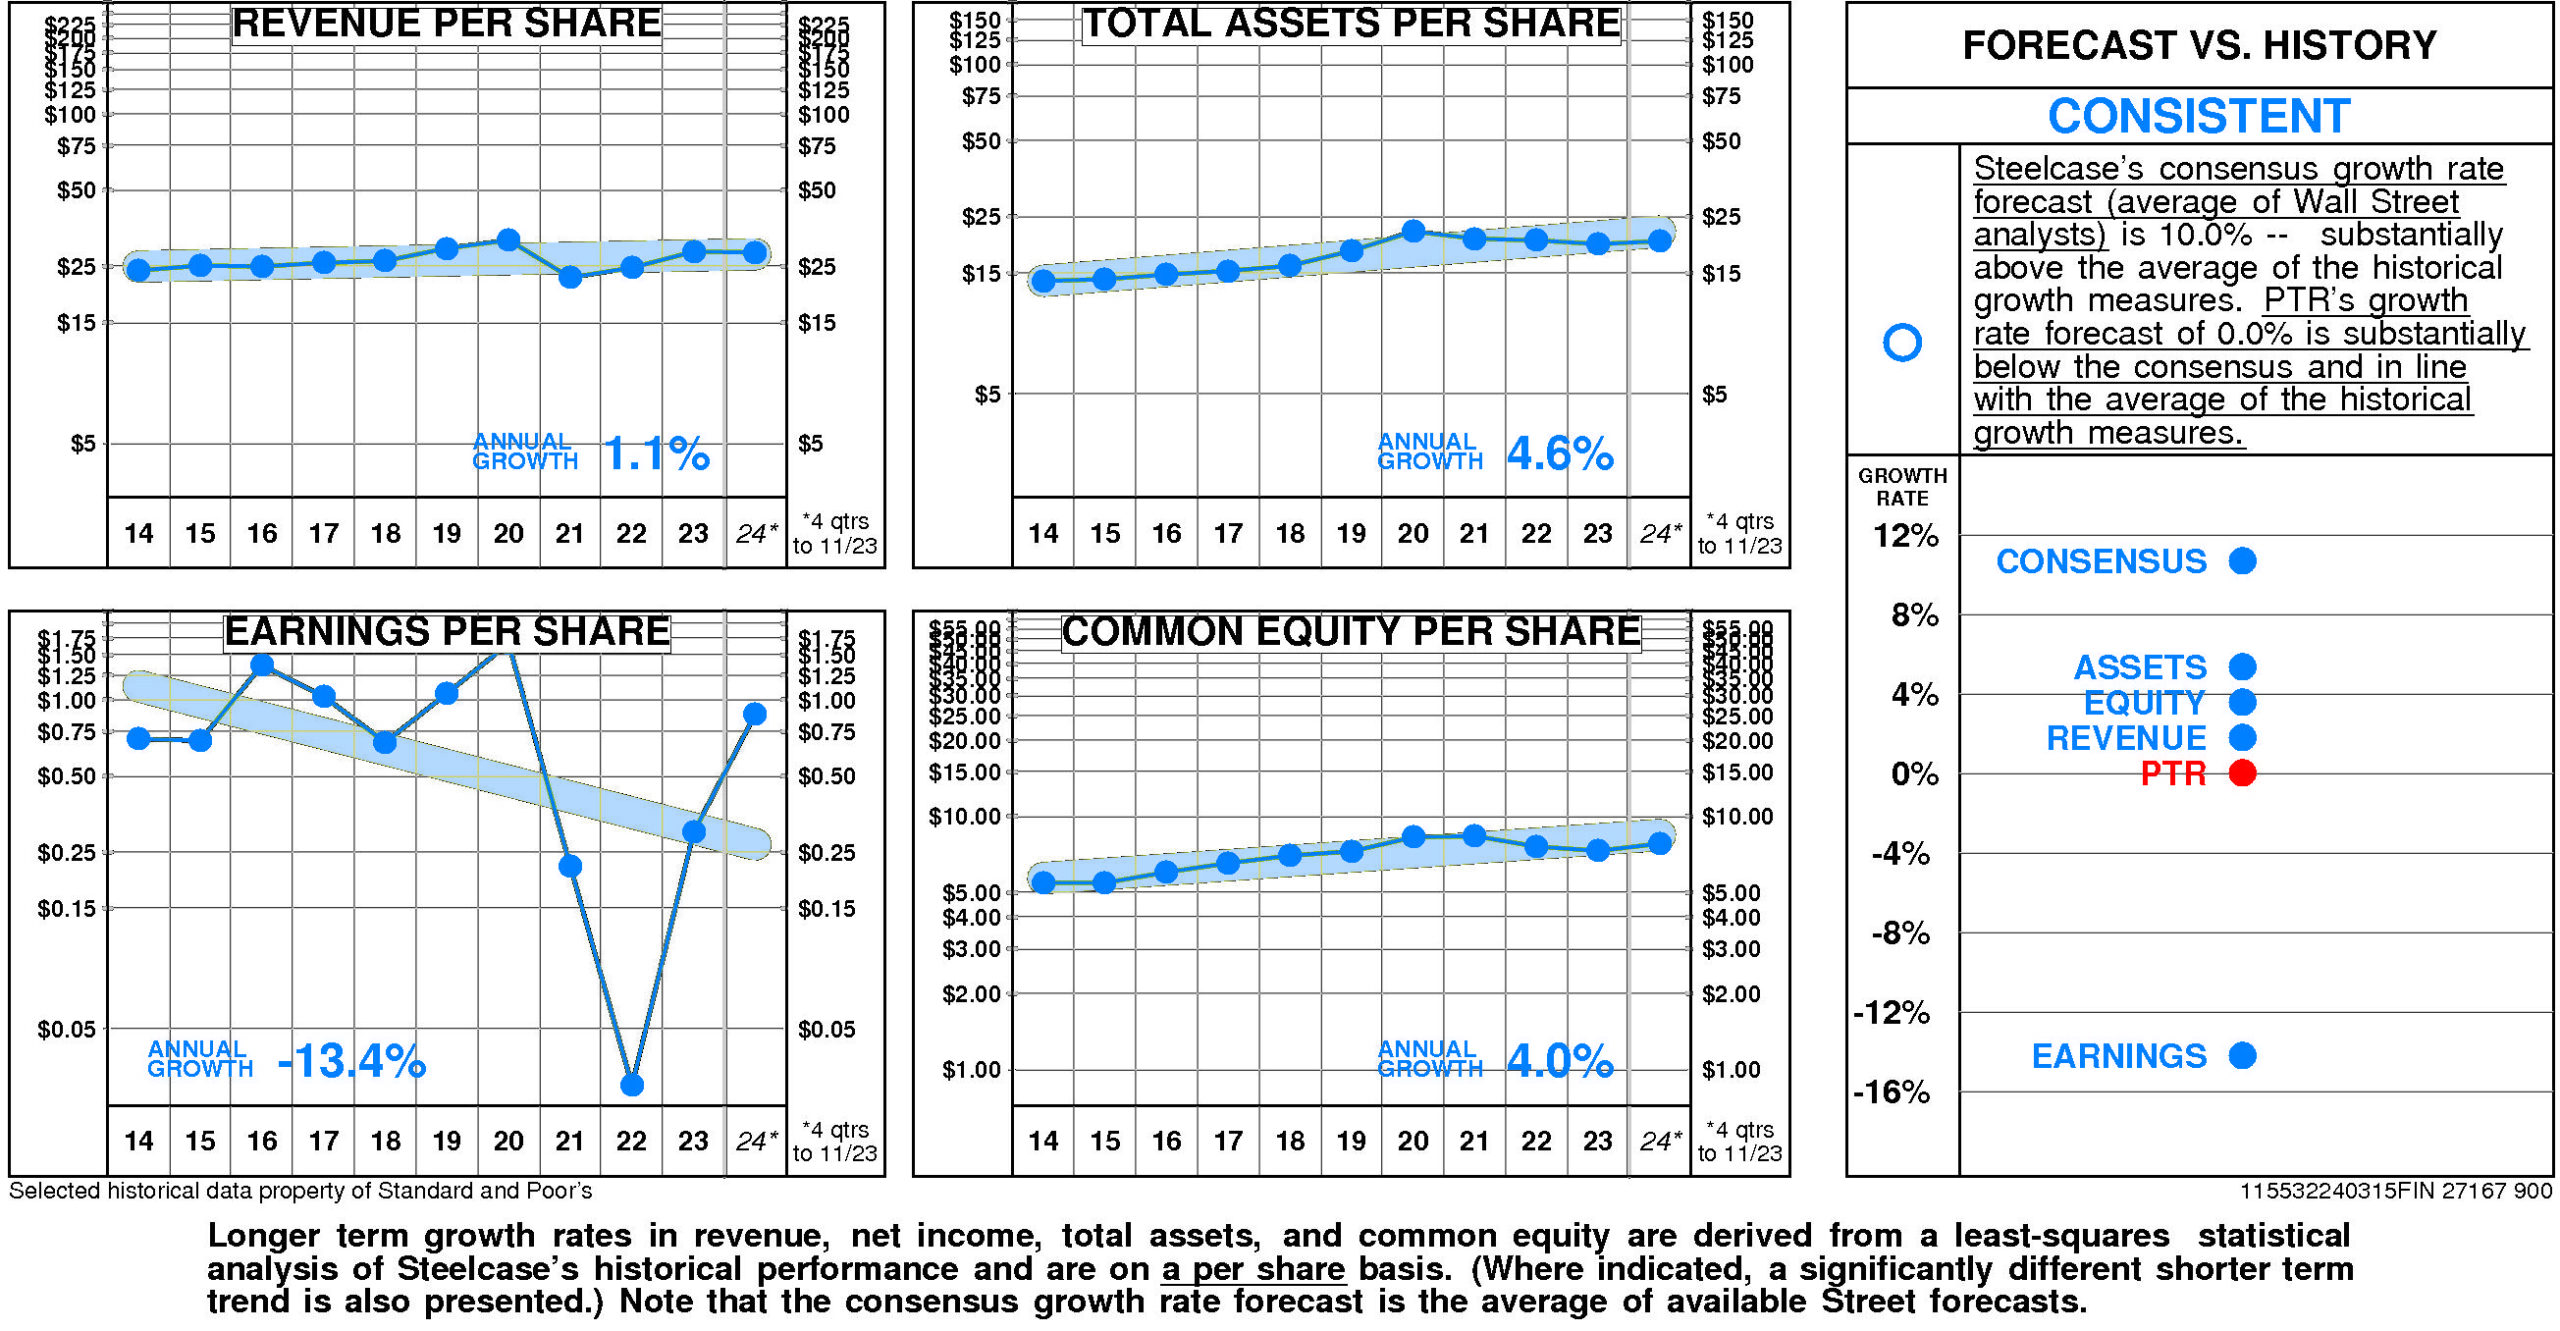
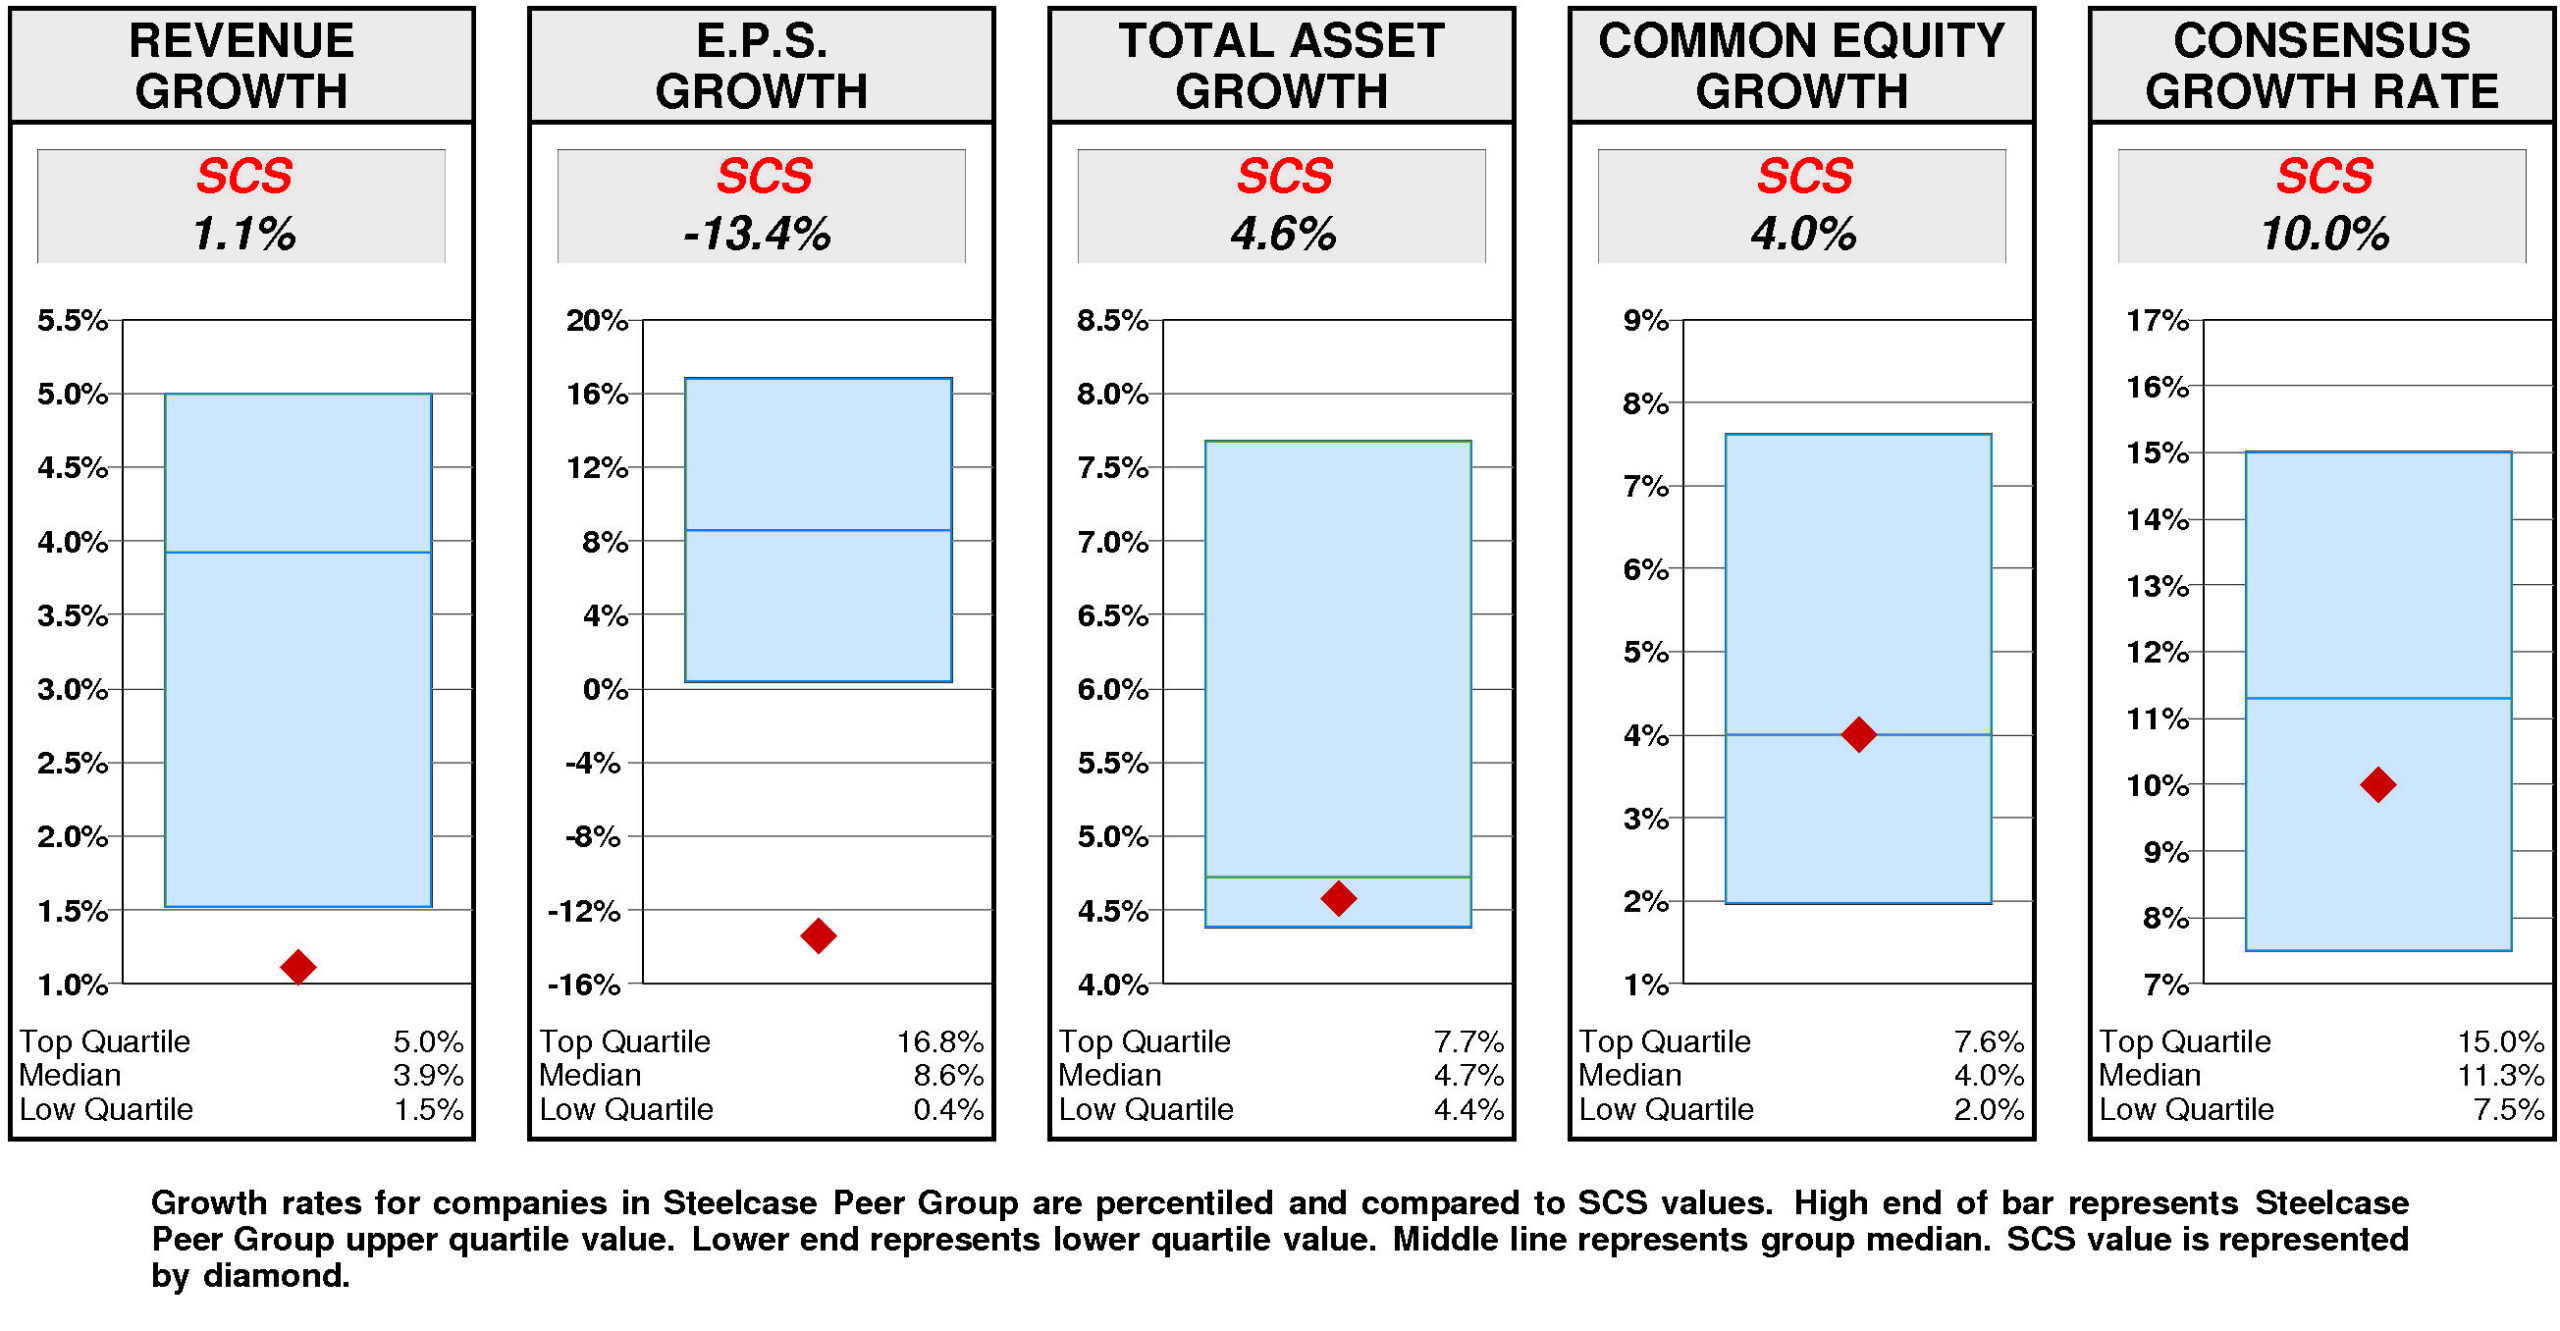
Relative to the Steelcase Peer Group, Steelcase’s historical growth measures are erratic. Equity growth (4.0%) has been at median. Total asset growth (4.6%) has been below median. Revenue growth (1.1%) has been lower quartile. E.P.S. growth (-13.4%) has been lower quartile.
Consensus growth forecast (10.0%) is below median.
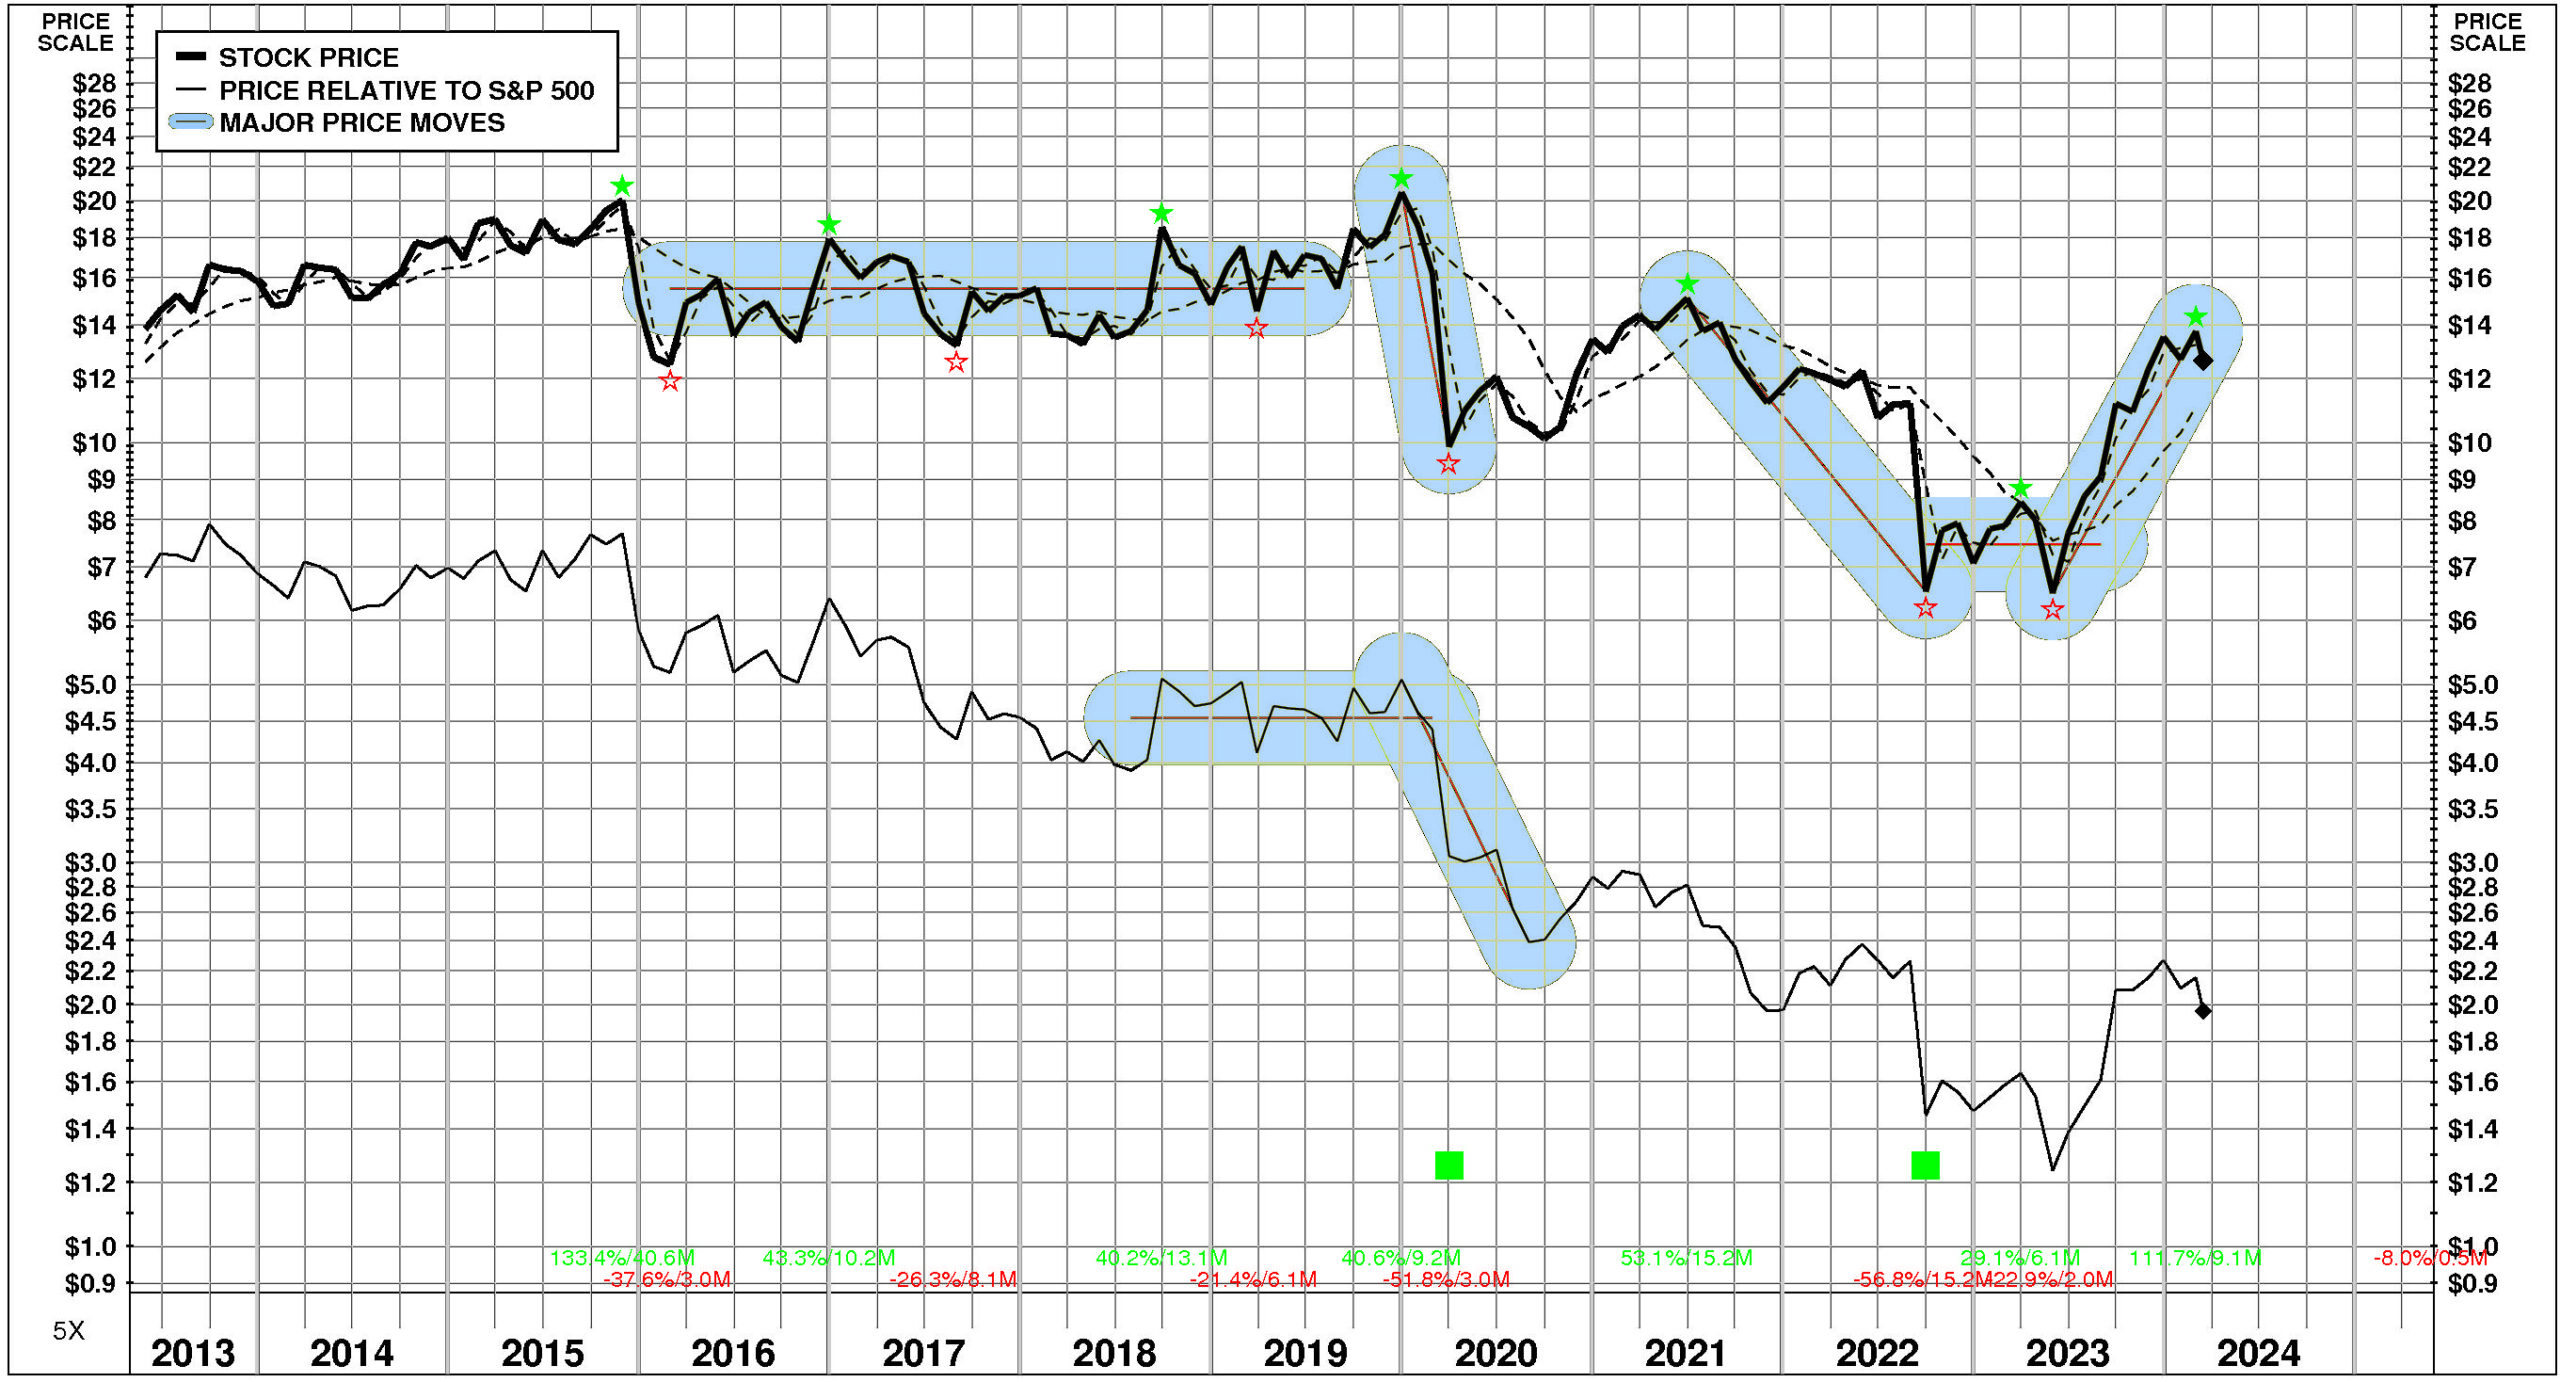
PRICE HISTORY
Over the full time period, Steelcase’s stock price performance has been variable and significantly below market. Between May, 2013 and March, 2024, Steelcase’s stock price fell -9%; relative to the market, this was a -71% loss. Significant price moves during the period: 1) May, 2023 – February, 2024: +112%; 2) June, 2021 – September, 2022: -57%; and 3) December, 2019 – March, 2020: -52%.
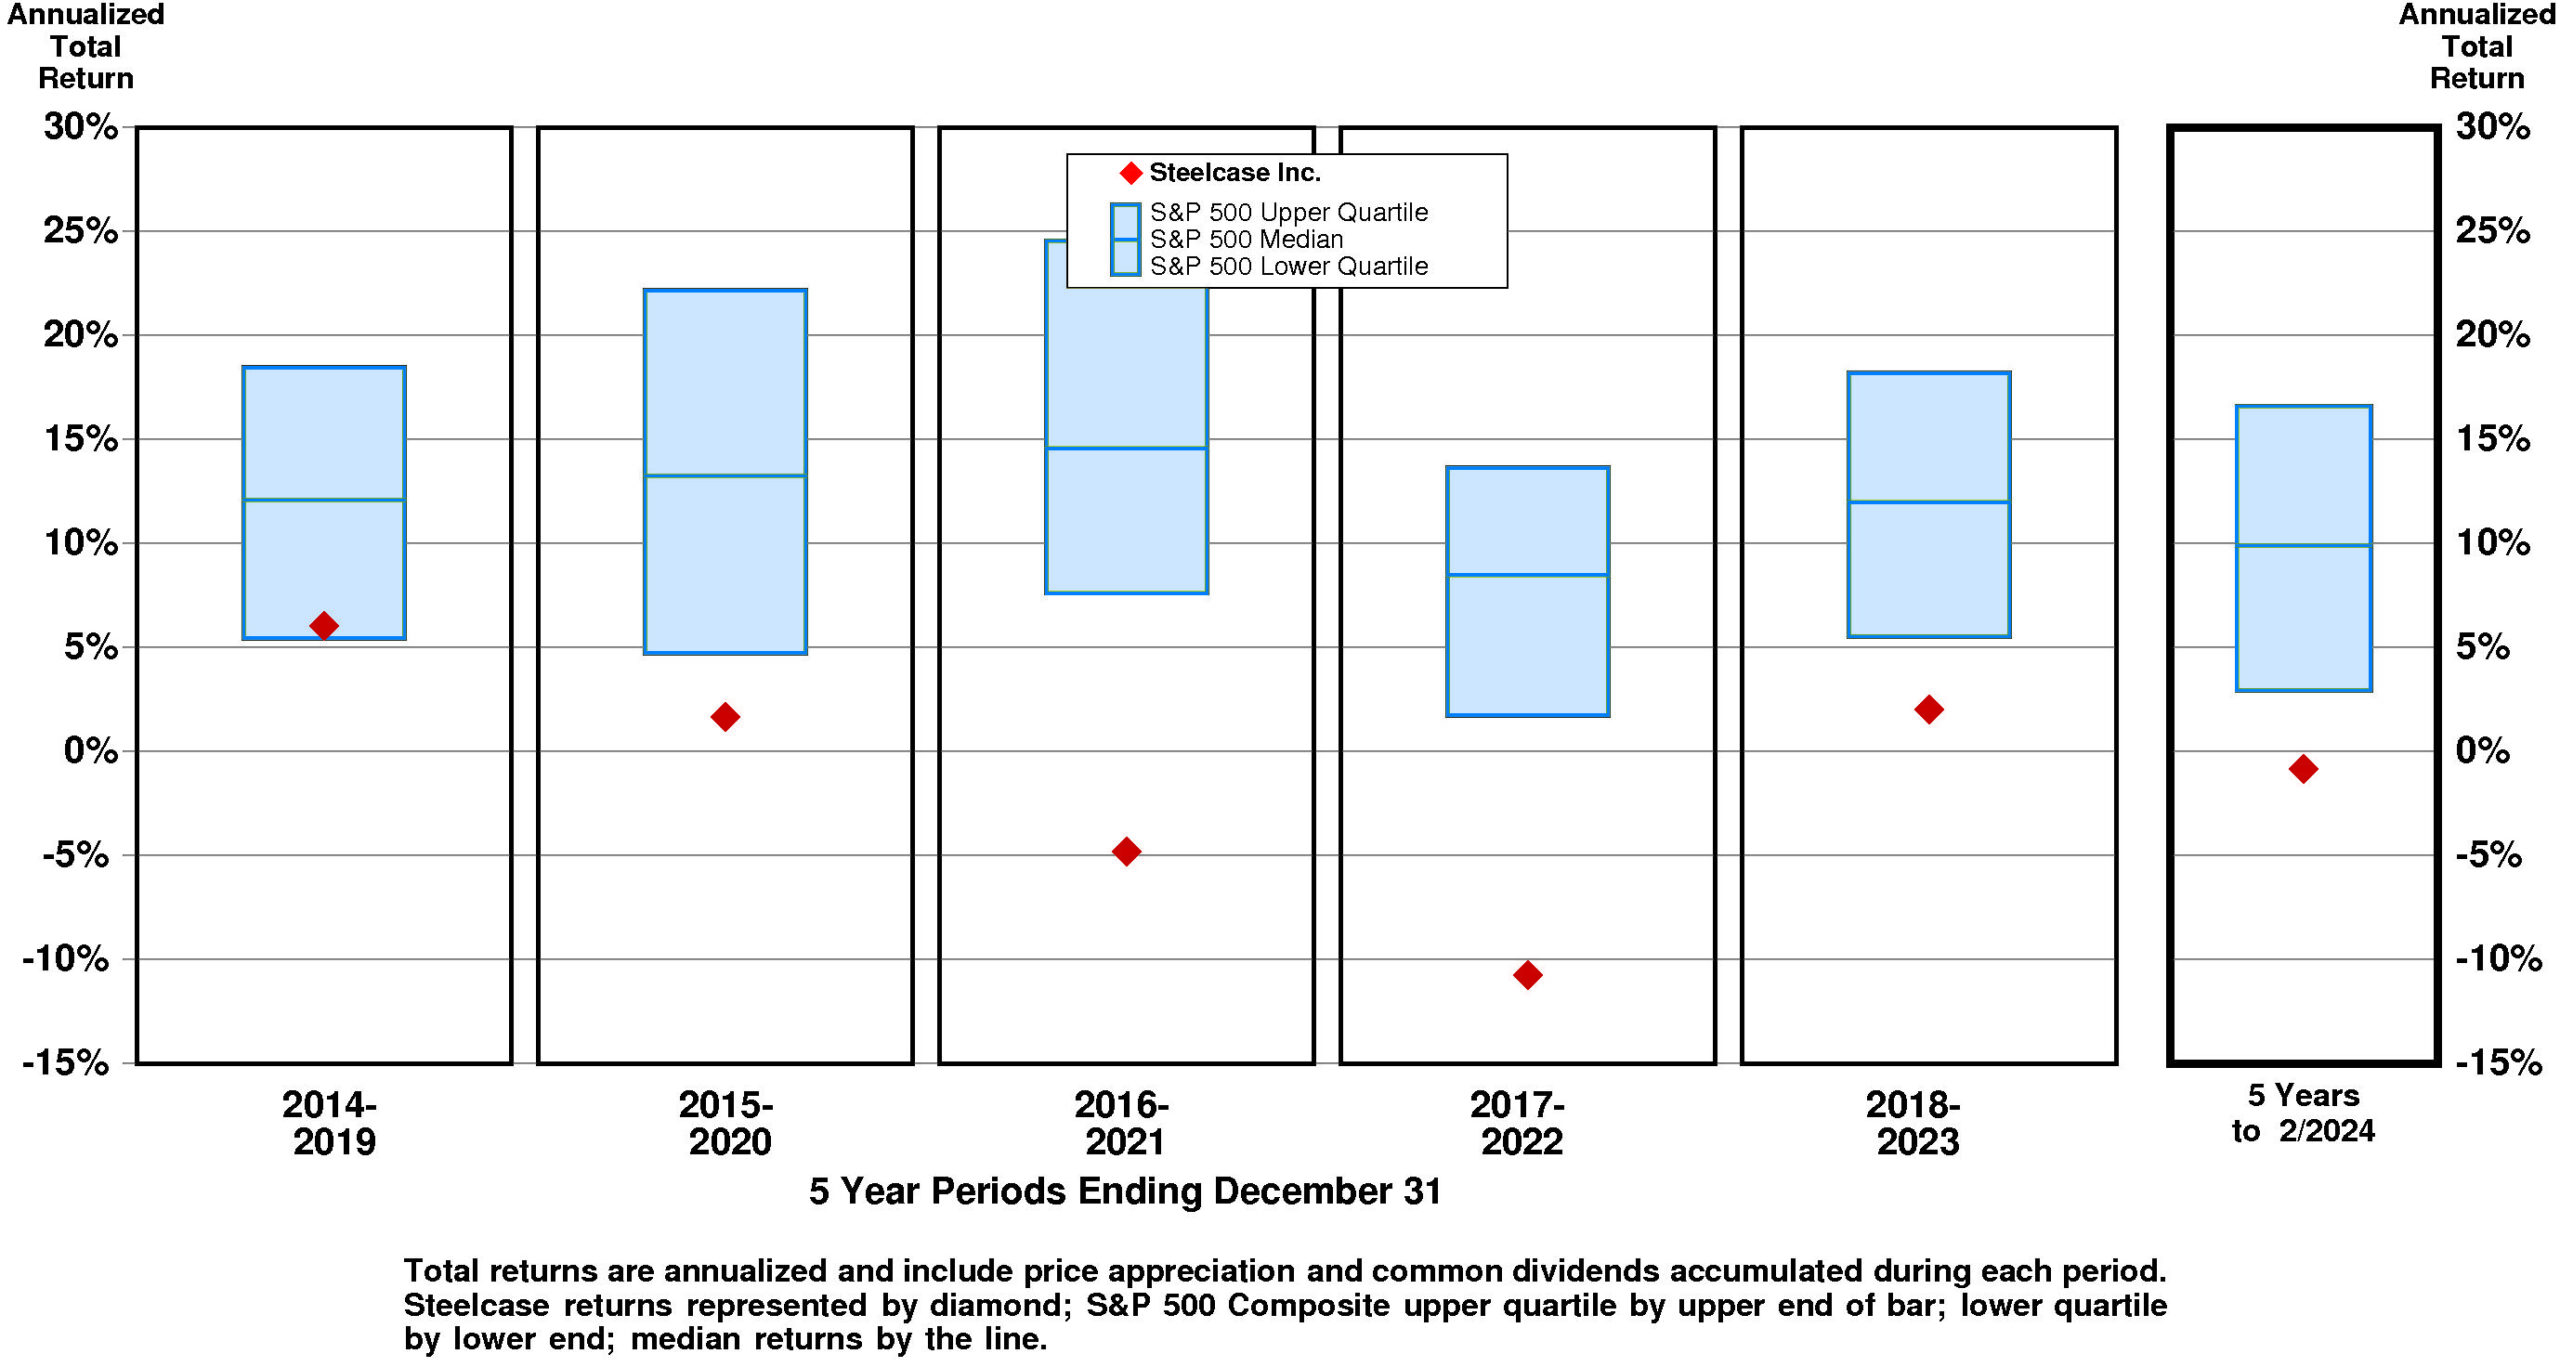
TOTAL INVESTMENT RETURNS
Current annual total return performance of 81.9% is upper quartile relative to the S&P 500 Composite.
In addition to being upper quartile relative to S&P 500 Composite, current annual total return performance through February, 2024 of 81.9% is upper quartile relative to Steelcase Inc. Peer Group.
Current 5-year total return performance of -0.8% is lower quartile relative to the S&P 500 Composite.
Through February, 2024, with lower quartile current 5-year total return of -0.8% relative to S&P 500 Composite, Steelcase’s total return performance is lower quartile relative to Steelcase Inc. Peer Group.
VALUATION BENCHMARKS
Relative to S&P 500 Composite, SCS’ overall valuation is quite low. Four of five factors are lower quartile. The highest factor is the ratio of enterprise value/earnings before interest and taxes, followed by the price/earnings ratio, then by the ratio of enterprise value/assets, then by the price/equity ratio. The lowest factor, ratio of enterprise value/revenue, is lower quartile.
Relative to Steelcase Peer Group, SCS’ overall valuation is low. The highest factor, the price/earnings ratio, is near the upper quartile. Ratio of enterprise value/earnings before interest and taxes is slightly above median. Price/equity ratio is below median. Ratio of enterprise value/revenue is lower quartile. The lowest factor, the ratio of enterprise value/assets, is at the lower quartile.
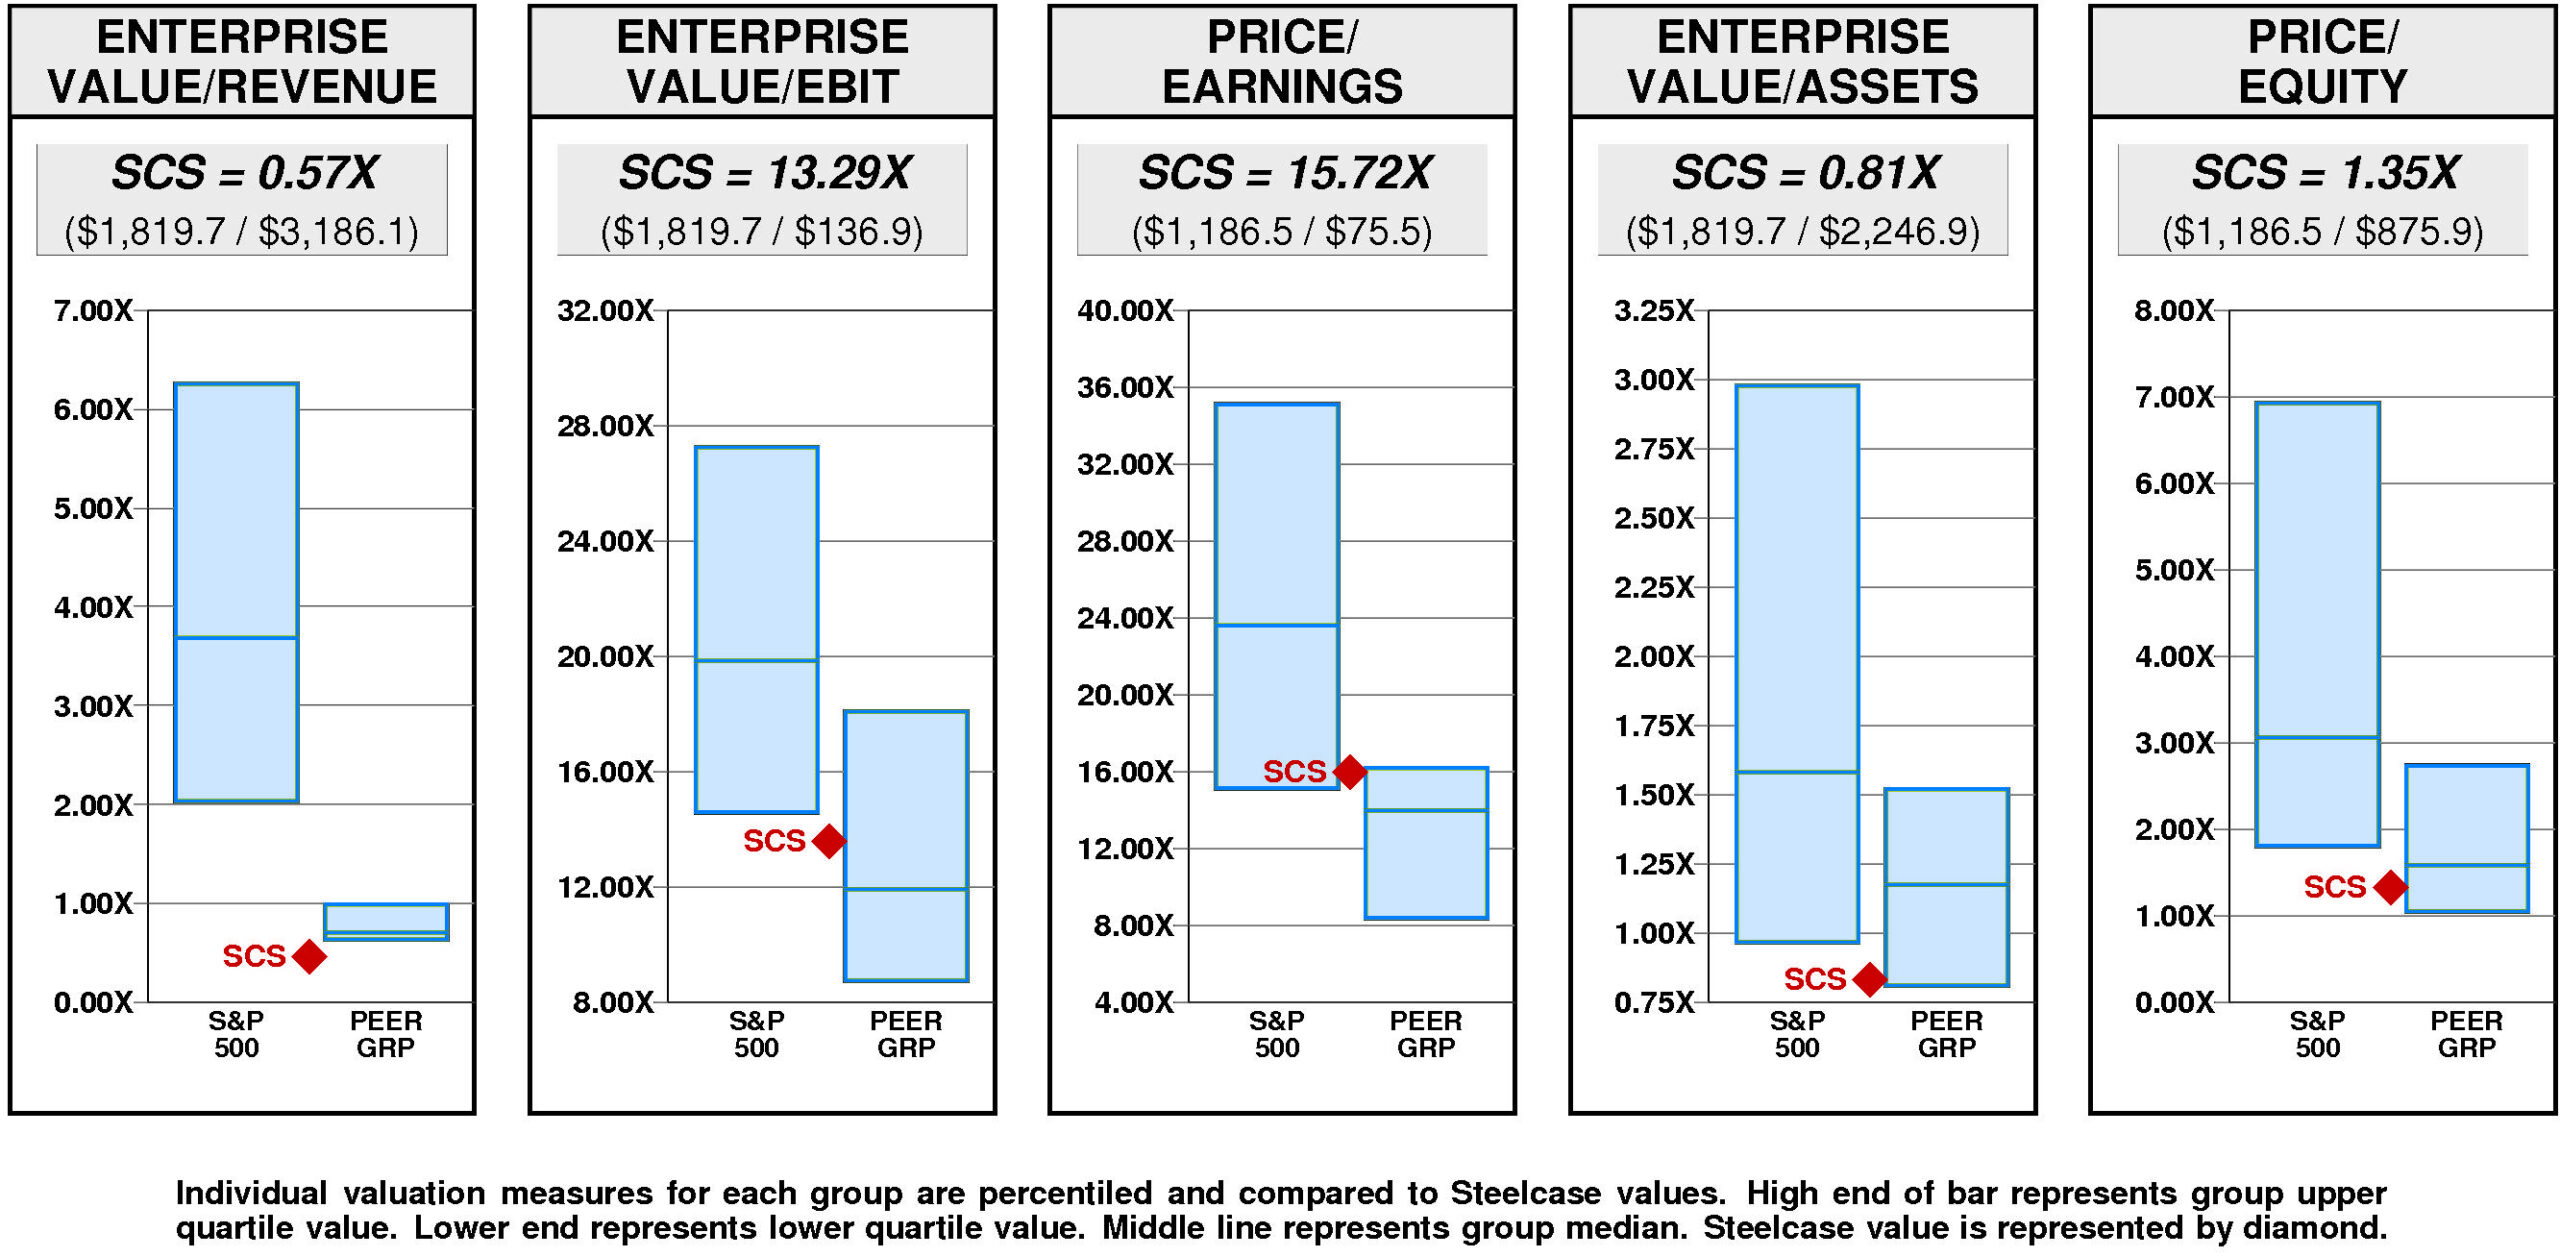
Steelcase has a major value gap compared to the median. For SCS to hit median valuation, its current ratio of enterprise value/revenue would have to rise from the current level of 0.57X to 0.70X. If SCS’ ratio of enterprise value/revenue were to rise to 0.70X, its stock price would be higher by $5 to $17.
For SCS to achieve upper quartile valuation relative to the Steelcase Peer Group, its current ratio of enterprise value/revenue would have to rise from the current level of 0.57X to 0.99X. If SCS’ ratio of enterprise value/revenue were to rise to 0.99X, its stock price would increase by $14 from the current level of $13.
VALUE TARGETS
Reflecting future returns on capital that are forecasted to be above the cost of capital, SCS is expected to continue to be an important Value Builder.
Steelcase’s current Price Target of $13 is little changed from the current price of $12.64.
This moderately low appreciation potential results in an appreciation score of 35 (65% of the universe has greater appreciation potential.)
Notwithstanding this moderately low Appreciation Score of 35, the high Power Rating of 99 results in an Value Trend Rating of B.
Steelcase’s current Price Target is $13 (+9% from the 2023 Target of $12 and +1% from the 03/14/24 price of $12.64). This slight rise in the Target is the result of a -3% decrease in the equity base and a +13% increase in the price/equity multiple. The forecasted increase in cost of equity has a very large negative impact on the price/equity multiple and the forecasted decline in growth has a large negative impact as well. More than offsetting these Drivers, the forecasted increase in return on equity has a huge positive impact.
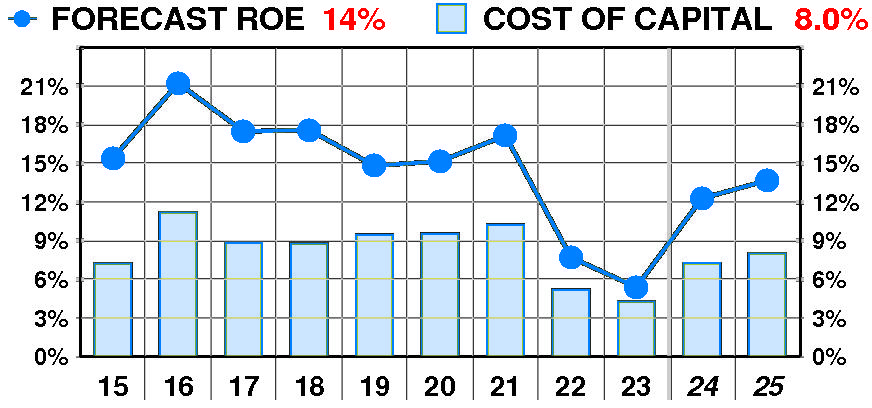
PTR’s return on equity forecast is 13.7% — above our recent forecasts. Forecasted return on equity suffered a dramatic, erratic decline between 2015 and 2023. The current forecast is well below the 2016 peak of 21%.
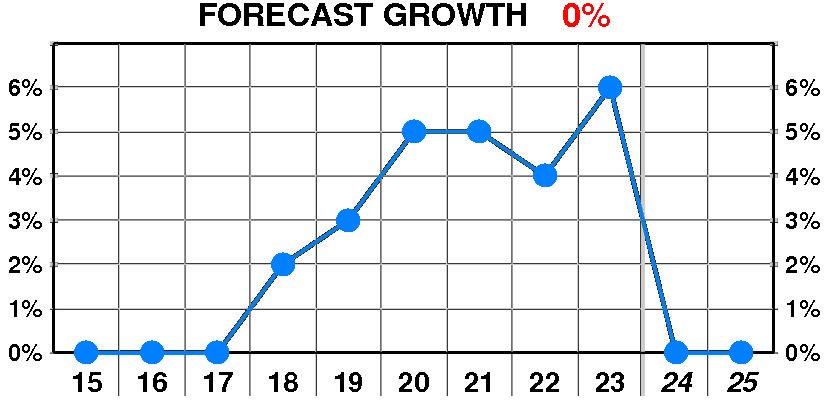
PTR’s growth forecast is 0.0% — below our recent forecasts. Forecasted growth enjoyed a dramatic, variable increase between 2018 and 2023. The current forecast is well below the 2021 peak of 5%.
PTR’s cost of equity forecast is 8.0% — slightly above recent levels. Forecasted cost of equity enjoyed a dramatic, erratic decline between 2015 and 2023. The current forecast is below the 2016 peak of 11.2%.
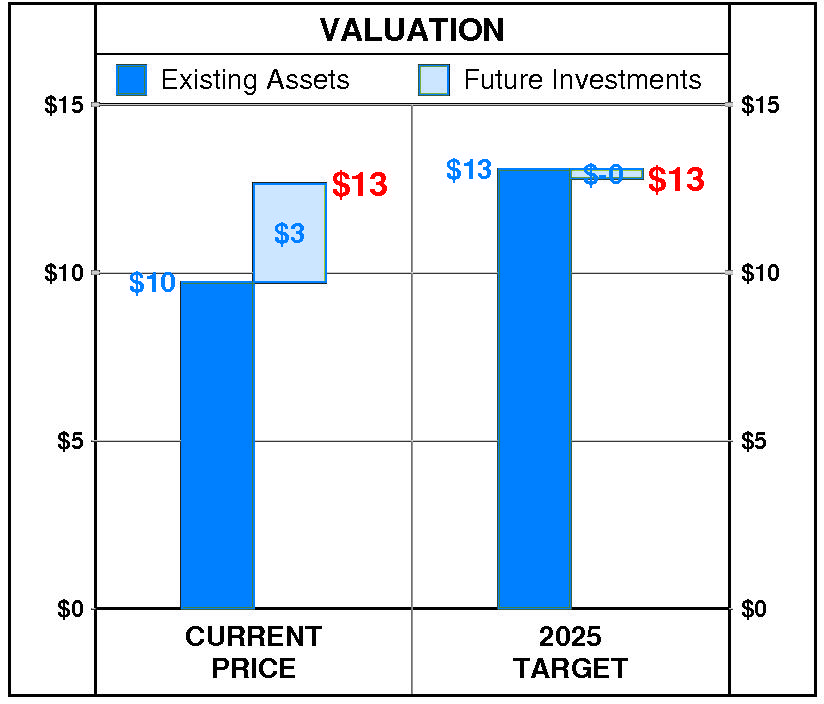
At Steelcase’s current price of $12.64, investors are placing a positive value of $3 on its future investments. This view is consistent with the company’s most recent performance that reflected a growth rate of 6.0% per year, and a return on equity of 5.4% versus a cost of equity of 4.3%.
PTR’s 2025 Price Target of $13 is based on these forecasts and reflects an estimated value of existing assets of $13 and a value of future investments of $-0.
Be the first to comment