![]()
BUSINESS
Surmodics, Inc., together with its subsidiaries, provides performance coating technologies for intravascular medical devices, and chemical and biological components for in vitro diagnostic immunoassay tests and microarrays in the United States and internationally. It operates in two segments, Medical Device and In Vitro Diagnostics (IVD).
INVESTMENT RATING
SRDX’s future returns on capital are forecasted to be in line with the cost of capital. Accordingly, the company is expected to continue to be Value Creation neutral.
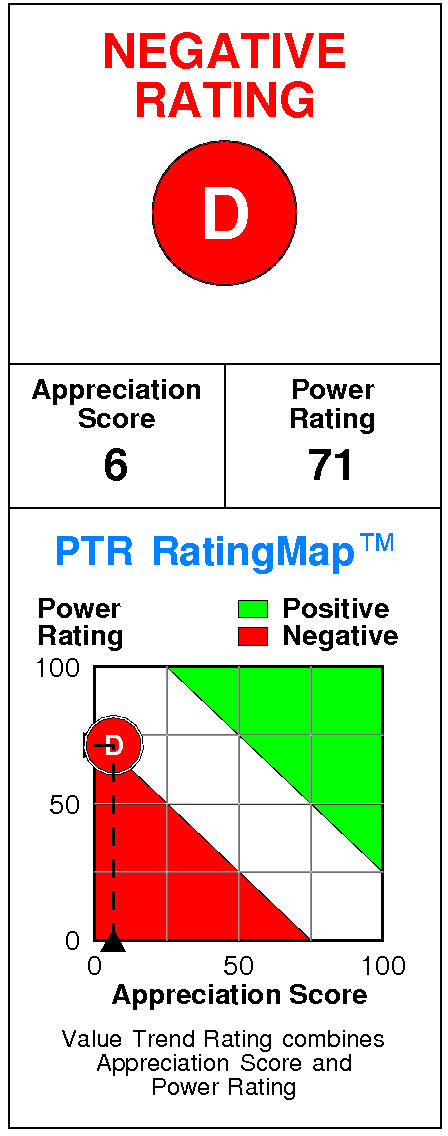
Surmodics has a current Value Trend Rating of D (Negative).
With this rating, PTR’s two proprietary measures of a stock’s current attractiveness are providing very contradictory signals. Surmodics has a very low Appreciation Score of 6 but a good Power Rating of 71, and the Negative Value Trend Rating results.
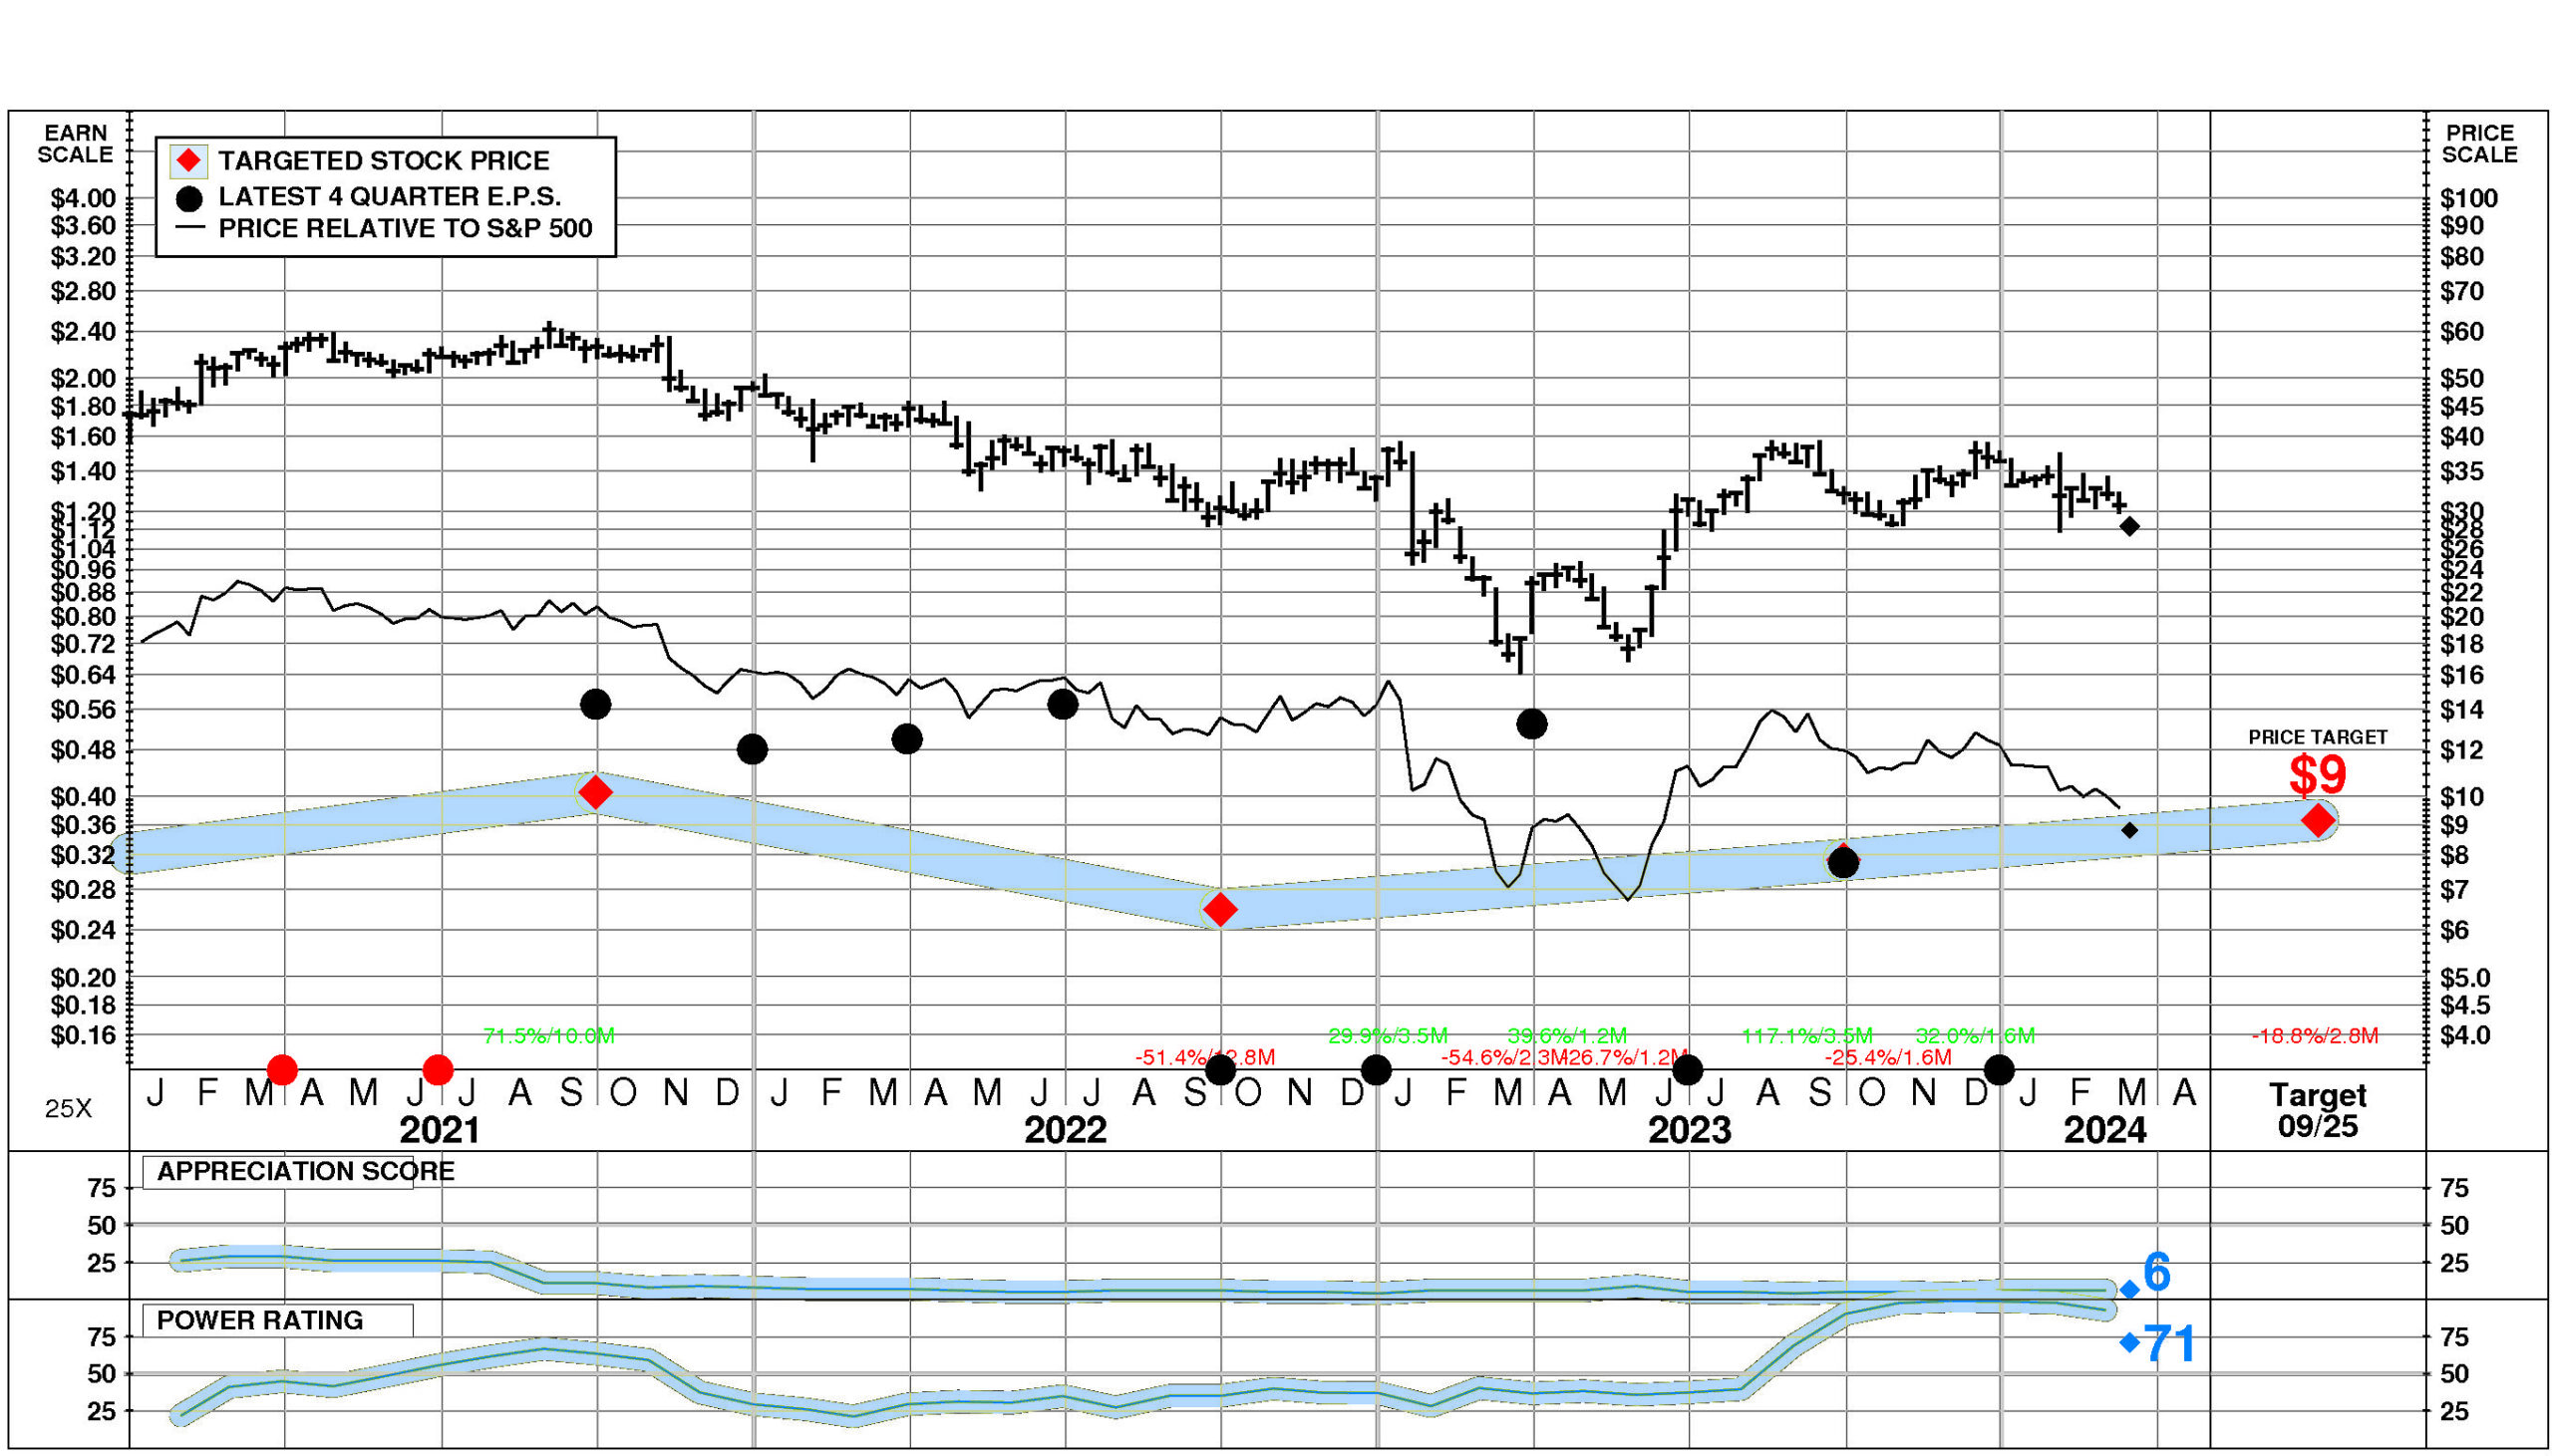
Surmodics’ stock is selling significantly above targeted value. The current stock price of $28.31 compares to targeted value 12 months forward of $9.
Surmodics’ very low appreciation potential results in an appreciation score of 6 (94% of the universe has greater appreciation potential.)
Surmodics has a Power Rating of 71. (SRDX’s good Power Rating indicates that it has a higher likelihood of achieving favorable investment performance over the near to intermediate term than all but 29% of companies in the universe.)
Factors contributing to this good Power Rating include: the recent trend in SRDX’s earnings estimates has been extremely favorable; and recent price action has been slightly favorable. An offsetting factor is the Patent Owners and Lessors comparison group is in a slightly weakened position currently.
INVESTMENT PROFILE
Surmodics’ financial strength is above average. Financial strength rating is 63.
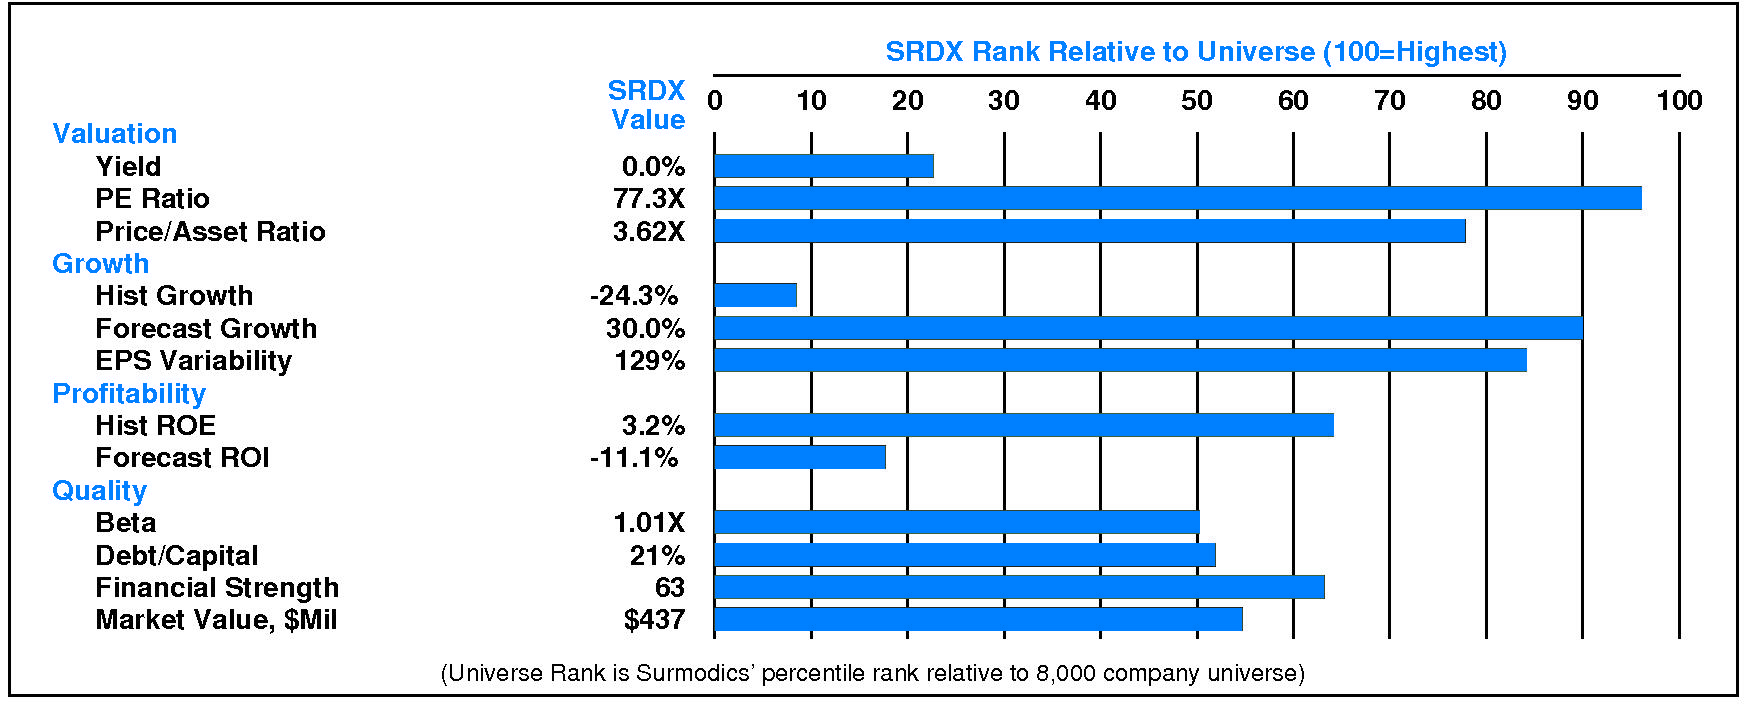
Relative to the S&P 500 Composite, Surmodics Inc has slightly more Value than Growth characteristics; its appeal is likely to be to Capital Gain-oriented investors; the perception is that SRDX is normal risk. Relative weaknesses include: low historical profitability, low historical growth, and high earnings variability. Surmodics’ valuation is high: low dividend yield, high P/E ratio, and moderate price/book ratio. SRDX has unusually low market capitalization.
CURRENT SIGNALS
Surmodics’ current operations are eroding. Return on equity is falling, reflecting: and falling tax keep rate.
Surmodics’ current technical position is mixed. The stock price is in a 2.8 month down move. The stock has declined 15.8% from its prior high. The 200 day moving average is in an uptrend. The stock price is below its 200 day moving average.
ALERTS
Important negative changes in Surmodics Inc (NASDAQ: SRDX) investment behavior have recently occurred: negative upside/downside volume developed.
Positive development: significant quarterly sales acceleration occurred. Negative development: significant quarterly earnings deceleration occurred.
The stock is currently rated D.
Surmodics Inc (NASDAQ: SRDX) stock closed at $28.31 on 3/14/24 after a decline of -2.3%. NORMAL trading volume accompanied the decline. The stock has declined -5.0% during the last week but has been strong relative to the market over the last nine months.
CASH FLOW
In 2023, Surmodics generated a very significant increase in cash of +$26.35 million (+139%). Sources of cash were much larger than uses. Cash generated from 2023 EBITDA totaled +$14.12 million. Non-operating sources contributed +$0.37 million (+3% of EBITDA). Cash taxes consumed -$4.05 million (-29% of EBITDA). Re-investment in the business amounted to -$12.11 million (-86% of EBITDA). On a net basis, debt investors provided +$14.96 million (+106% of EBITDA) while equity investors furnished +$13.05 million (+92% of EBITDA).
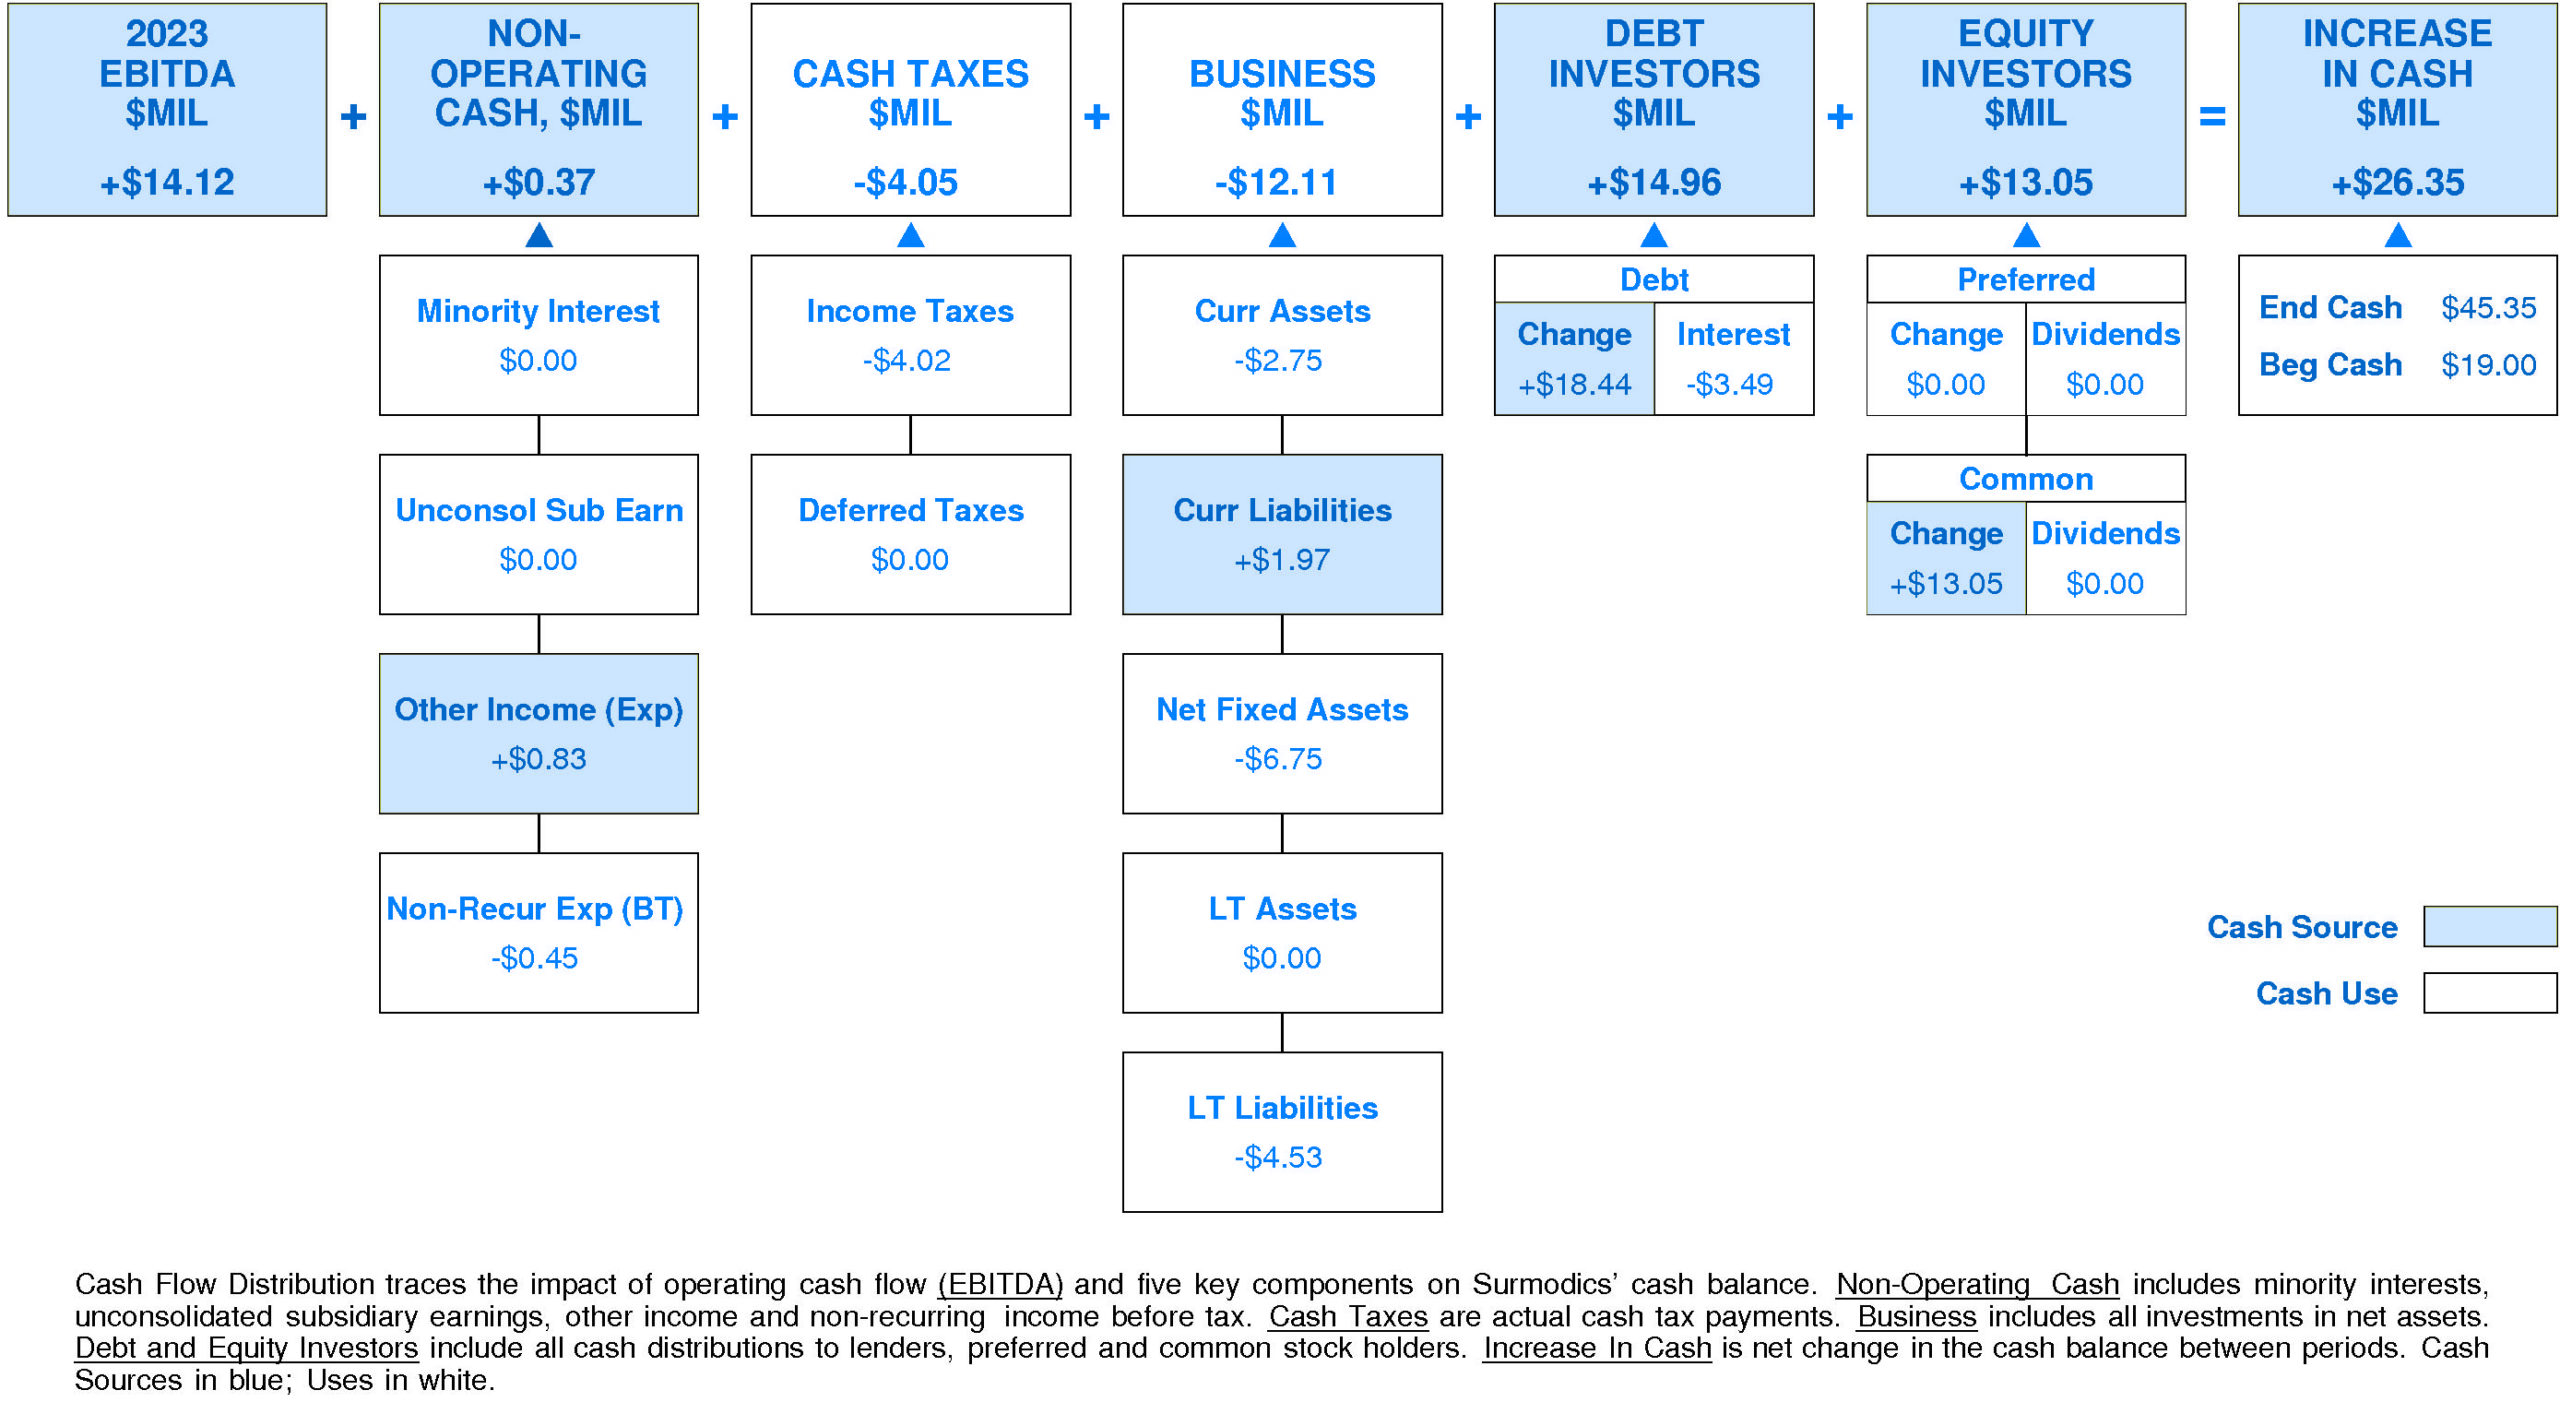
Surmodics’ Non-operating Income, %EBITDA has enjoyed a volatile overall uptrend over the period. This improvement was accompanied by stability for the Surmodics Peer Group. In most years, Surmodics was in the top quartile and second quartile. Currently, Surmodics is upper quartile at +3% of EBITDA (+$0.37 million).
Surmodics’ Cash Taxes, %EBITDA enjoyed a volatile overall uptrend over the period. This improvement was accompanied by a similar trend for the Surmodics Peer Group. In most years, Surmodics was in the top quartile and lower quartile. Currently, Surmodics is lower quartile at -29% of EBITDA (-$4.05 million).
Surmodics’ Business Re-investment, %EBITDA has suffered a volatile overall downtrend over the period. This downtrend was accompanied by an opposite trend for the Surmodics Peer Group. In most years, Surmodics was in the top quartile and second quartile. Currently, Surmodics is substantially below median at -86% of EBITDA (-$12.11 million).
Surmodics’ Debt Investors, %EBITDA has experienced a very strong overall uptrend over the period. This improvement was accompanied by an opposite trend for the Surmodics Peer Group. In most years, Surmodics was in the third quartile and top quartile. Currently, Surmodics is upper quartile at +106% of EBITDA (+$14.96 million).
Surmodics’ Equity Investors, %EBITDA has enjoyed a very strong overall uptrend over the period. This improvement was accompanied by an opposite trend for the Surmodics Peer Group. In most years, Surmodics was in the top quartile and second quartile. Currently, Surmodics is at the upper quartile at +92% of EBITDA (+$13.05 million).
Surmodics’ Change in Cash, %EBITDA has experienced a volatile overall uptrend over the period. This improvement was accompanied by an opposite trend for the Surmodics Peer Group. (Since 2021 Change in Cash, %EBITDA has accelerated very sharply.) In most years, Surmodics was in the top quartile and second quartile. Currently, Surmodics is upper quartile at +187% of EBITDA (+$26.35 million).
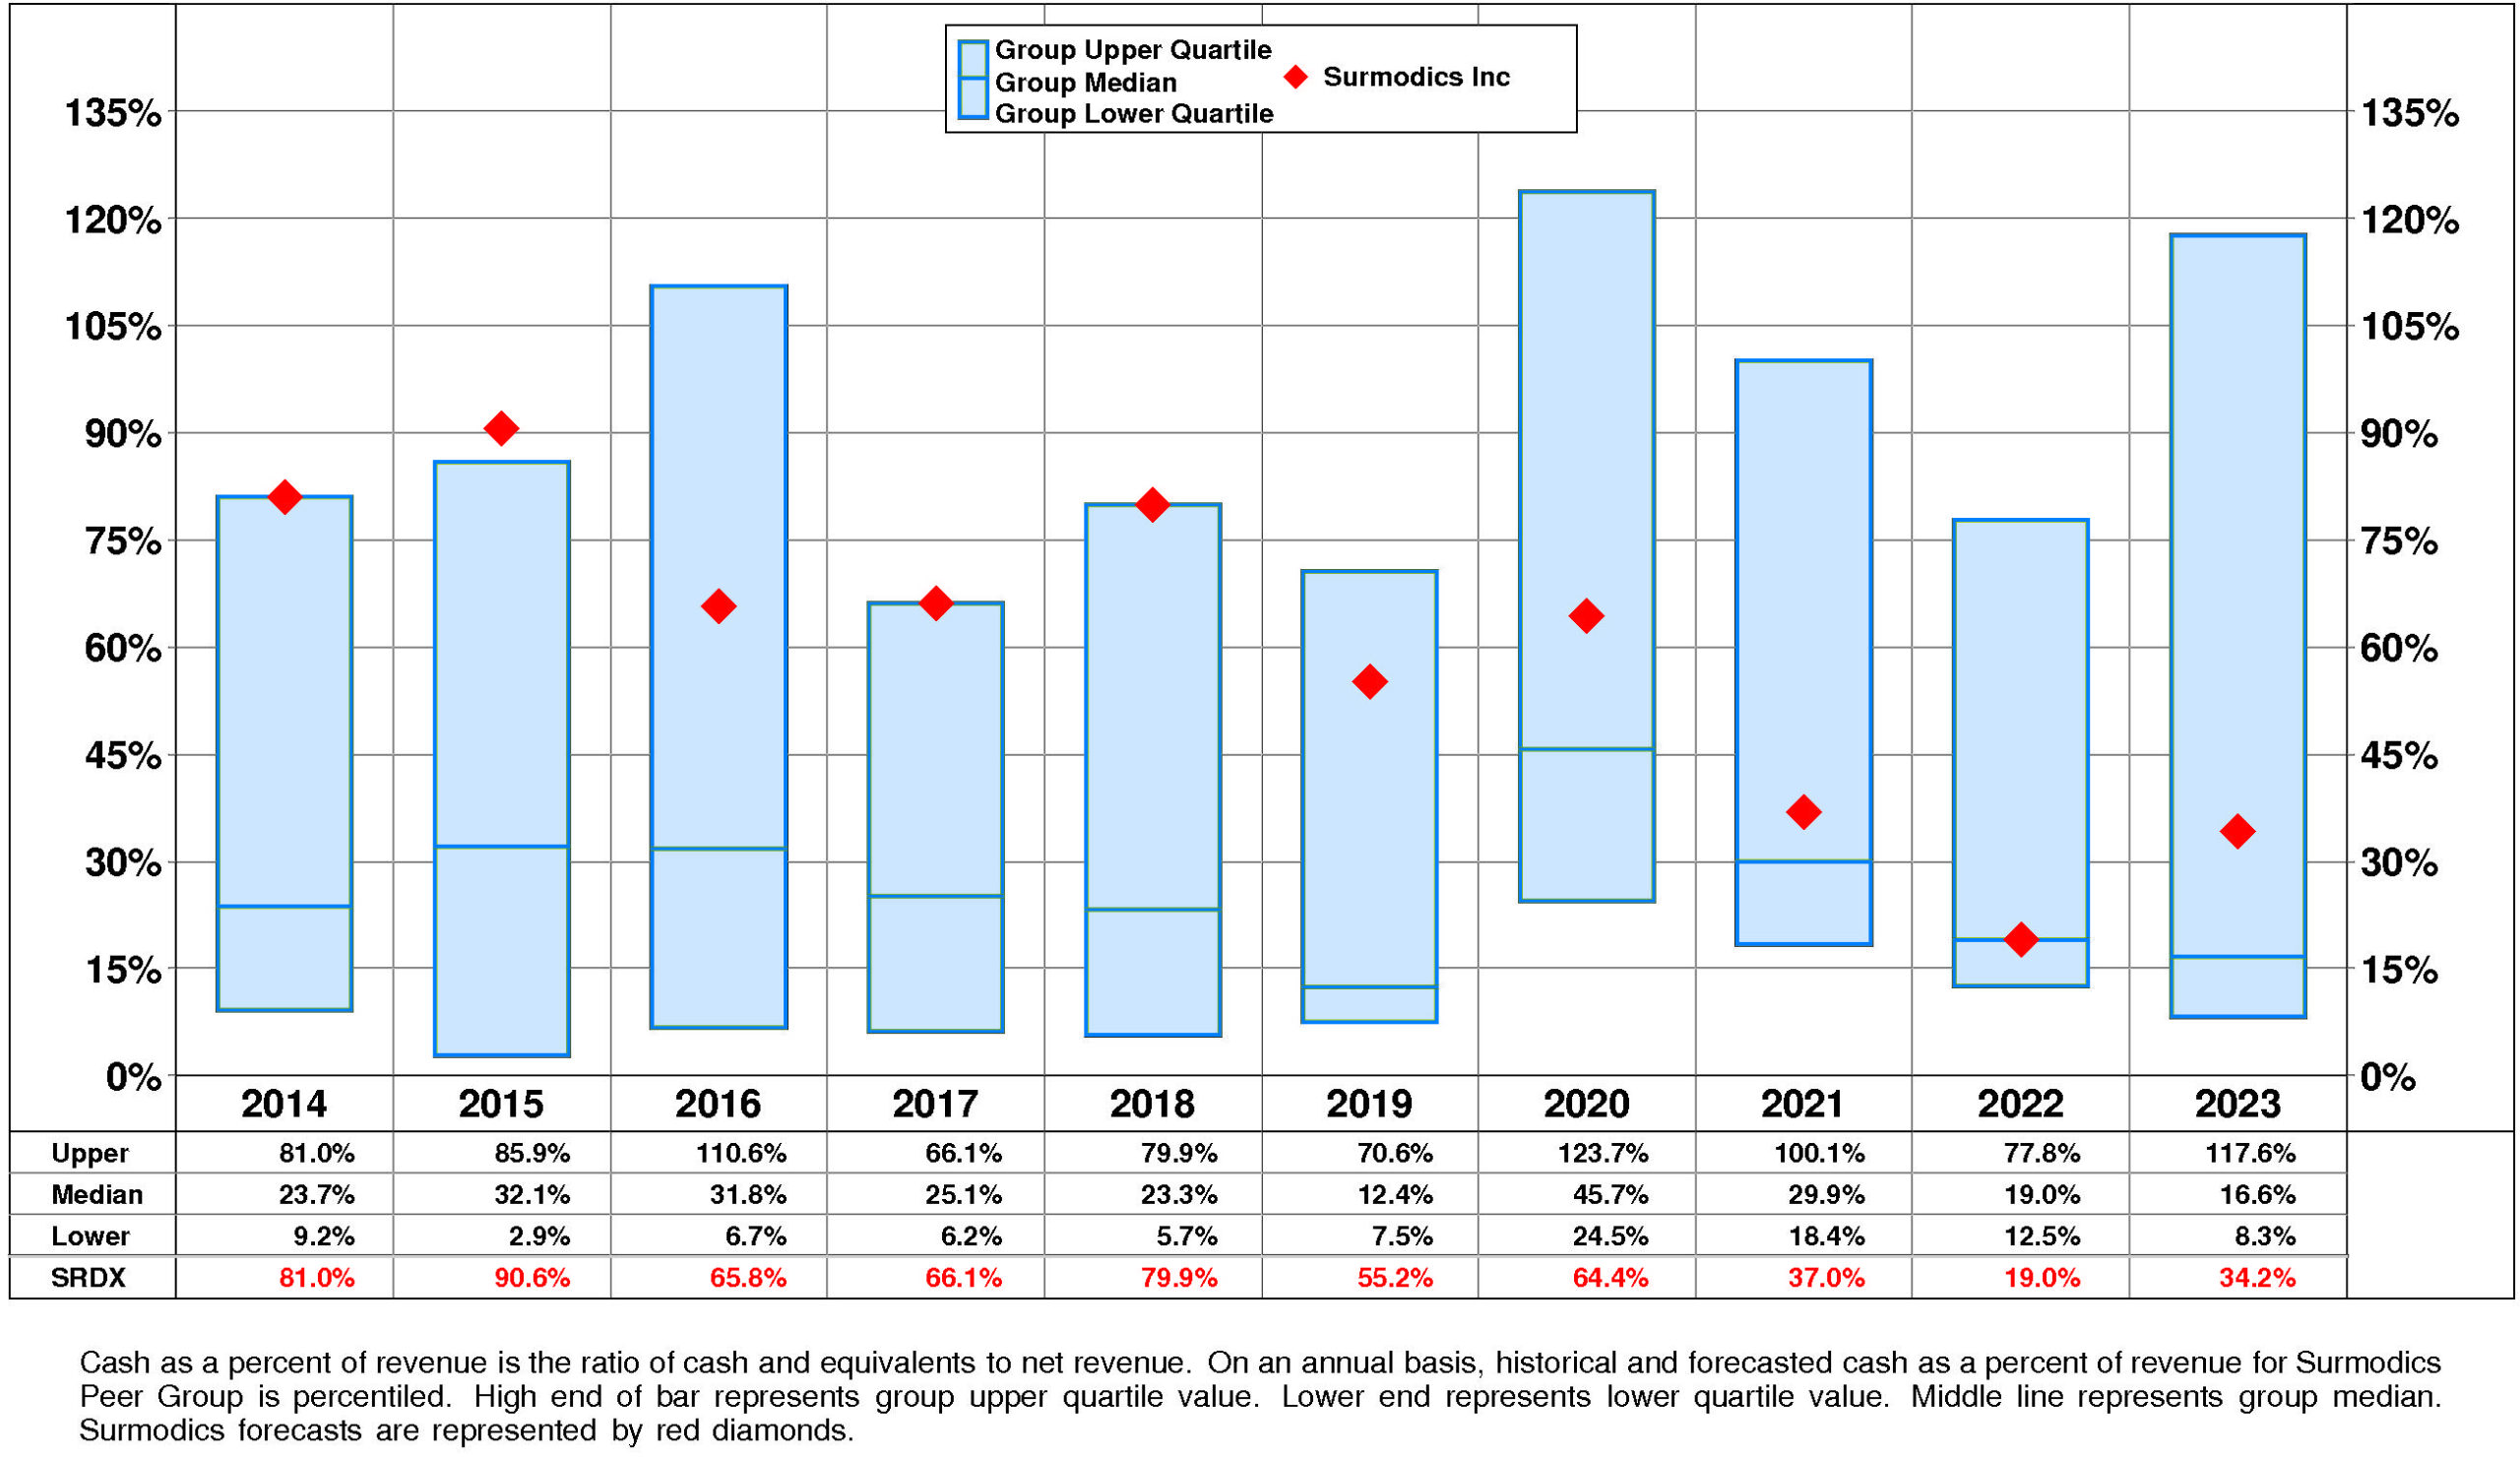
Surmodics’ Cash, %Revenue has suffered a very strong overall downtrend over the period. This downtrend was accompanied by a similar trend for the Surmodics Peer Group. In most years, Surmodics was in the second quartile and top quartile. Currently, Surmodics is slightly above median at +34%.
PROFITABILITY
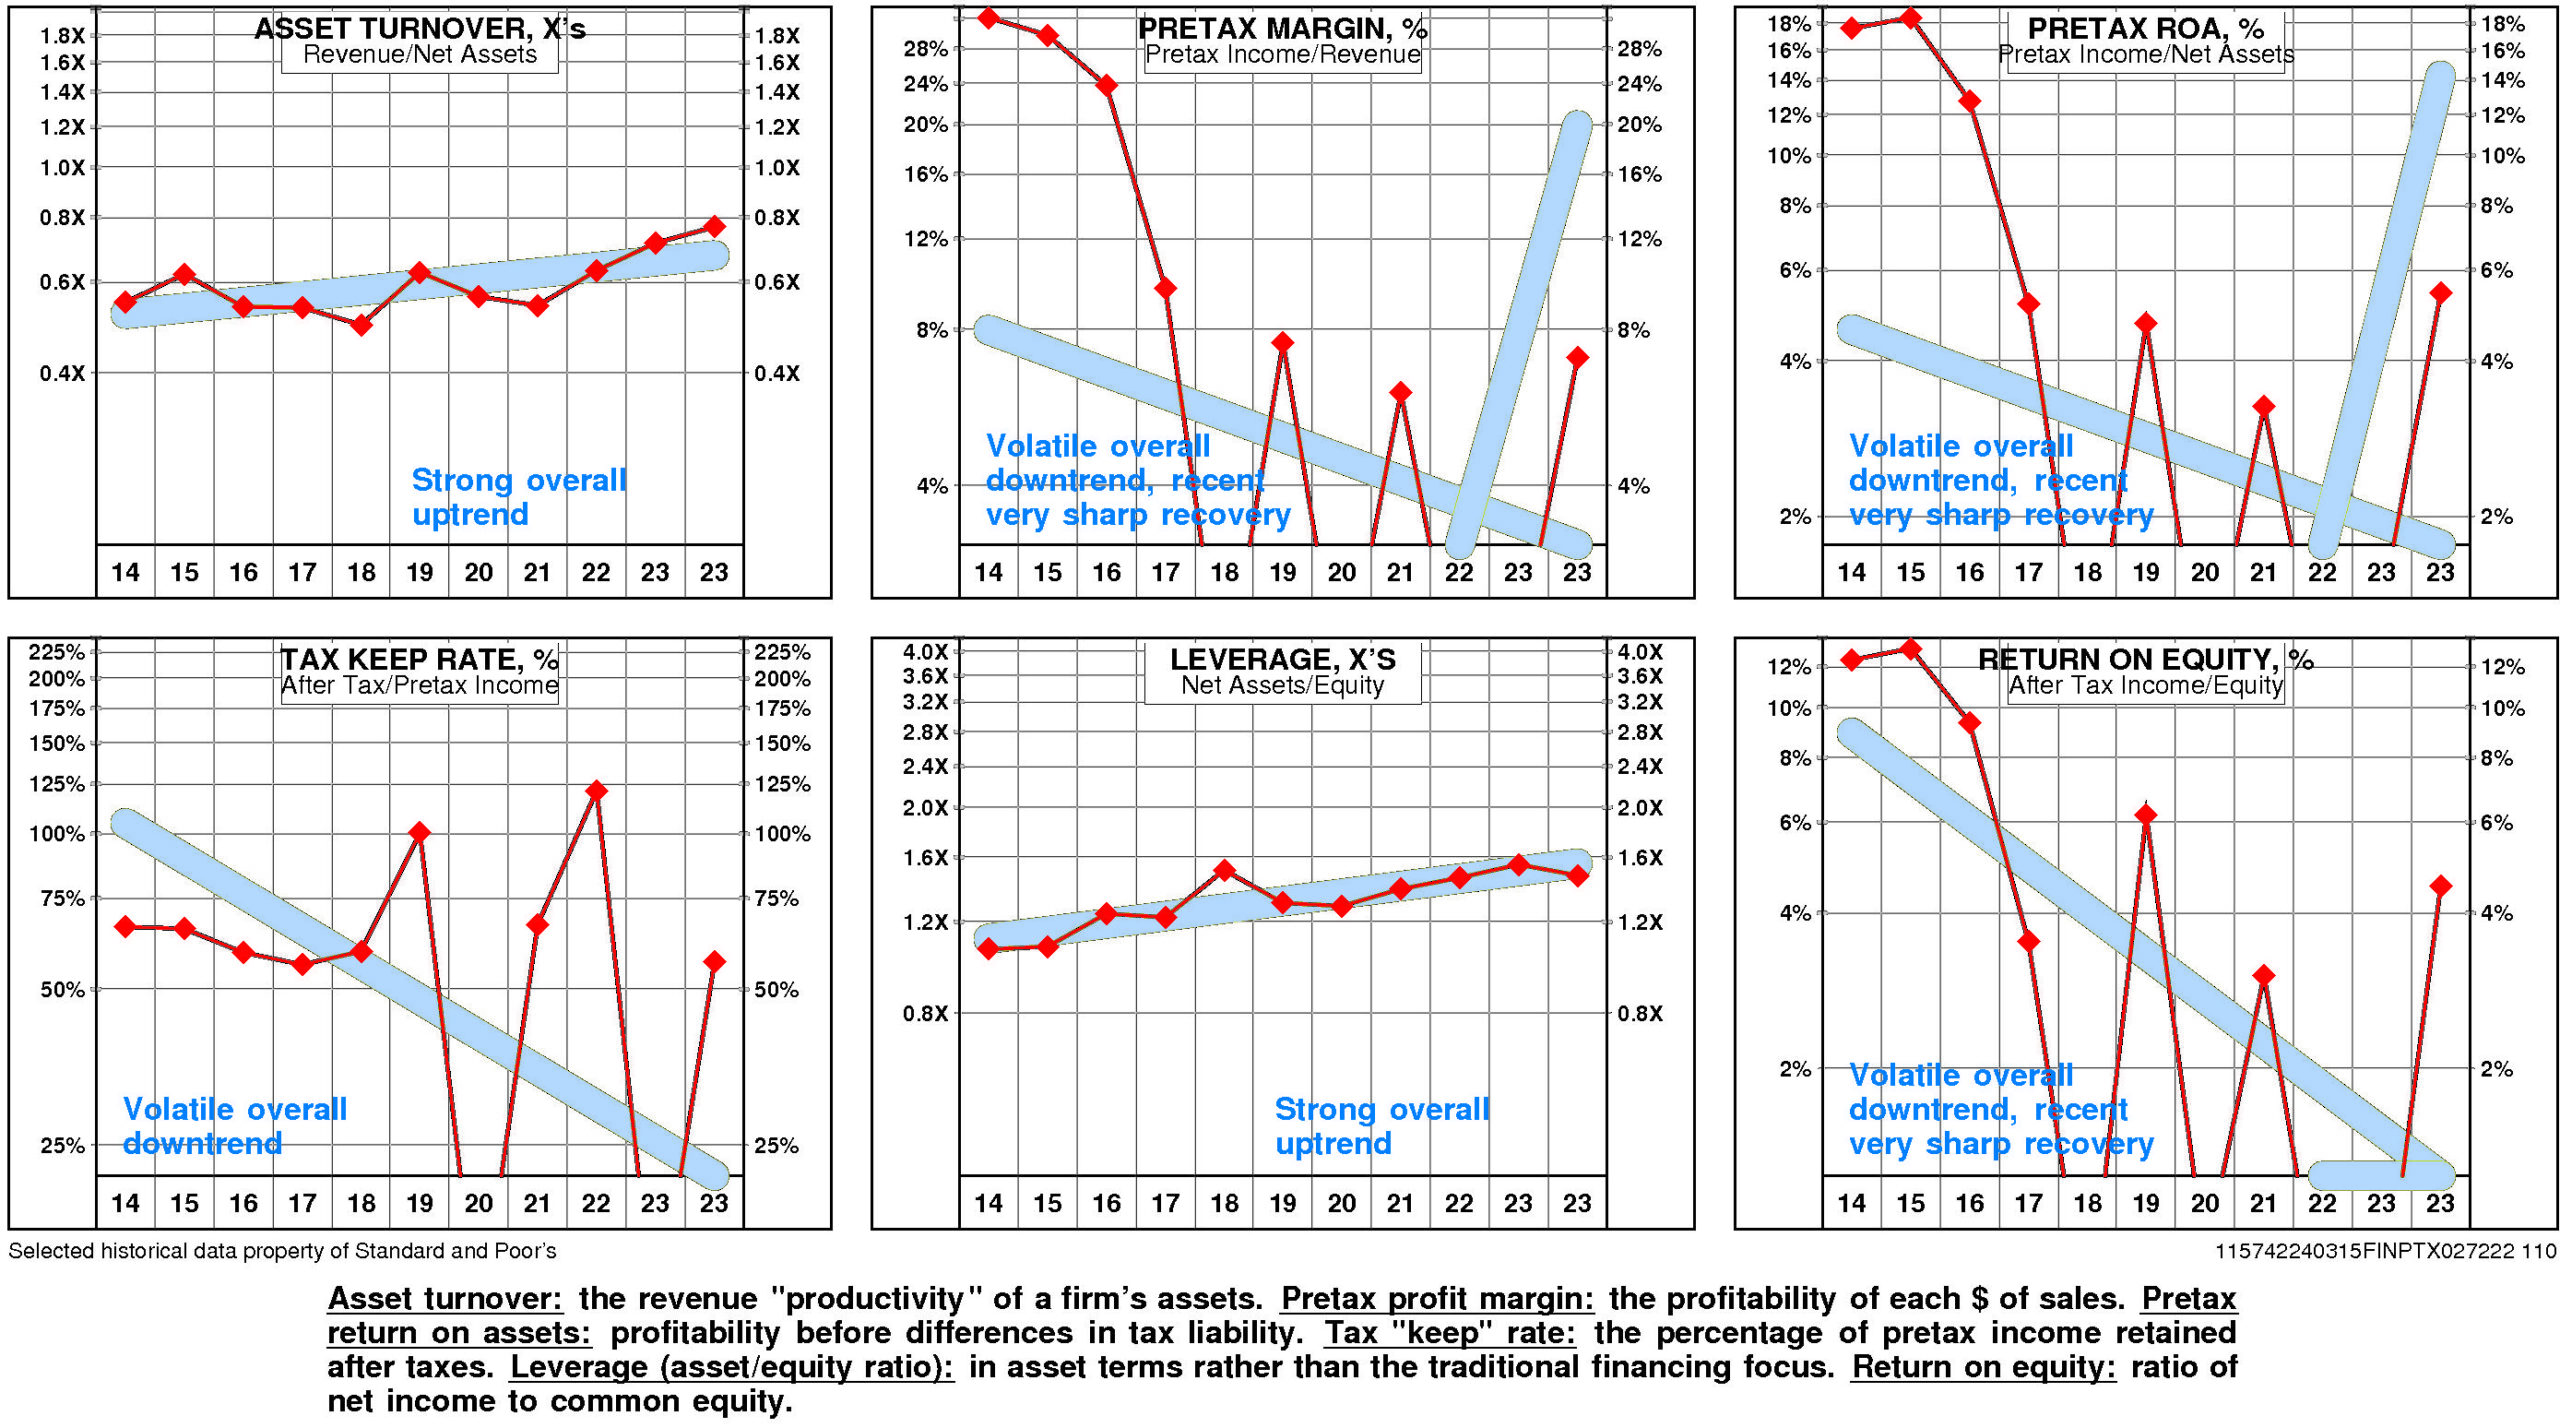
Surmodics’ return on equity has eroded very significantly since 2014. The current level is 4.5% versus the high of 12.4% and the low of -25.2%.
Surmodics’ very strong negative trend in pretax operating return significantly augmented by a very strong negative trend in non-operating factors is a major performance consideration.
The productivity of Surmodics’ assets rose over the full period 2014-2023: asset turnover has enjoyed a strong overall uptrend.
More than offsetting this trend, however, pretax margin experienced a strong overall downtrend even as it experienced a very sharp recovery after the 2022 low.
Non-operating factors (income taxes and financial leverage) had a significant negative influence on return on equity.
Surmodics’ return on equity is at the upper quartile (4.5%) for the four quarters ended December, 2023.
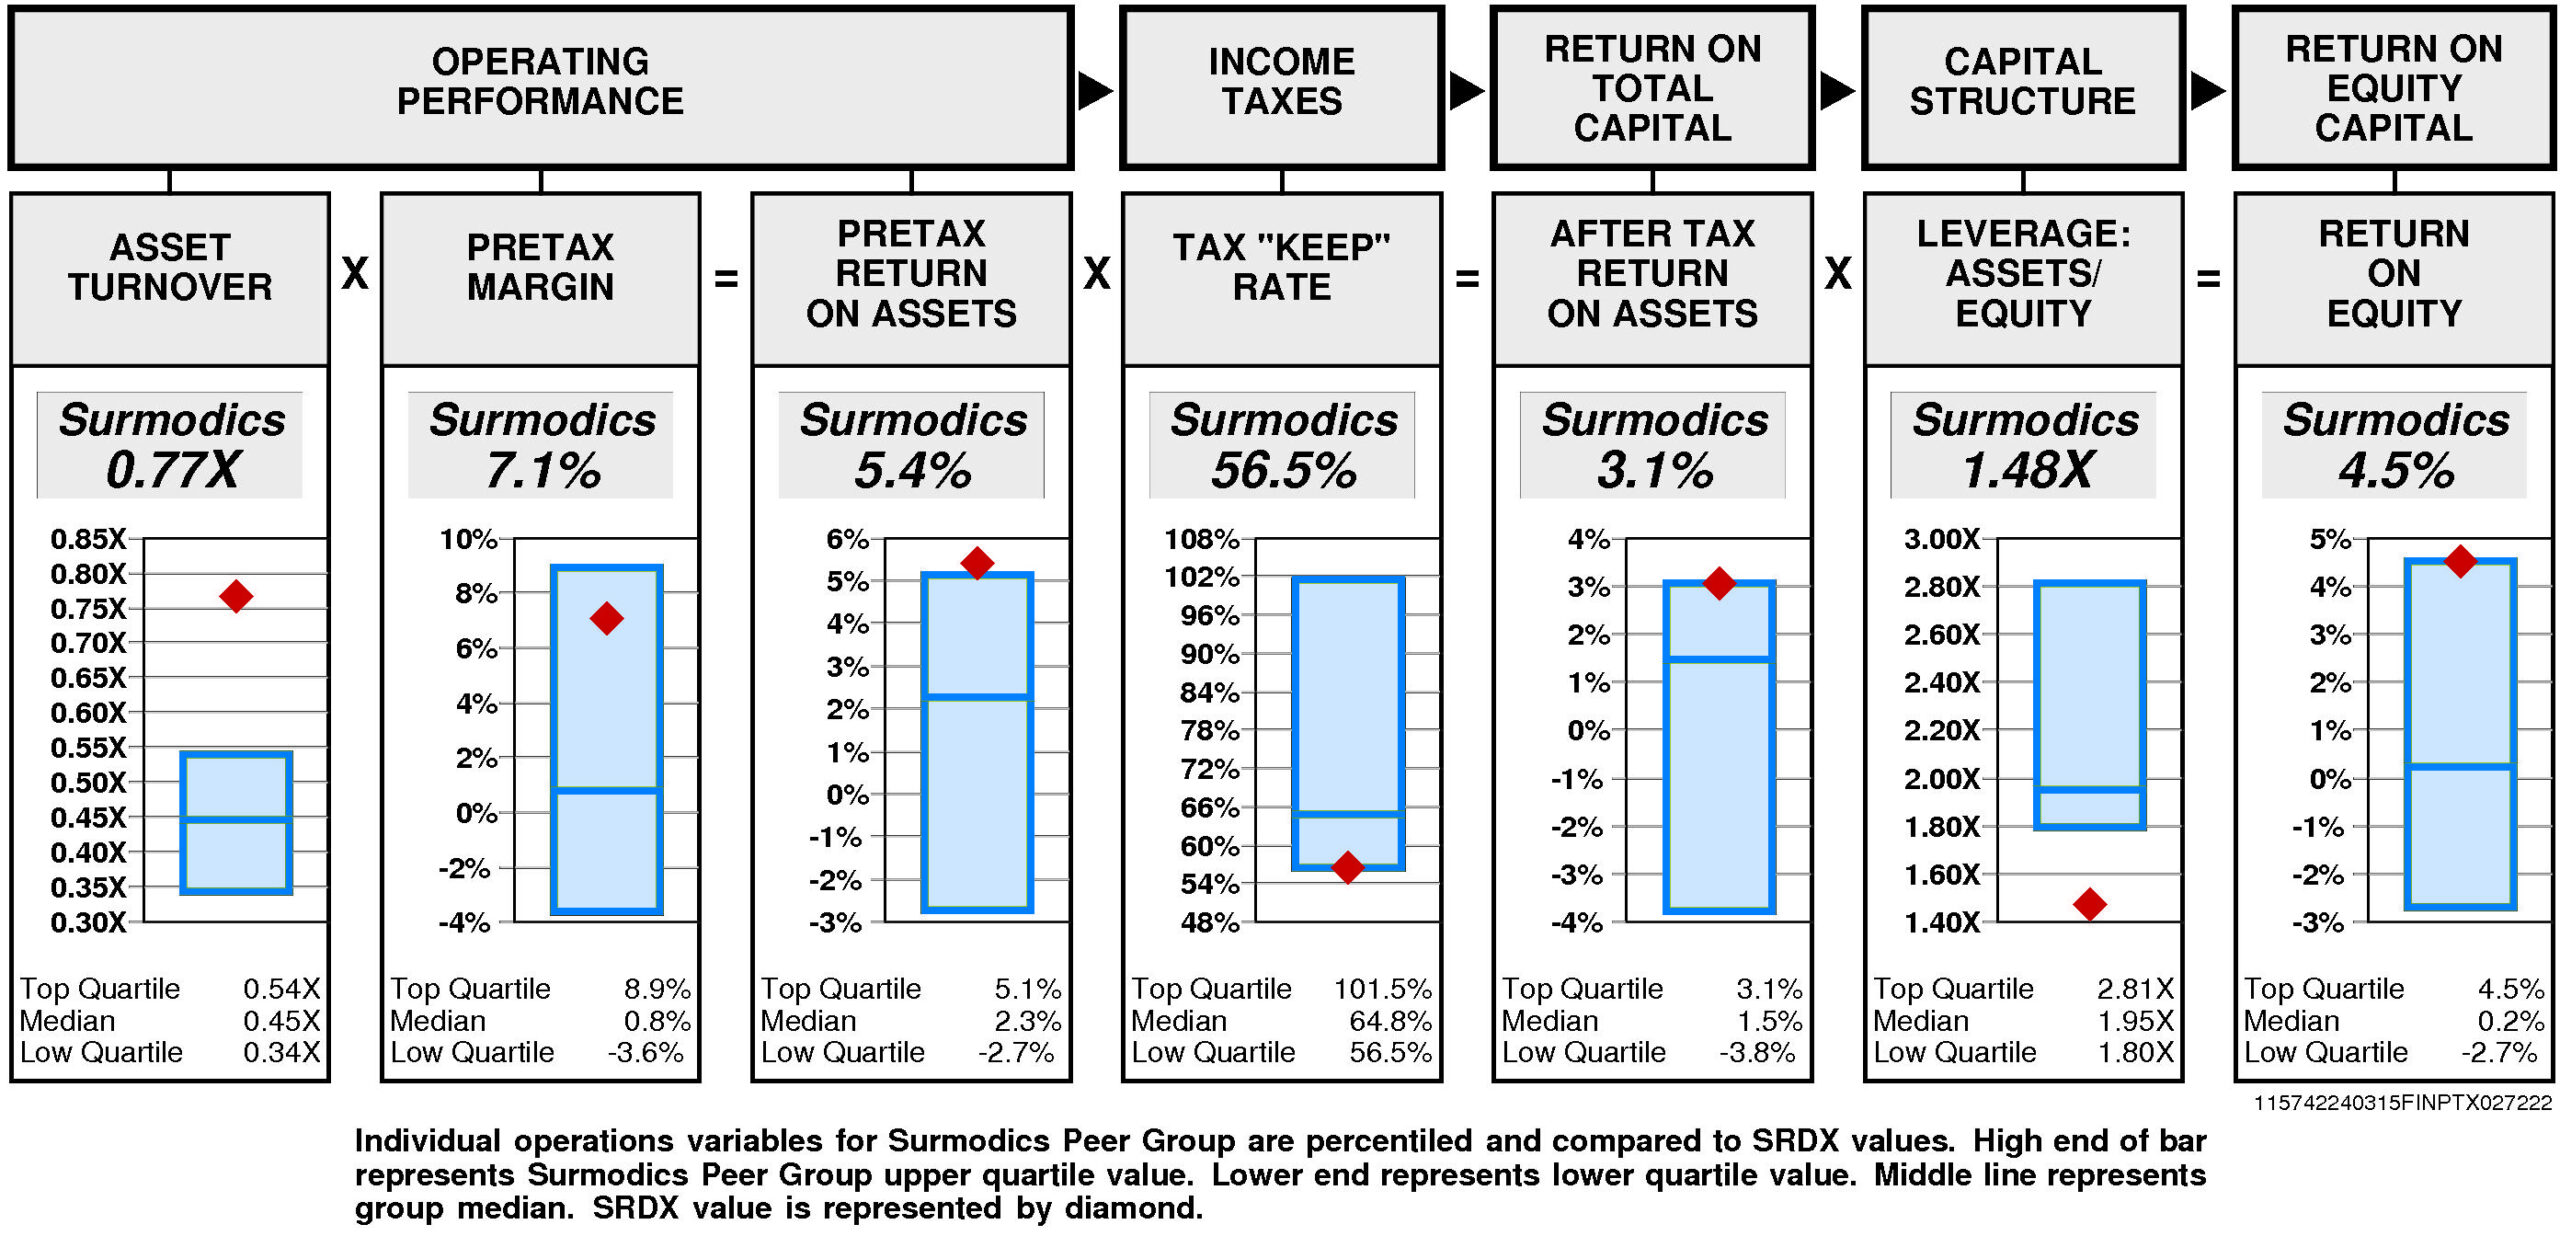
Operating performance (pretax return on assets) is upper quartile (5.4%) reflecting asset turnover that is upper quartile (0.77X) and substantially above median pretax margin (7.1%).
Tax “keep” rate (income tax management) is at the lower quartile (56.5%) resulting in after tax return on assets that is at the upper quartile.
Financial leverage (leverage) is lower quartile (1.48X).
GROWTH RATES
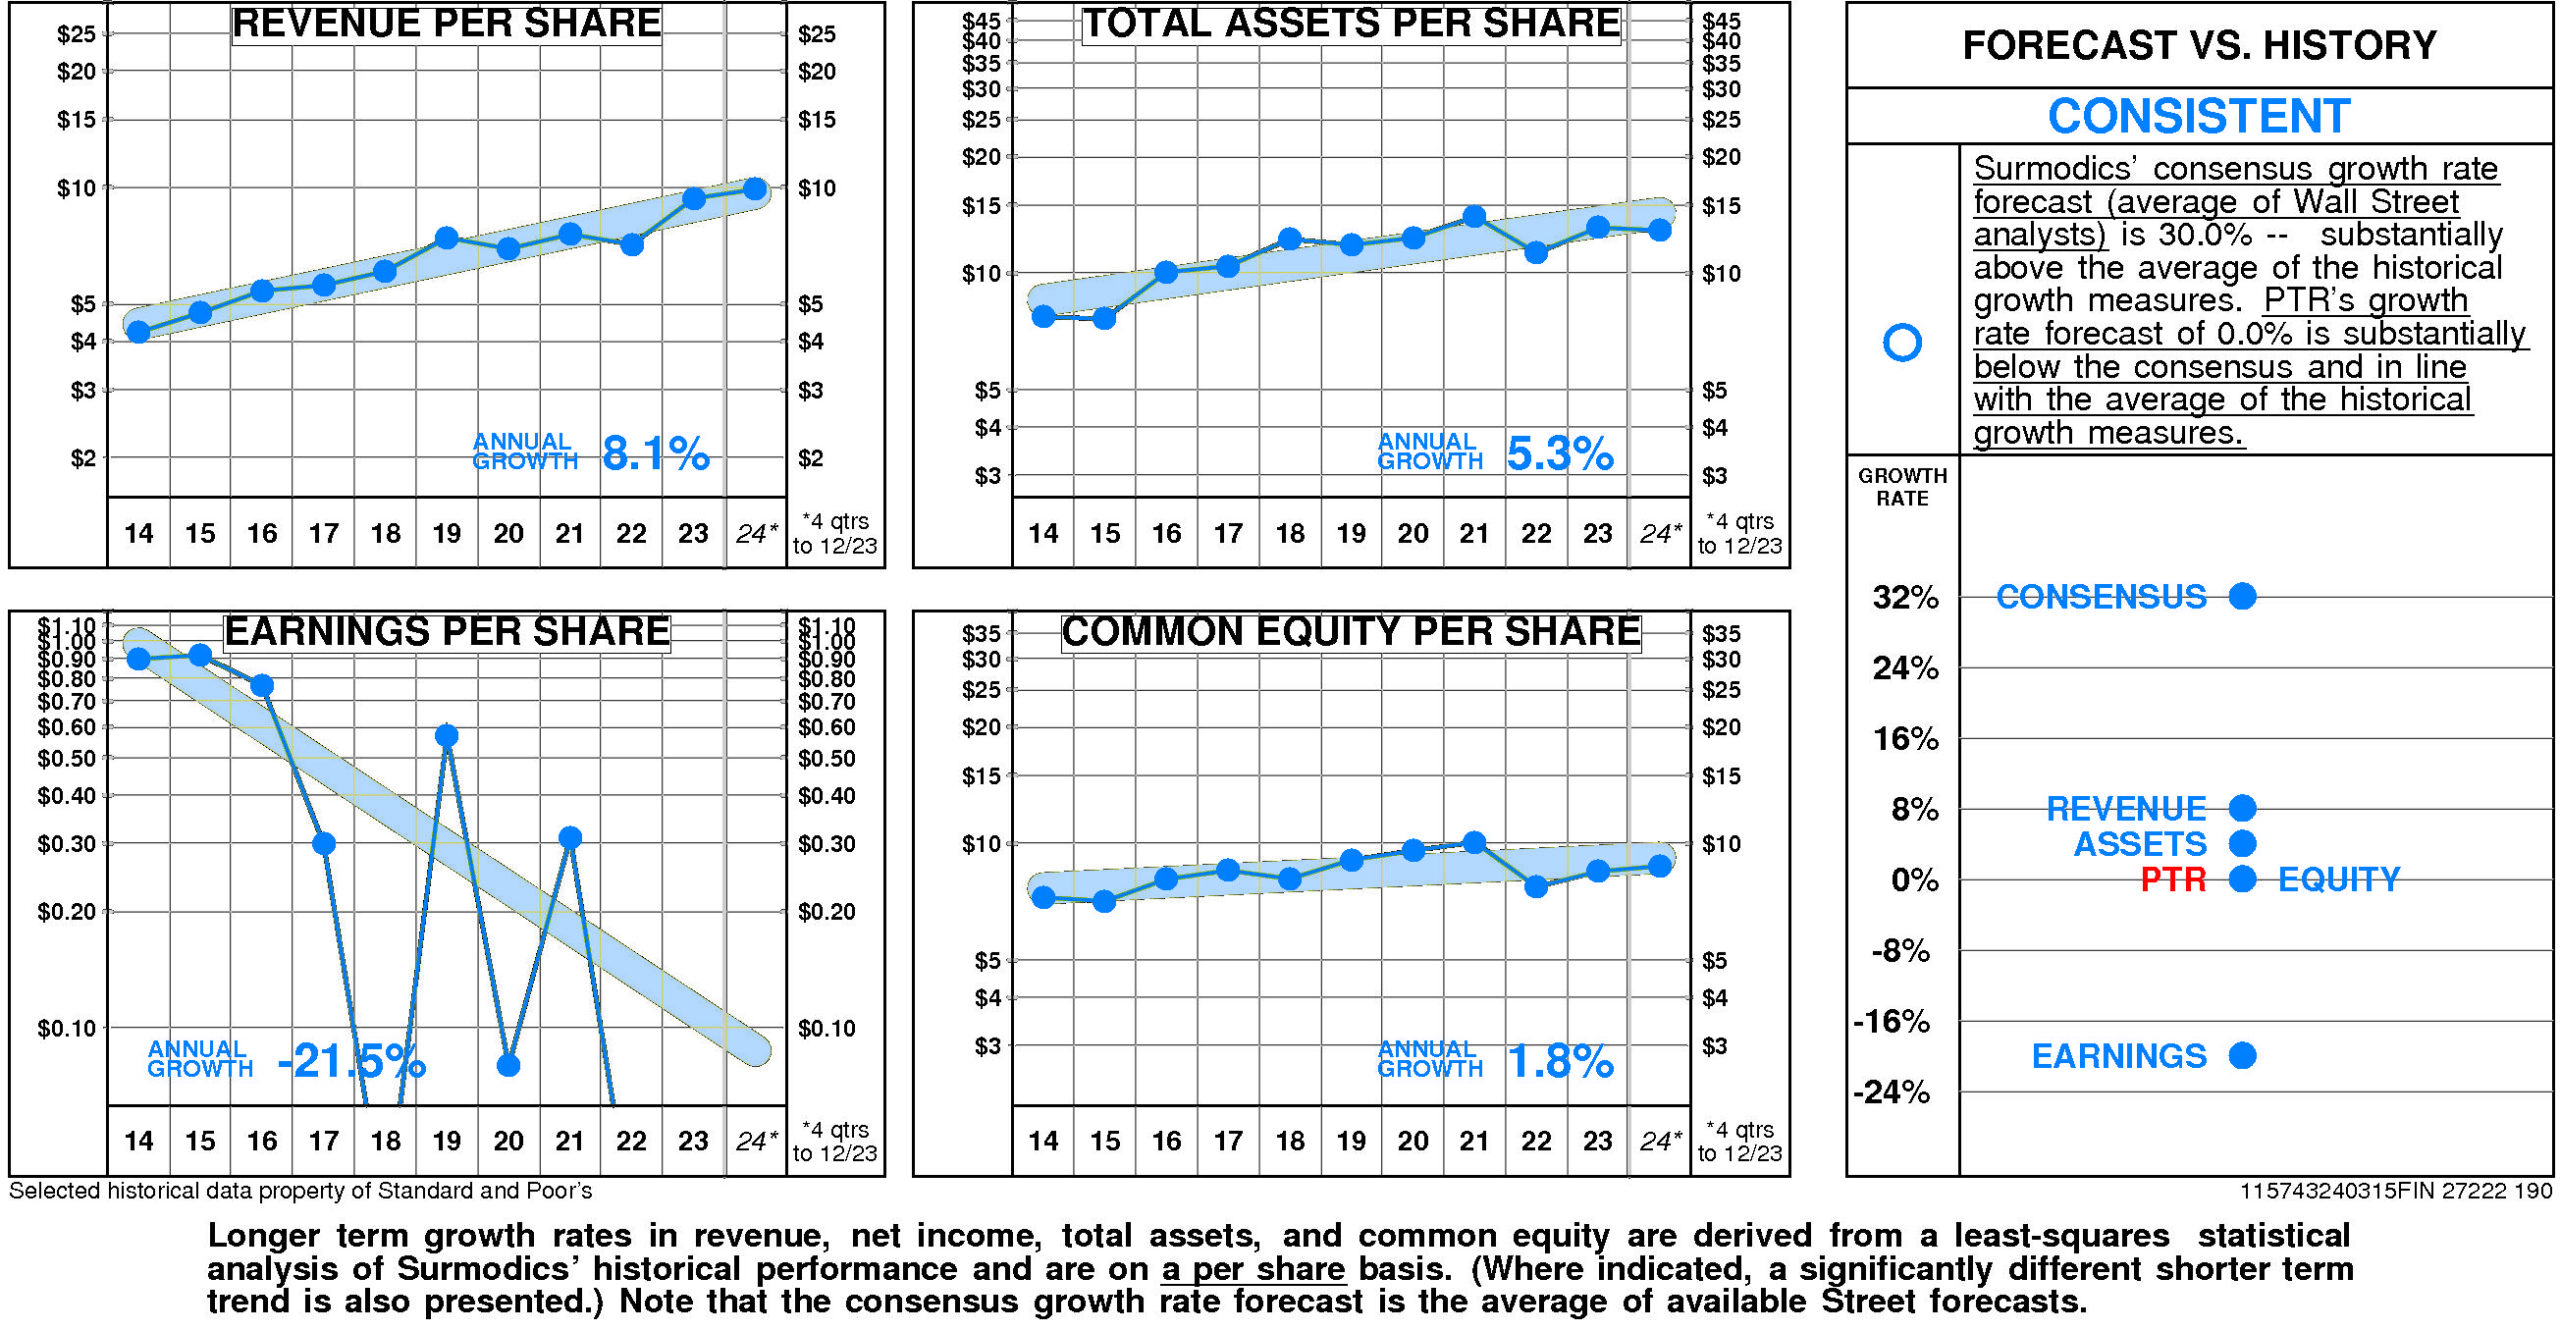
There are no significant differences between Surmodics’ longer term growth and growth in recent years.
Surmodics’ historical income statement growth and balance sheet growth have diverged. Revenue growth has paralleled asset growth; earnings growth has fallen short of equity growth.
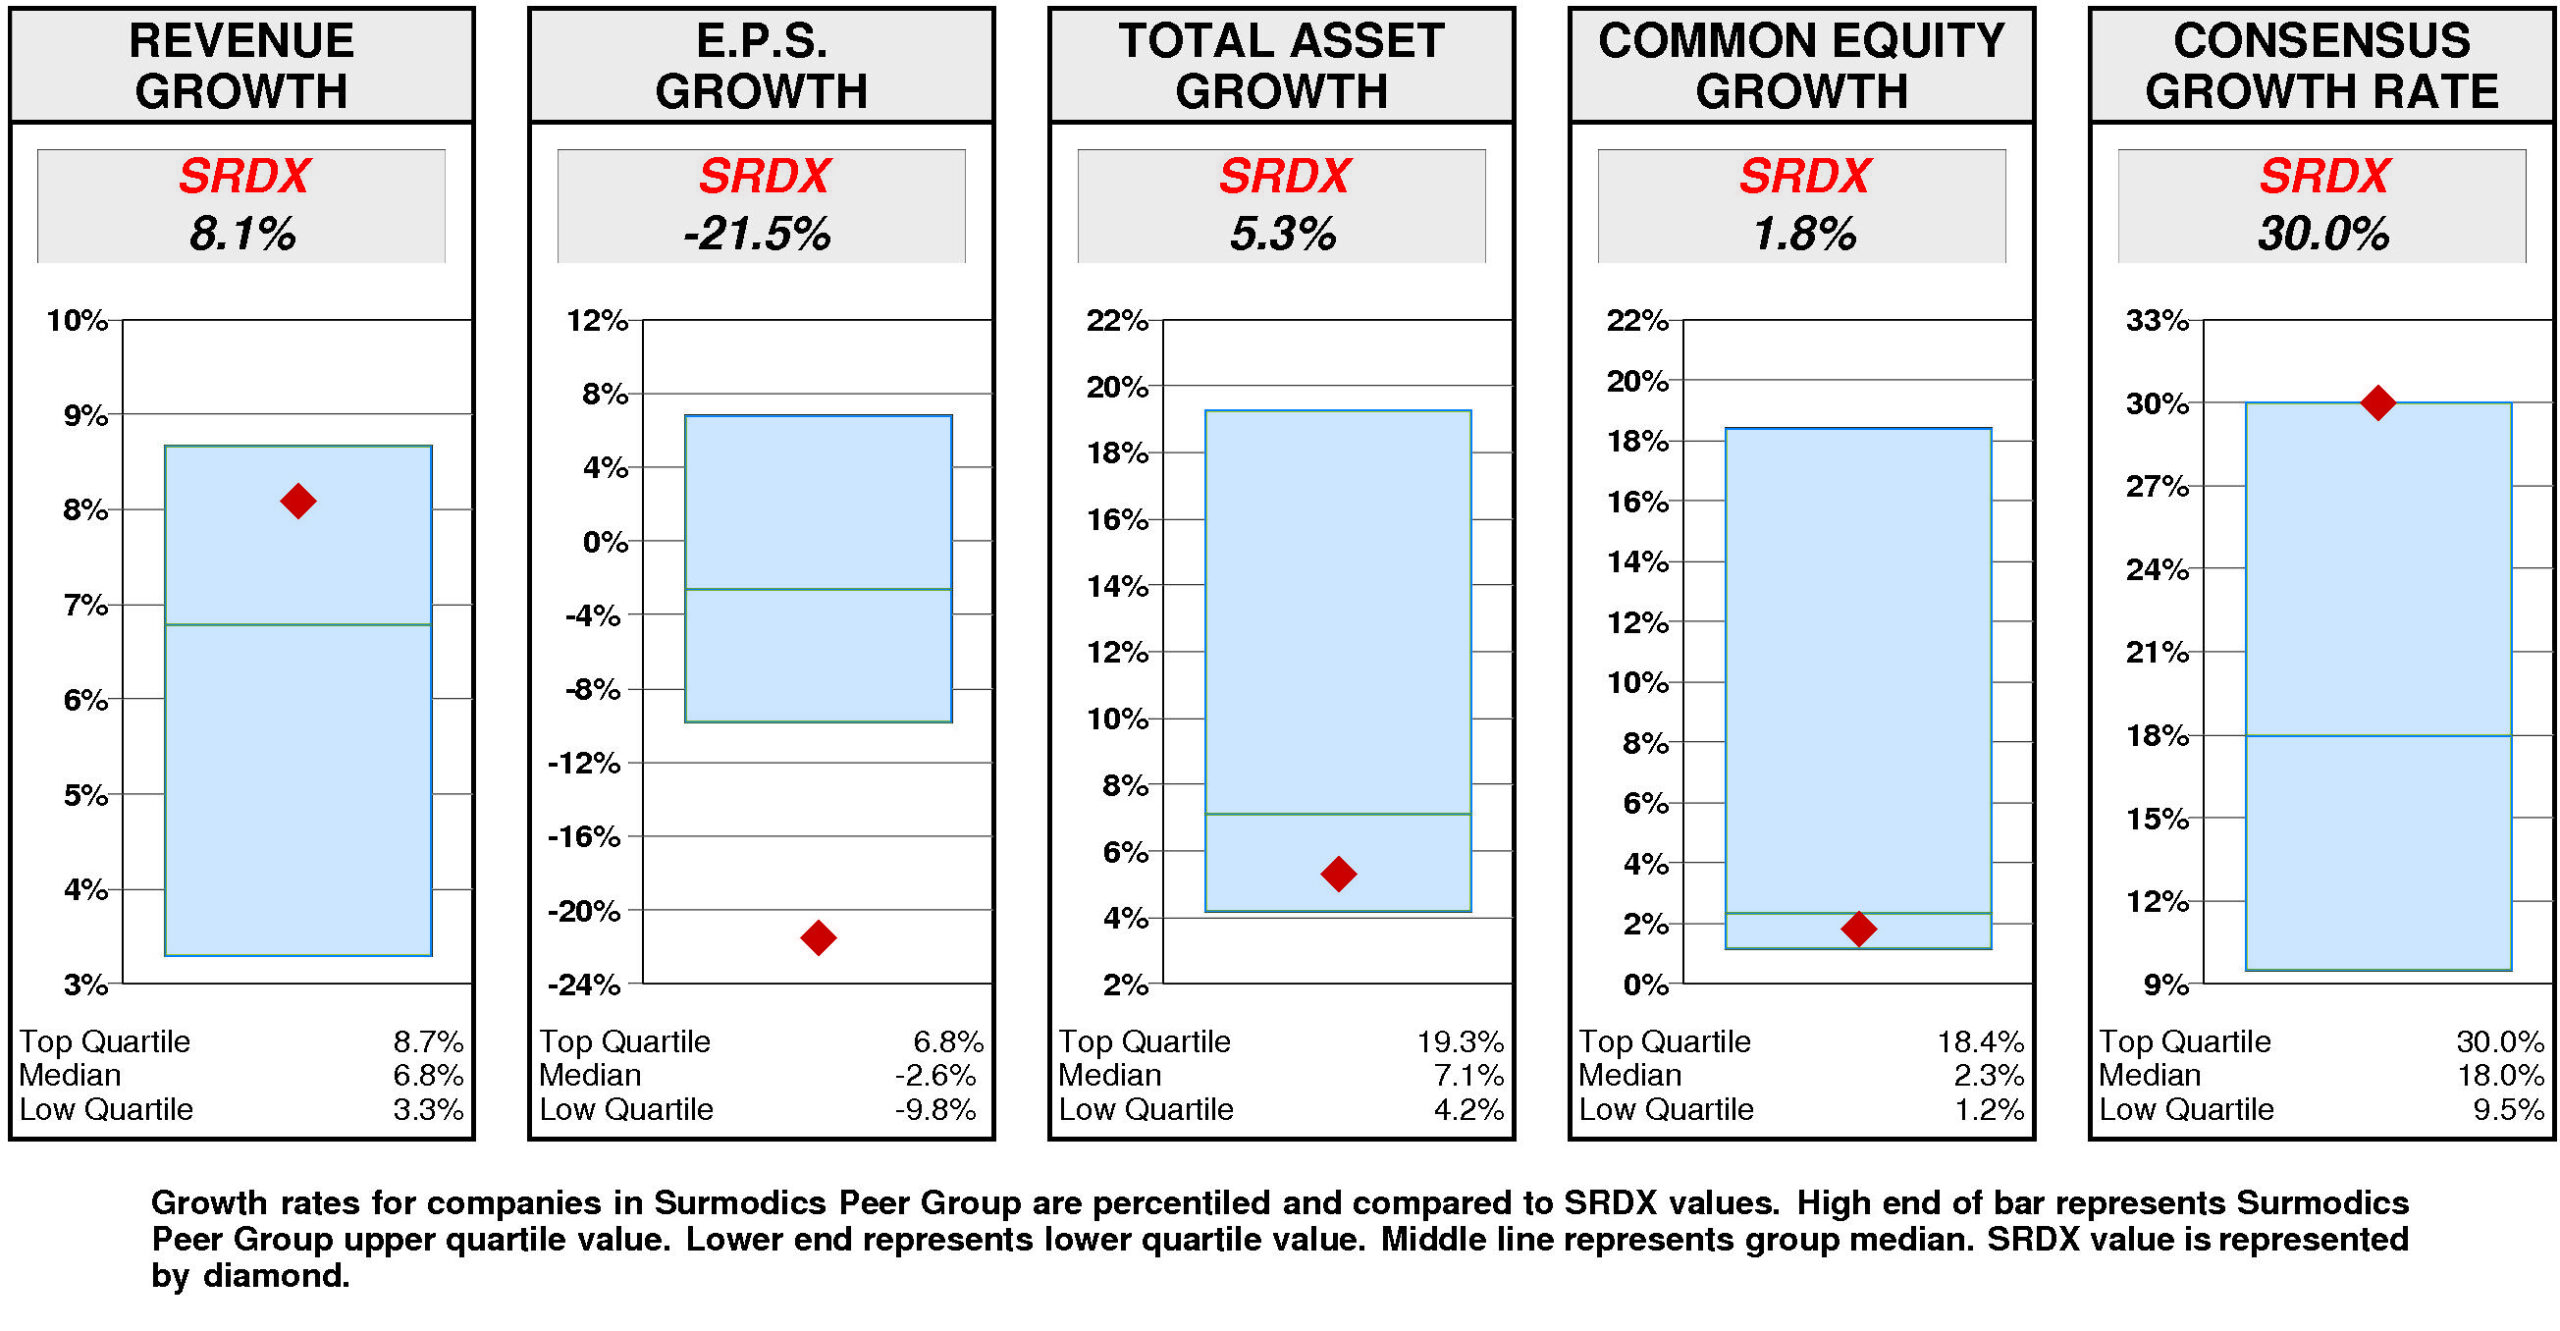
Annual revenue growth has been 8.1% per year.
Total asset growth has been 5.3% per year.
Annual E.P.S. growth has been -21.5% per year.
Equity growth has been 1.8% per year.
Surmodics’ consensus growth rate forecast (average of Wall Street analysts) is 30.0% — substantially above the average of the historical growth measures.
Relative to the Surmodics Peer Group, Surmodics’ historical growth measures are erratic. Revenue growth (8.1%) has been above median. Total asset growth (5.3%) has been below median. Equity growth (1.8%) has been below median. E.P.S. growth (-21.5%) has been lower quartile.
Consensus growth forecast (30.0%) is at the upper quartile.
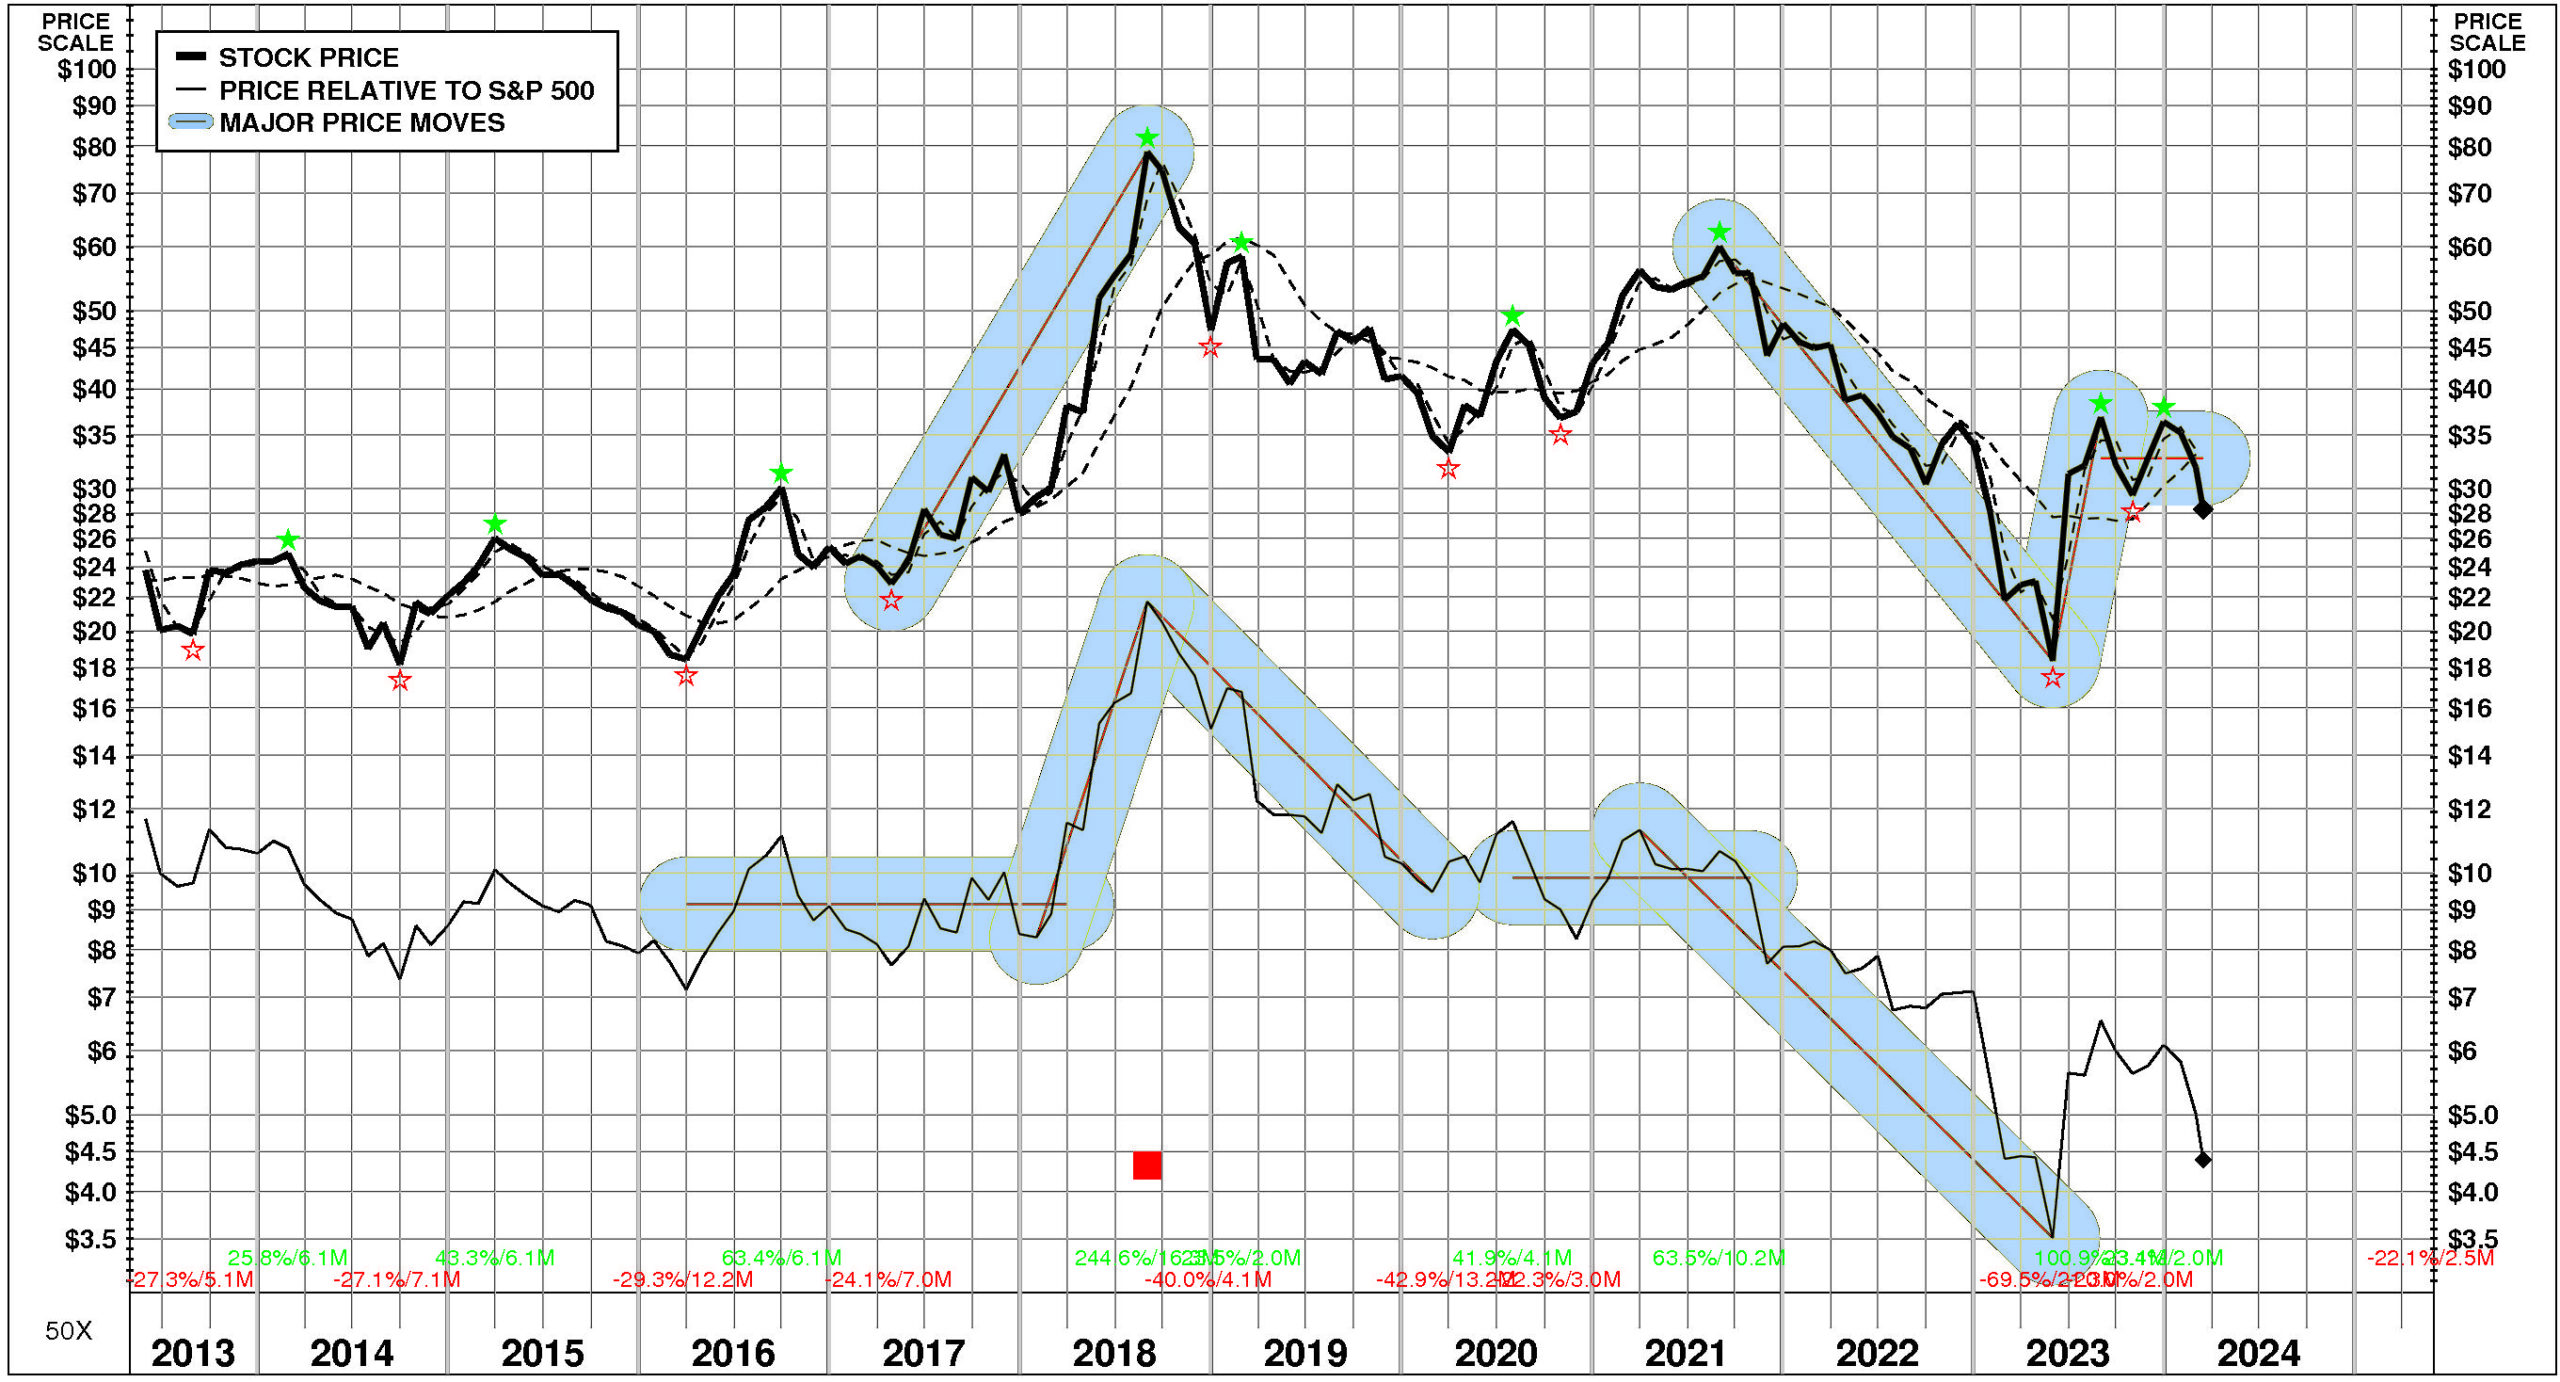
PRICE HISTORY
Over the full time period, Surmodics’ stock price performance has been variable and significantly below market. Between May, 2013 and March, 2024, Surmodics’ stock price rose +19%; relative to the market, this was a -62% loss. Significant price moves during the period: 1) May, 2023 – August, 2023: +101%; 2) August, 2021 – May, 2023: -69%; and 3) April, 2017 – August, 2018: +245%.
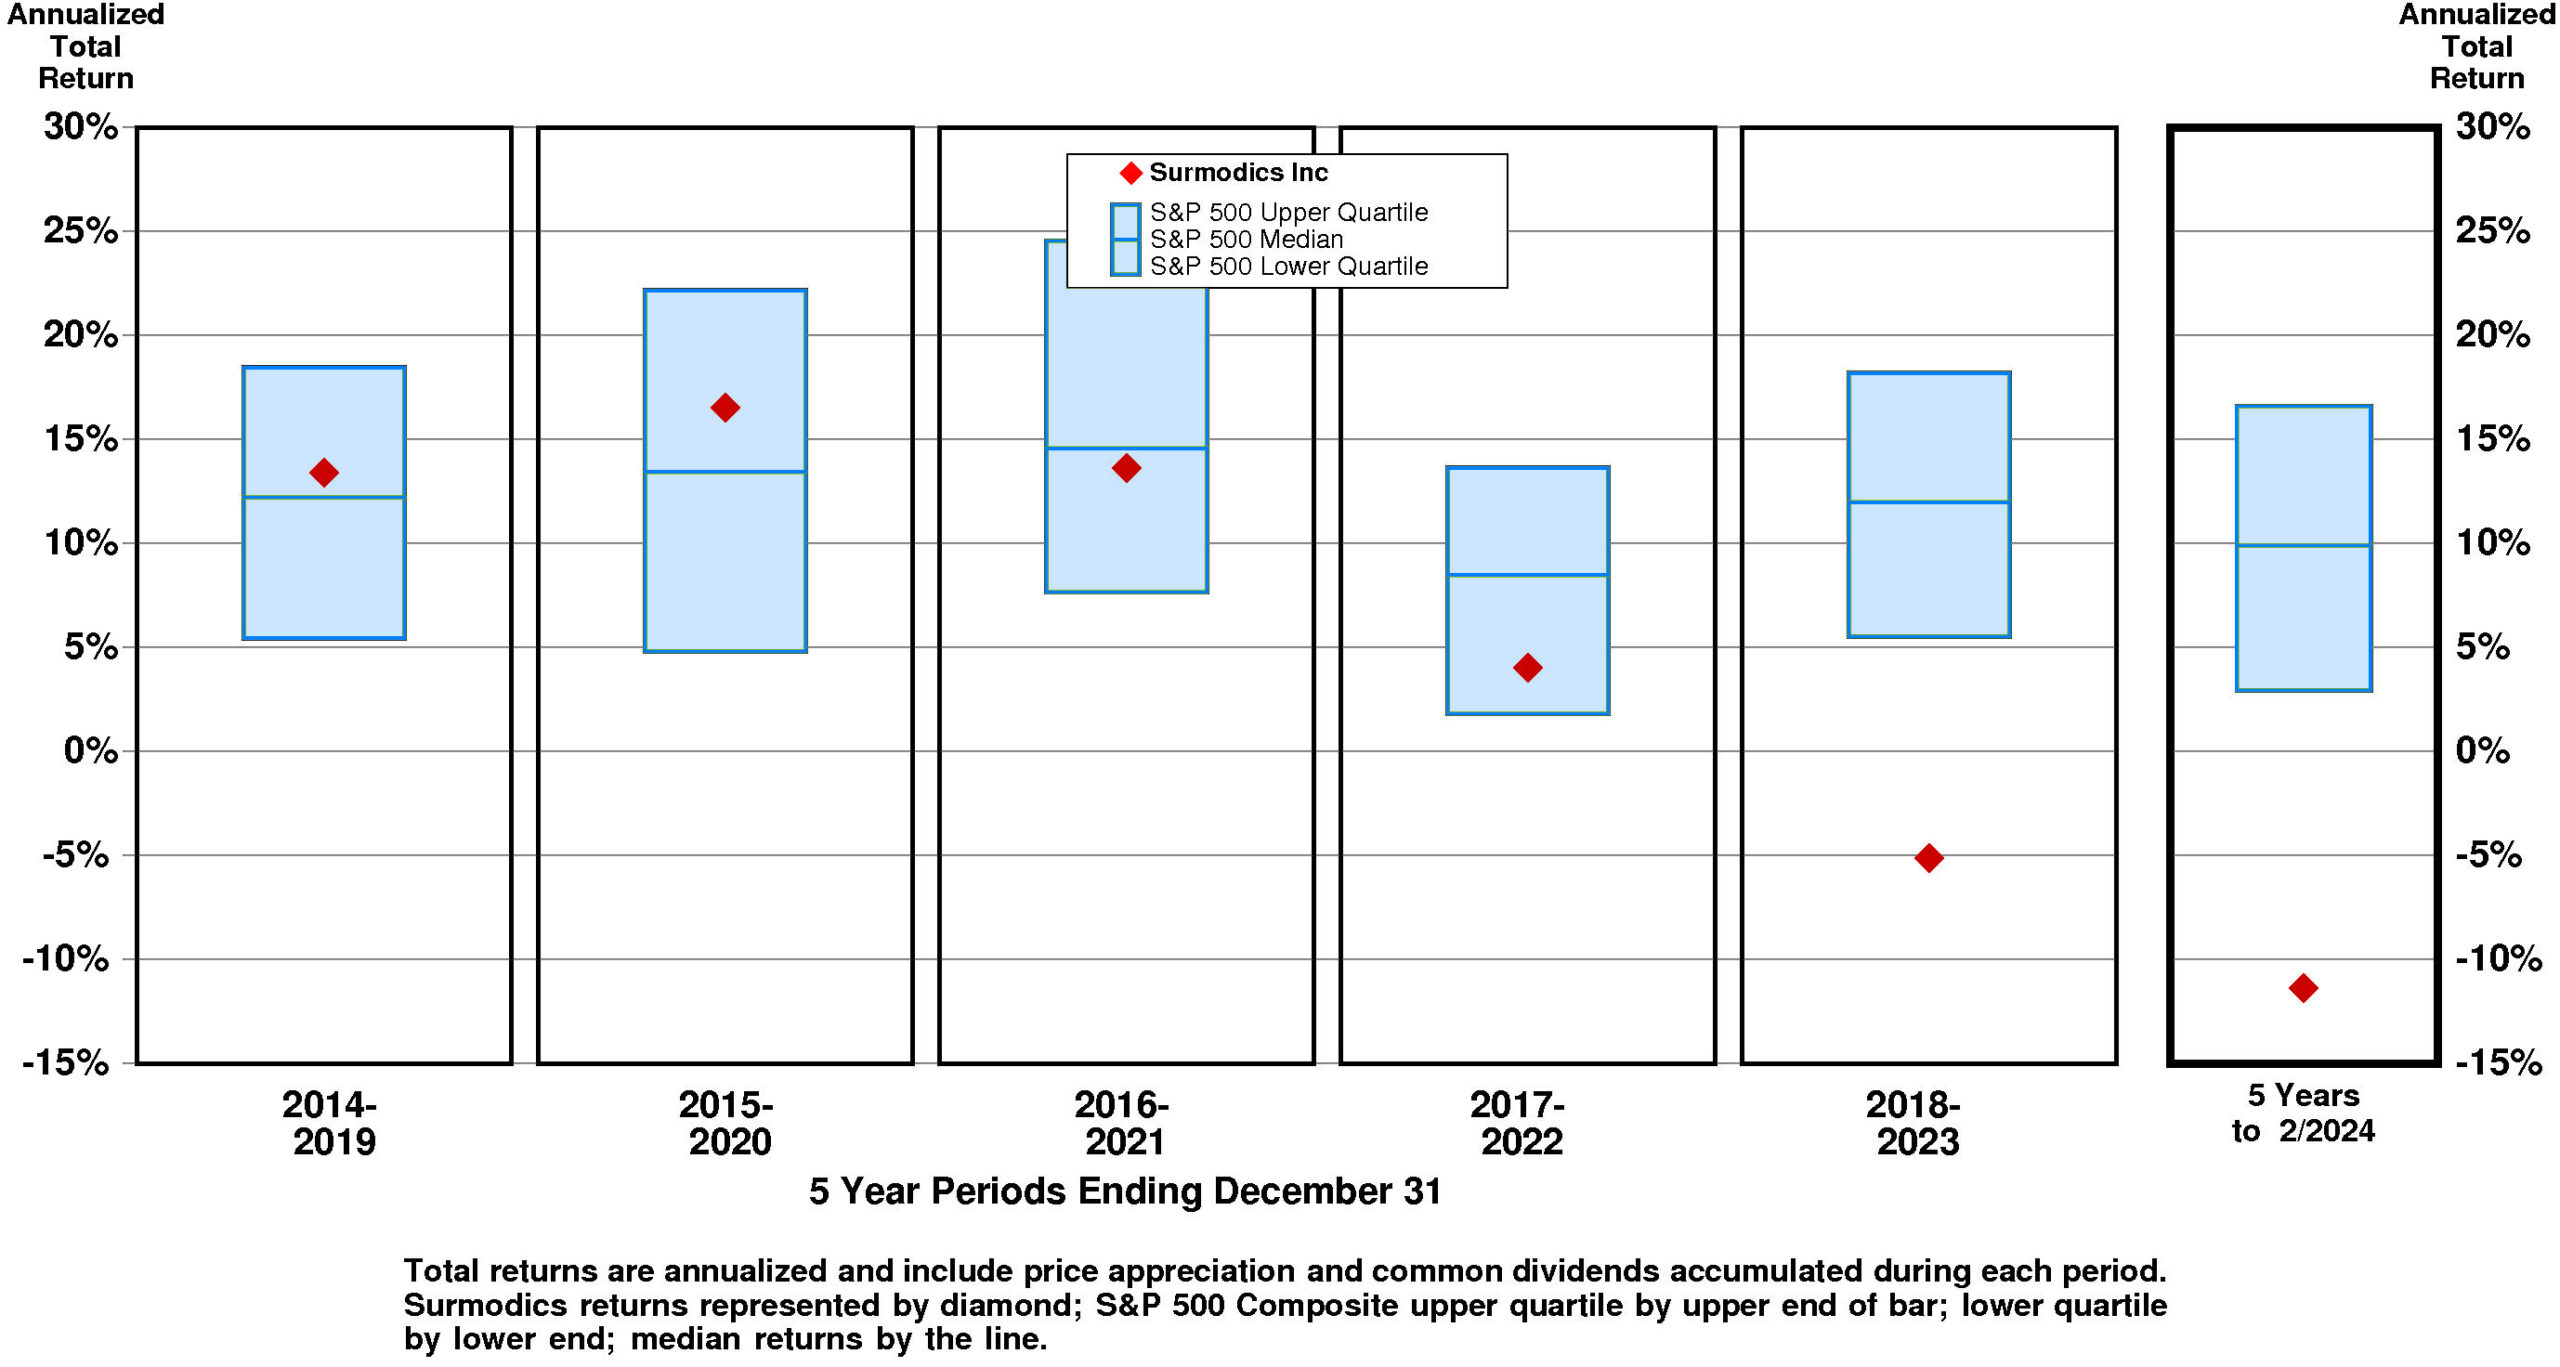
TOTAL INVESTMENT RETURNS
Current annual total return performance of 46.1% is upper quartile relative to the S&P 500 Composite.
In addition to being upper quartile relative to S&P 500 Composite, current annual total return performance through February, 2024 of 46.1% is upper quartile relative to Surmodics Inc Peer Group.
Current 5-year total return performance of -11.4% is lower quartile relative to the S&P 500 Composite.
Through February, 2024, with lower quartile current 5-year total return of -11.4% relative to S&P 500 Composite, Surmodics’ total return performance is lower quartile relative to Surmodics Inc Peer Group.
VALUATION BENCHMARKS
Relative to S&P 500 Composite, SRDX’s overall valuation is high. The highest factor, the price/earnings ratio, is upper quartile. Ratio of enterprise value/earnings before interest and taxes is upper quartile. Ratio of enterprise value/assets is above median. Price/equity ratio is slightly above median. The lowest factor, the ratio of enterprise value/revenue, is below median.
Relative to Surmodics Peer Group, SRDX’s overall valuation is normal. The highest factor, the ratio of enterprise value/assets, is at the upper quartile. Price/equity ratio is at the upper quartile. Price/earnings ratio is at median. Ratio of enterprise value/revenue is below median. The lowest factor, the ratio of enterprise value/earnings before interest and taxes, is at the lower quartile.
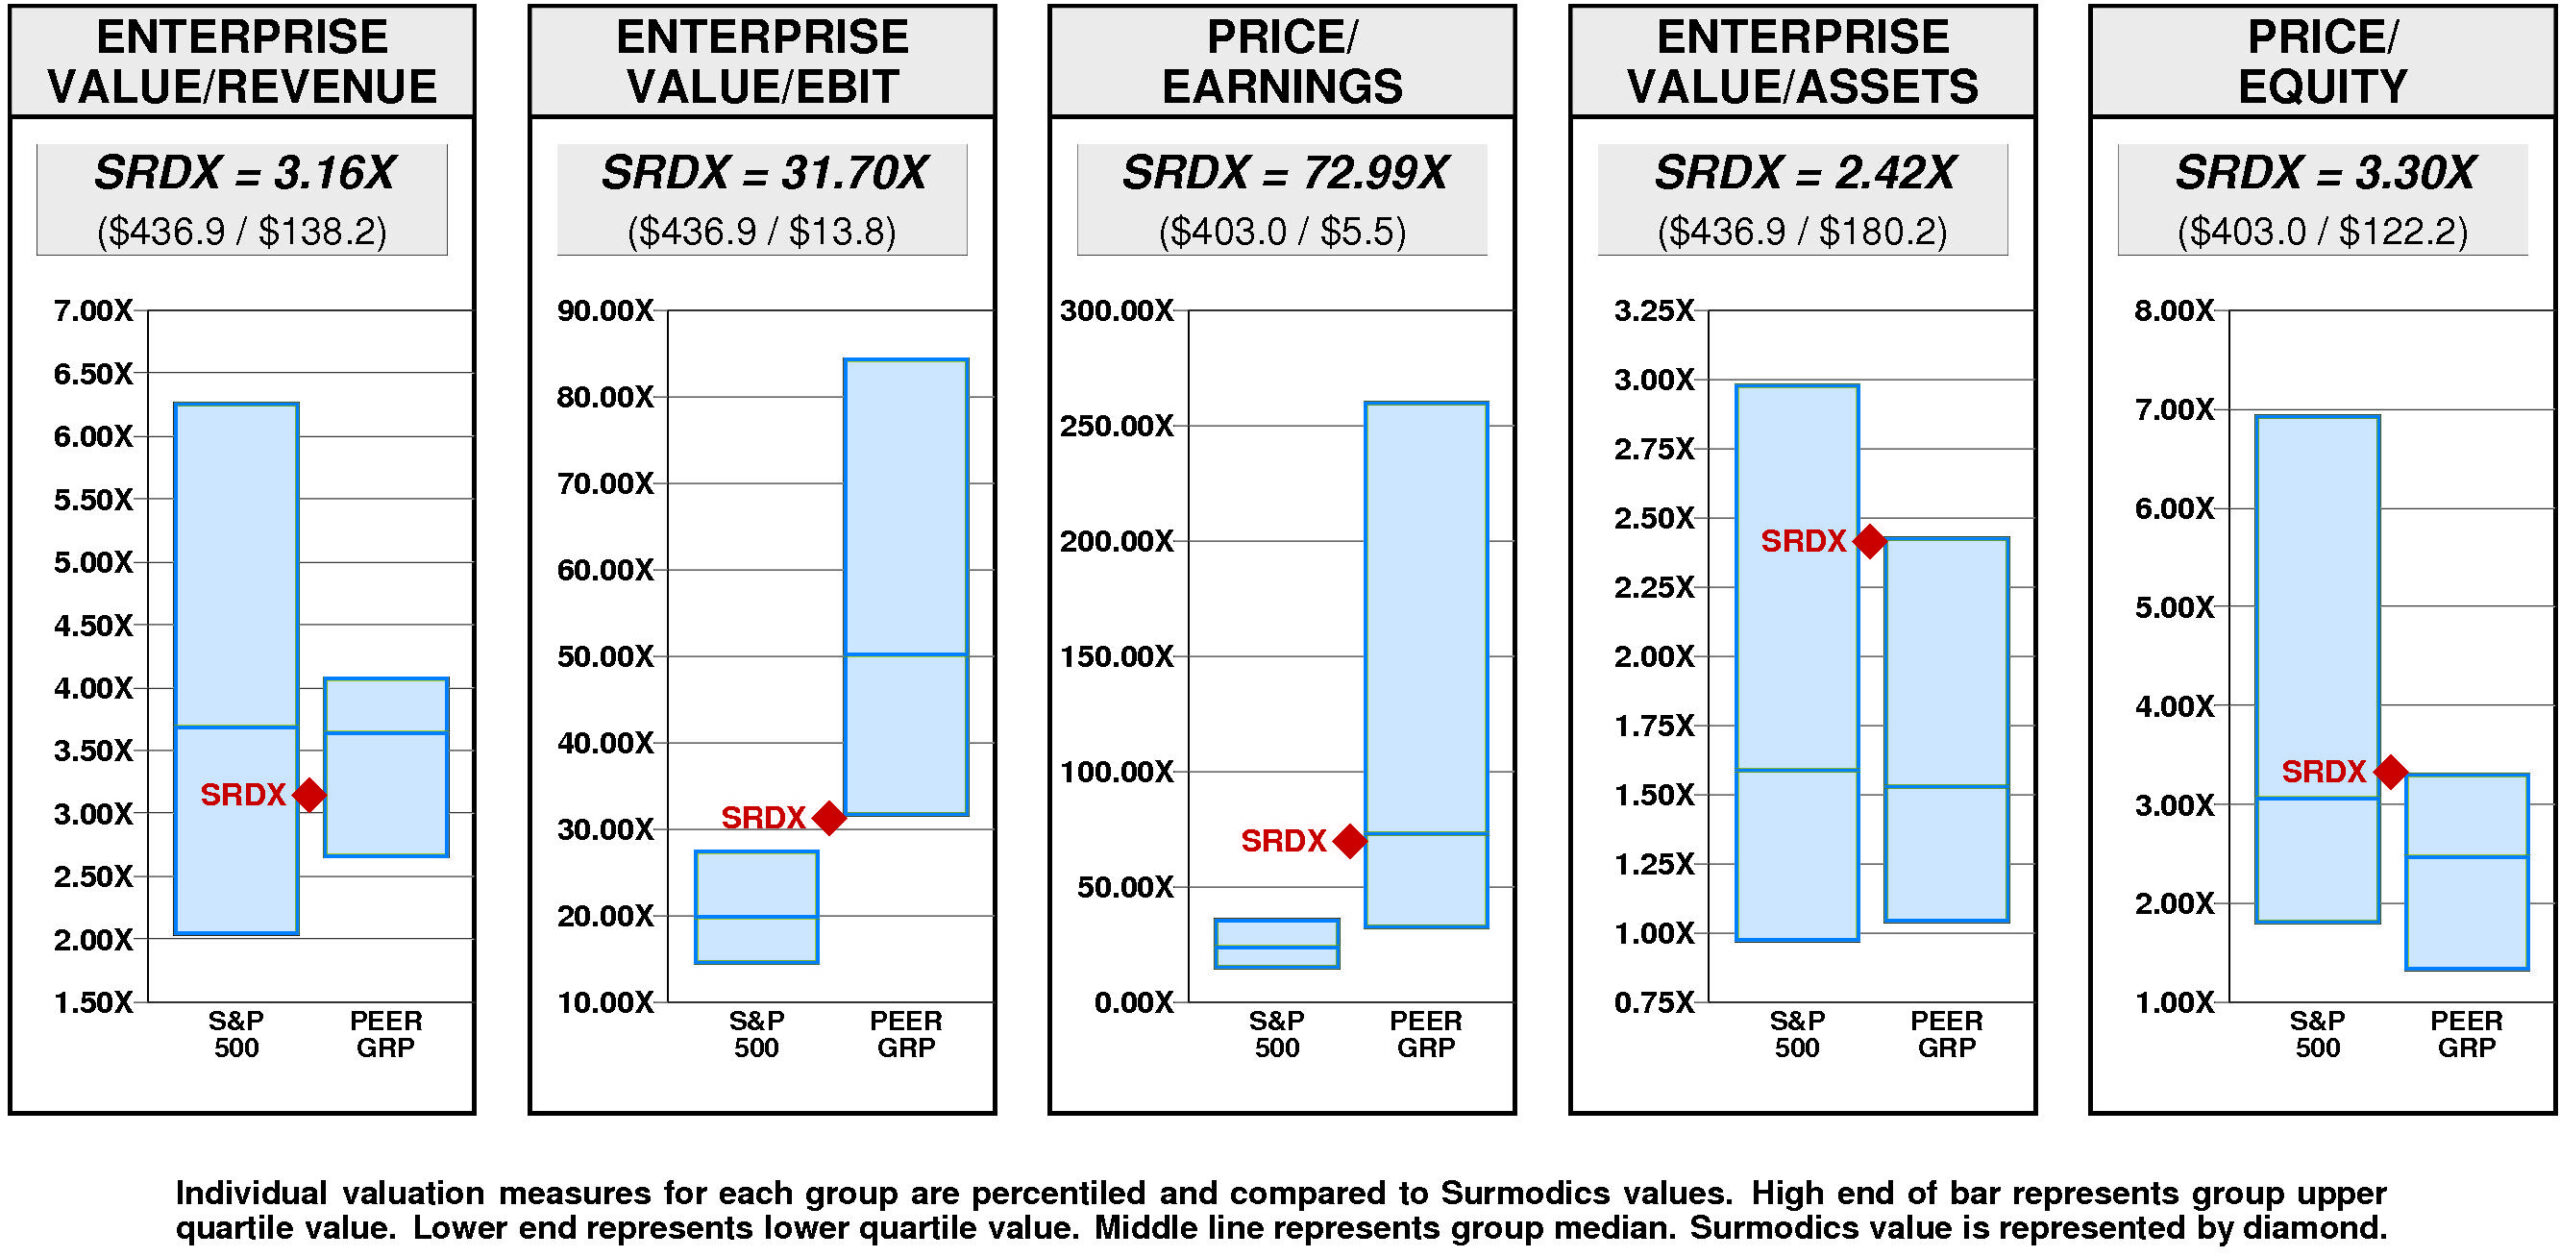
Surmodics has a large value gap compared to the median valuation. For SRDX to rise to median valuation, its current ratio of enterprise value/revenue would have to rise from the current level of 3.16X to 3.64X. If SRDX’s ratio of enterprise value/revenue were to rise to 3.64X, its stock price would be lower by $5 to $33.
For SRDX to hit lower quartile valuation relative to the Surmodics Peer Group, its current ratio of enterprise value/revenue would have to fall from the current level of 3.16X to 2.66X. If SRDX’s ratio of enterprise value/revenue were to fall to 2.66X, its stock price would decline by $-5 from the current level of $28.
VALUE TARGETS
SRDX’s future returns on capital are forecasted to be in line with the cost of capital. Accordingly, the company is expected to continue to be Value Creation neutral.
Surmodics’ current Price Target of $9 represents a -68% change from the current price of $28.31.
Surmodics’ very low appreciation potential results in an appreciation score of 6 (94% of the universe has greater appreciation potential.)
Notwithstanding this low Appreciation Score of 6, the high Power Rating of 71 results in an Value Trend Rating of D.
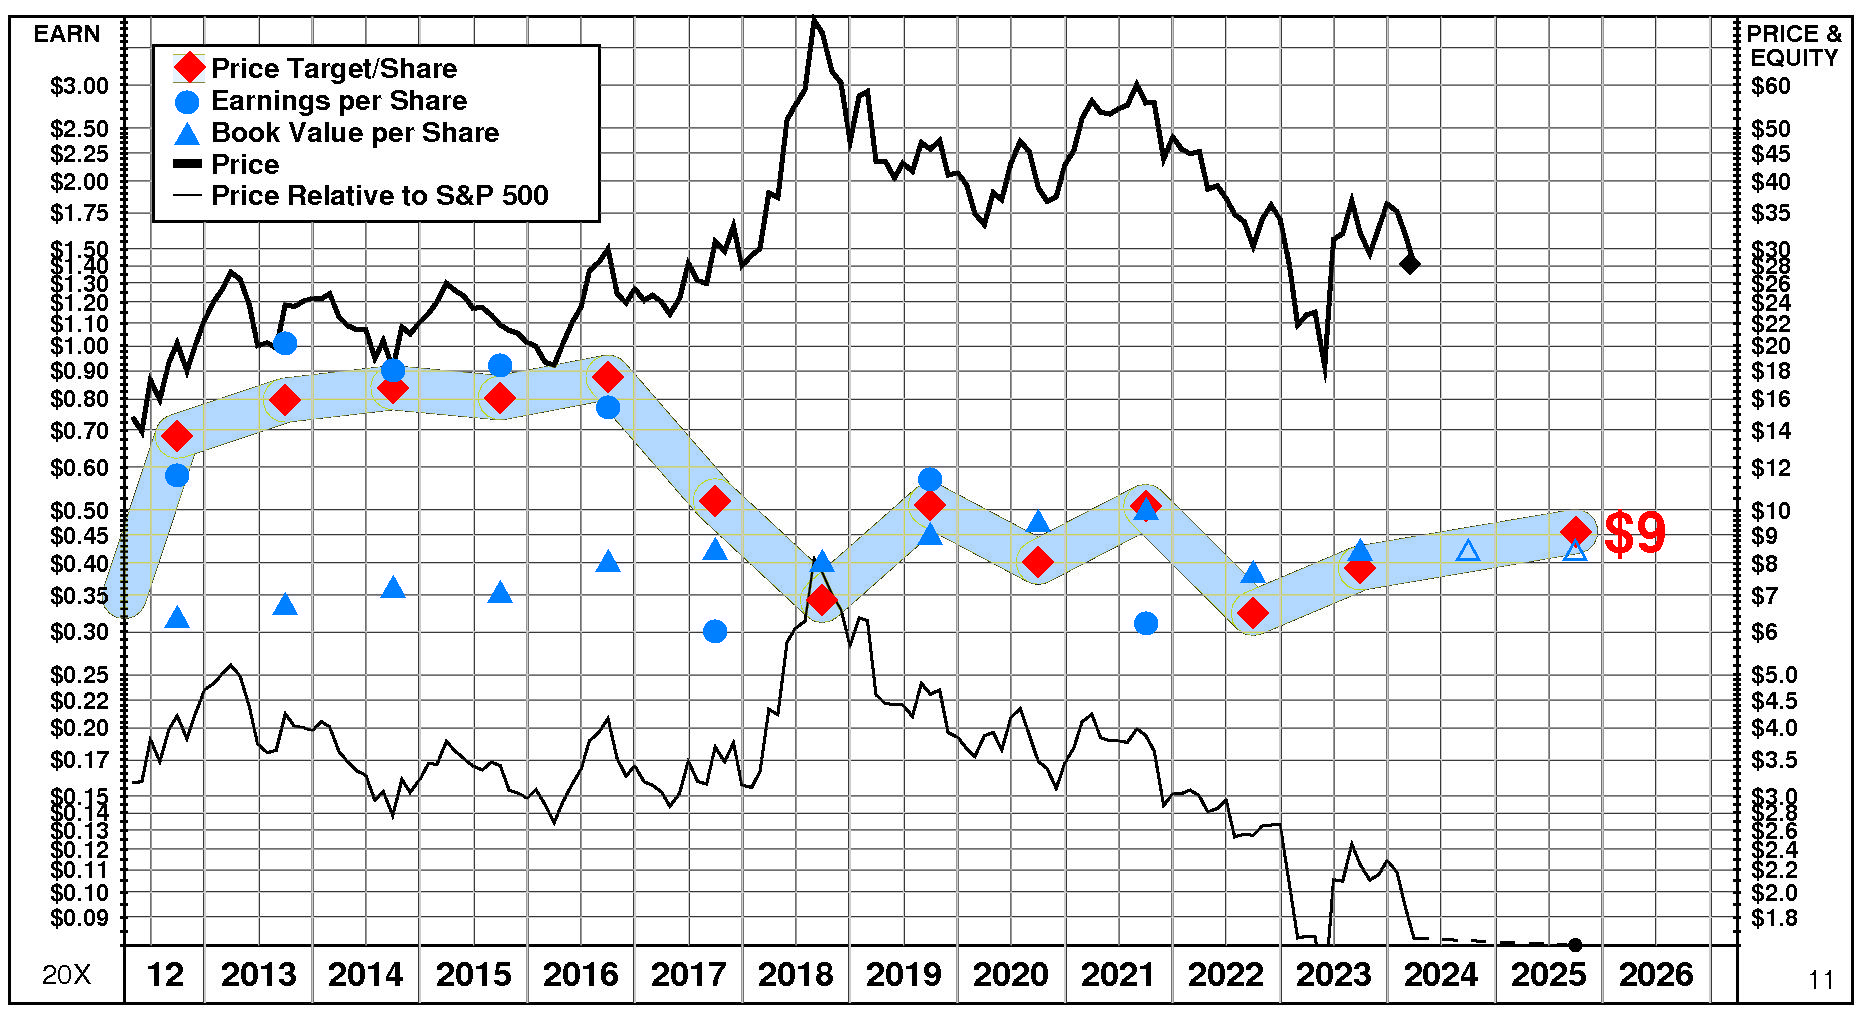
Surmodics’ current Price Target is $9 (+17% from the 2023 Target of $8 but -68% from the 03/14/24 price of $28.31). This slight rise in the Target is the result of a -3% decrease in the equity base and a +20% increase in the price/equity multiple. The forecasted decline in cost of equity has a very large positive impact on the price/equity multiple and the forecasted decline in growth has a slight positive impact as well. The forecasted flat return on equity has no impact.
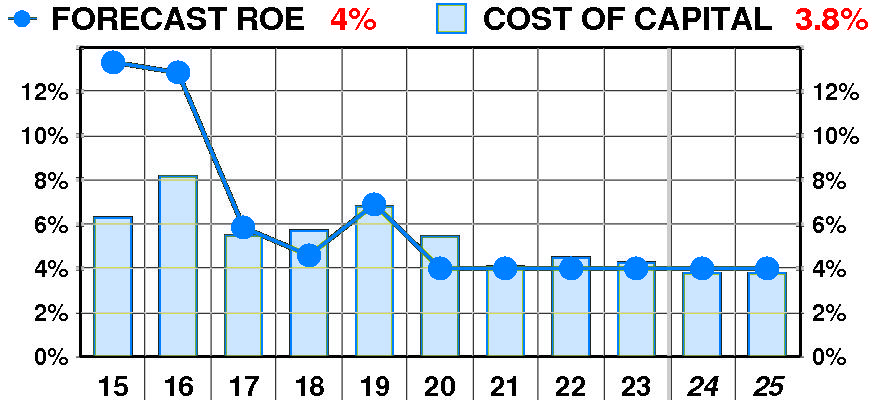
PTR’s return on equity forecast is 4.0% — in line with our recent forecasts. Forecasted return on equity suffered a dramatic, variable decline between 2015 and 2023. The current forecast is well below the 2015 peak of 13%.
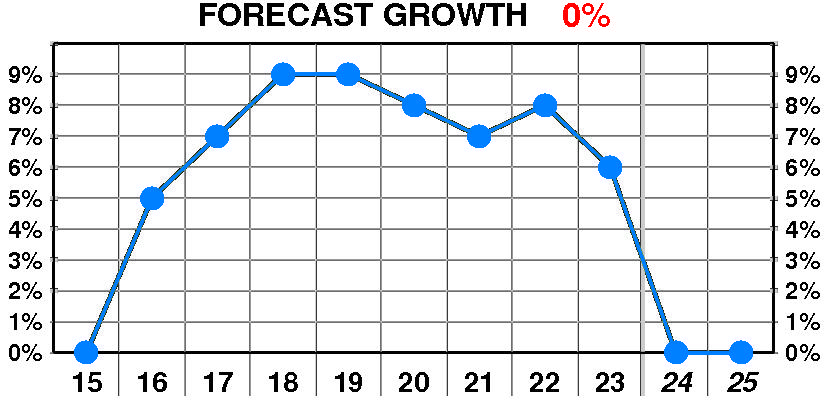
PTR’s growth forecast is 0.0% — below our recent forecasts. Forecasted growth exhibited a modest, erratic increase between 2016 and 2023. The current forecast is well below the 2019 peak of 9%.
PTR’s cost of equity forecast is 3.8% — in line with recent levels. Forecasted cost of equity enjoyed a dramatic, variable decline between 2015 and 2023. The current forecast is below the 2016 peak of 8.2%.
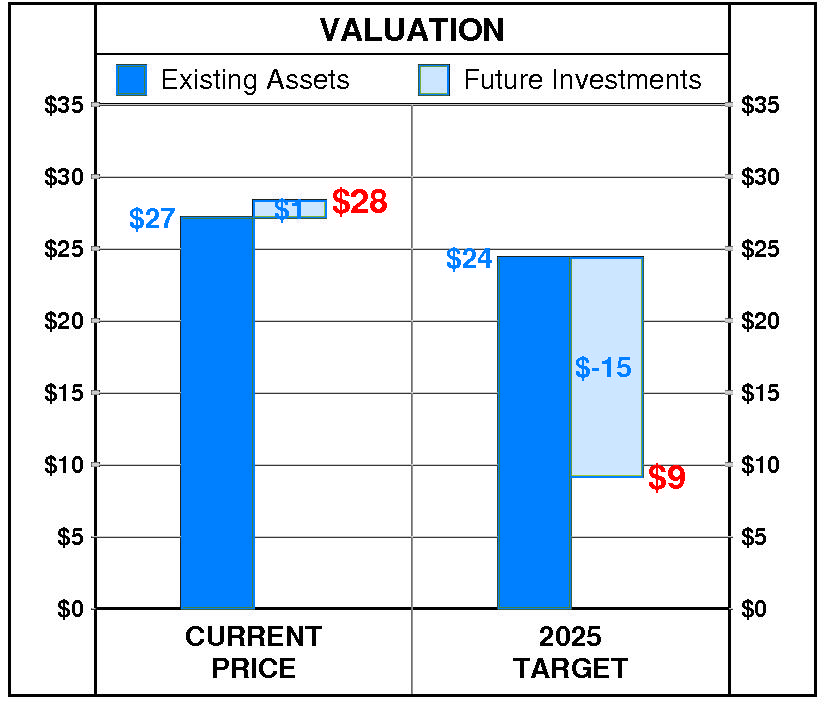
At Surmodics’ current price of $28.31, investors are placing a positive value of $1 on its future investments. This view is not supported by the company’s most recent performance that reflected a growth rate of 6.0% per year, and a return on equity of 4.0% versus a cost of equity of 4.3%.
PTR’s 2025 Price Target of $9 is based on these forecasts and reflects an estimated value of existing assets of $24 and a value of future investments of $-15.
Be the first to comment